

100pk
Introduction
I usually start my articles by reviewing any past coverage I’ve had of a stock, and to my surprise, it appears I’ve never analyzed United Parcel Service (NYSE:UPS) stock publicly before even though I do actively track it in my marketplace service, The Cyclical Investor’s Club. So, this will be a fresh perspective.
According to their 10-k filing UPS was…
…founded in 1907, is the world’s premier package delivery company and a leading provider of global supply chain management solutions. [They] offer a broad range of industry-leading products and services through our extensive presence in North America; Europe; the Indian sub-continent, Middle East and Africa; Asia Pacific and Latin America. [Their] services include transportation and delivery, distribution, contract logistics, ocean freight, air freight, customs brokerage and insurance.
[They] operate one of the largest airlines and one of the largest fleets of alternative fuel vehicles under a global UPS brand. [They] deliver packages each business day for approximately 1.7 million shipping customers to 11.8 million delivery customers in over 220 countries and territories.
As luck would have it, UPS stock has some interesting characteristics that will require some adjustments to my standard analysis, so let’s just get right into it.
My Valuation Method For UPS
The valuation method I use for UPS first checks to see how cyclical earnings have been historically. Once it is determined that earnings aren’t too cyclical, then I use a combination of earnings, earnings growth, and P/E mean reversion to estimate future returns based on previous earnings growth and sentiment patterns. I take those expectations and apply them 10 years into the future, and then convert the results into an expected CAGR percentage. If the expected return is really good, I will buy the stock, and if it’s really low, I will often sell the stock. In this article, I will take readers through each step of this process.
Importantly, once it is established that a business has a long history of relatively stable and predictable earnings growth, it doesn’t really matter to me what the business does. If it consistently makes more money over the course of each economic cycle, that’s what I care about the most.
FAST Graphs
Over the past 20 years or so, UPS has only experienced two years of negative EPS growth. They were both during the Great Recession in 2008 and 2009. The total decline for the two years, when 2007’s EPS of $4.11 fell to $2.31 by 2009, was about -46%. This is a fairly deep decline, but my standard threshold for a business to be declared a “deep cyclical” is a decline greater than -50%, and UPS’s EPS did not fall that far, so it is appropriate to use an earnings-based analysis as long as one accounts for the level of decline it did experience during the last recession. (Interestingly, FedEx (FDX) actually is a business I consider a “deep cyclical” so I use a different style of analysis for it even though it is a similar business as UPS.)
Identifying Boom/Bust Dynamic
Before we move on with the analysis, it is important that I identify any earnings outliers that could throw off our expectations of the future. I always start by using historical performance as a baseline for future expectations, but if there are one-time events that help or hurt earnings, we want to identify those and potentially control for them if we can, otherwise our expectations might be too optimistic or pessimistic.
FAST Graphs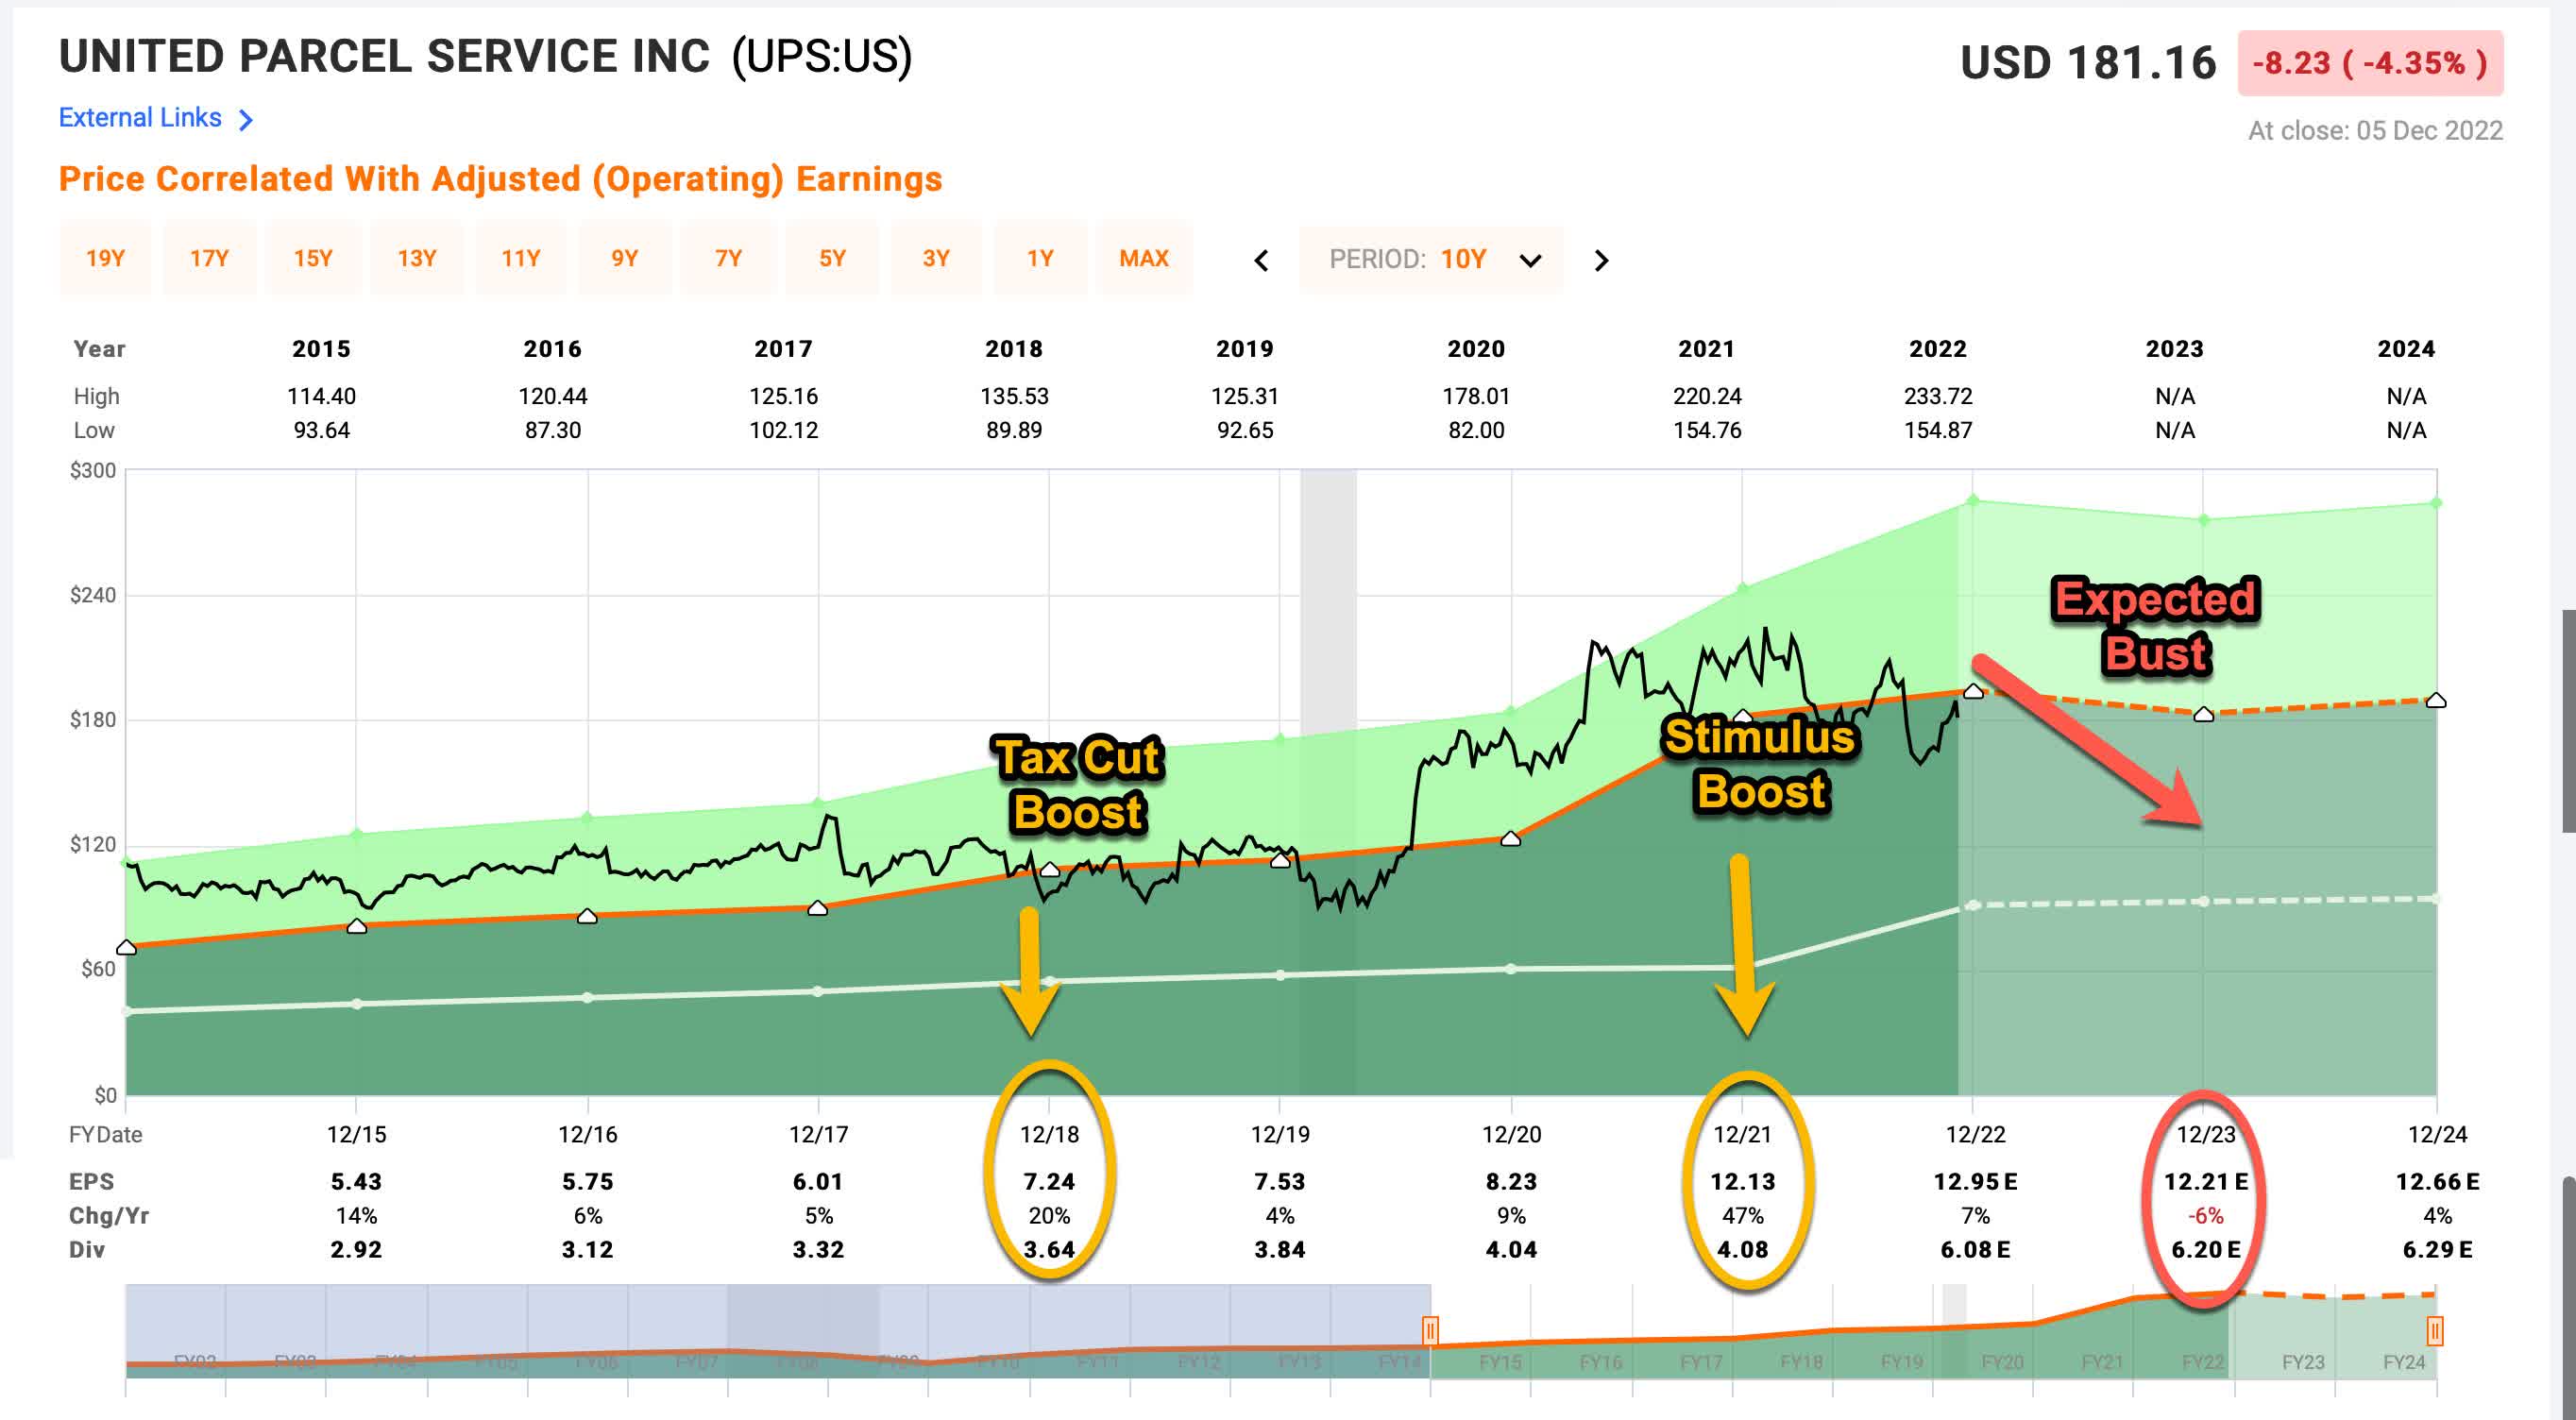
Above is a FAST graph that contains earnings and price data since 2015, and it also includes analysts’ expectations for 2023 and 2024 as well. The outlier worth pointing out is that UPS got a pretty big EPS boost in 2018, which likely came from corporate tax cuts. This will probably make our EPS growth rate a little on the optimistic side. I’m not going to control for it in my analysis, but it’s worth pointing out just in case anyone thinks I’m an eternal pessimist.
The bigger outlier that I will control for is 2021’s +47% EPS growth which coincided with massive amounts of government stimulus in the US. This amount of earnings growth is not only unlikely to continue but is actually likely to reverse in 2023 and 2024. Analysts already expect a -6% EPS decline in 2023, but I think that is probably too optimistic, so I’m going to make my own adjustments to account for the withdrawal of government stimulus.
The way I’m going to do that is to establish UPS’s earnings growth rate from 2007 through the end of 2019, before the pandemic started. Then I will use 2019’s EPS as a base, and extrapolate that growth rate out to the end of 2023 and see what EPS might have been without stimulus. Because the stimulus money is still floating around the economy, I will add 5% per year (roughly the core inflation rate) to the growth rate to account for that. In the end, we could get a decent post-stimulus EPS expectation for 2023, and then we can use that for the rest of our analysis. This should control for the pandemic boom/bust reasonably well and at least get us in the right ballpark for our 2023 expectations.
One thing we also need to control for since I am using EPS growth is the effect that share buybacks have had on earnings because reducing the number of shares will inflate the EPS.
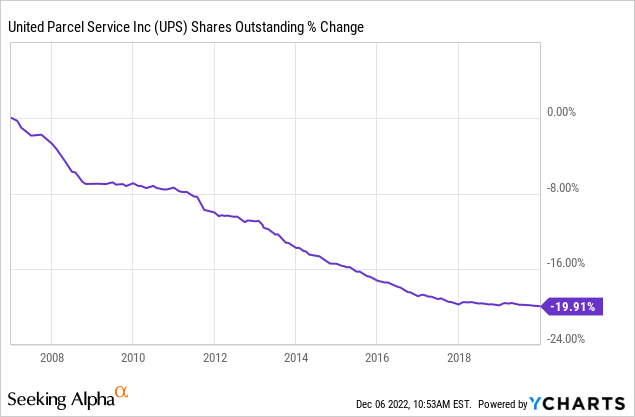
From 2007 until 2020, UPS bought back about 20% of the company. I will control for those buybacks as well as include the 2008 and 2009 EPS declines for my earnings growth estimates for this period.
FAST Graphs
After controlling for the declines in 2008/9 and the reduced share count, I get an “organic” earnings growth estimate from 2007-2019 of +3.34%. That’s more conservative than the +5.27% FAST Graphs calculates during this time frame. If I take that 3.34% earnings growth rate and add on 5% per year for inflation from 2020 through the end of 2023, that gives me an earnings growth rate that accounts for inflation and UPS’s long-term earnings growth trend. When I apply that growth rate to the base earnings from 2019 of $7.53 and assume earnings in 2020-2023 grow at a +8.34%, I get a stimulus-adjusted EPS expectation for 2023 of $10.40 per share. This is quite a bit smaller than the $12.21 per share that the market currently expects, but I think it is more realistic given that there is no more stimulus rolling into the economy and a recession is likely. So, for my analysis, I will assume UPS has $10.40 of EPS in 2023 and grows at a rate of +3.34% after that.
UPS Stock — Market Sentiment Return Expectations
In order to estimate what sort of returns we might expect over the next 10 years, let’s begin by examining what return we could expect 10 years from now if the P/E multiple were to revert to its mean from the previous economic cycle. For this, I’m using a period that runs from 2015-2022.
UPS’s average P/E from 2015 to the present has been about 18.53. Using 2023’s forward earnings estimates of $10.40 per share UPS has a current P/E of 16.92. If that 16.92 P/E were to revert to the average P/E of 18.53 over the course of the next 10 years and everything else was held the same, UPS’s price would rise and it would produce a 10-Year CAGR of +0.91%. That’s the annual return we can expect from sentiment mean reversion if it takes 10 years to revert. If it takes less time to revert, the return would be higher.
Business Earnings Expectations
We previously examined what would happen if market sentiment reverted to the mean. This is entirely determined by the mood of the market and is quite often disconnected, or only loosely connected, to the performance of the actual business. In this section, we will examine the actual earnings of the business. The goal here is simple: We want to know how much money we would earn (expressed in the form of a CAGR %) over the course of 10 years if we bought the business at today’s prices and kept all of the earnings for ourselves.
There are two main components of this: the first is the earnings yield and the second is the rate at which the earnings can be expected to grow. Let’s start with the earnings yield (which is an inverted P/E ratio, so the Earnings/Price ratio). The current earnings yield is about +5.91%. The way I like to think about this is, if I bought the company’s whole business right now for $100, I would earn $5.91 per year on my investment if earnings remained the same for the next 10 years.
The next step is to estimate the company’s earnings growth during this time period. I do that by figuring out at what rate earnings grew during the last cycle and applying that rate to the next 10 years. I did that in the previous section and I think UPS’s real EPS growth rate will be around +3.43% after 2023.
Next, I’ll apply that growth rate to current earnings, looking forward 10 years in order to get a final 10-year CAGR estimate. The way I think about this is, if I bought UPS’s whole business for $100, it would pay me back $5.91 plus +3.34% growth the first year, and that amount would grow at +3.34% per year for 10 years after that. I want to know how much money I would have in total at the end of 10 years on my $100 investment, which I calculate to be about $171.13 including the original $100. When I plug that growth into a CAGR calculator, that translates to a +5.52% 10-year CAGR estimate for the expected business earnings returns.
10-Year, Full-Cycle CAGR Estimate
Potential future returns can come from two main places: market sentiment returns or business earnings returns. If we assume that market sentiment reverts to the mean from the last cycle over the next 10 years for UPS, it will produce a +0.91% CAGR. If the earnings yield and growth are similar to the last cycle, the company should produce somewhere around a +5.52% 10-year CAGR. If we put the two together, we get an expected 10-year, full-cycle CAGR of +6.43% at today’s price.
My Buy/Sell/Hold range for this category of stocks is: above a 12% CAGR is a Buy, below a 4% expected CAGR is a Sell, and in between 4% and 12% is a Hold. A +6.43% expected CAGR makes UPS stock a “Hold” using these assumptions and means it’s roughly fairly valued here.
In order for UPS stock to become a “Buy”, the price would have to fall below about $122 per share, or about -30% lower than today’s price, at which point it would become attractive. I would use this buy price for all of 2023 unless analysts lower their EPS expectation below $10.40 per share.
Conclusion
We are in a tricky time in the market when often a lot of adjustments need to be made to perform a reasonable medium or long-term analysis of a stock. We’ve had a long run since the last substantial recession in 2009. We’ve had tax cuts, a pandemic, massive stimulus, inflation, war, and a rapidly tightening Federal Reserve. But if we take a step back and use some common sense and conservative estimates, there are stocks like UPS we can at least get a reasonable approximation of what sort of future returns they might produce.
I think the most likely outcome is that at some point in 2023, UPS earnings disappoint expectations and the stock price overreacts and sells off, creating a reasonably good buying opportunity for those investors who are willing to wait. For those currently holding the stock at today’s price, UPS is likely to produce returns similar to the S&P 500 over the medium term from here.
Be the first to comment