

User2547783c_812
As we approach year end and look forward to 2023, a top question on the minds of investors is whether the price of crude oil is signaling the end of the energy stock bull market.
Of primary concern within the investment community is the outperformance of energy stocks in relation to the price of oil. The Energy Select Sector SPDR® Fund (NYSEARCA:XLE) has returned greater than 50% over the past twelve months compared to just 5% for the price of Brent crude oil and 0% for WTI oil.
Risk/Reward Rating: Positive
As Brent crude is a global price, I will use it as the benchmark for oil. The following 5-year weekly charts provide initial context for examining the outperformance of energy stocks in relation to crude oil. In the following oil chart, notice that the higher green line marks the current price and is the upper bound of what should be a strong technical support zone. The zone is bracketed by the green horizontal lines. Please note that in all price charts herein that the gold line is the 50-period moving average and the grey line is the 200-period moving average (weekly or monthly moving average).
Crude Oil Brent 5-year weekly chart (Created by Brian Kapp using a chart from Barchart.com)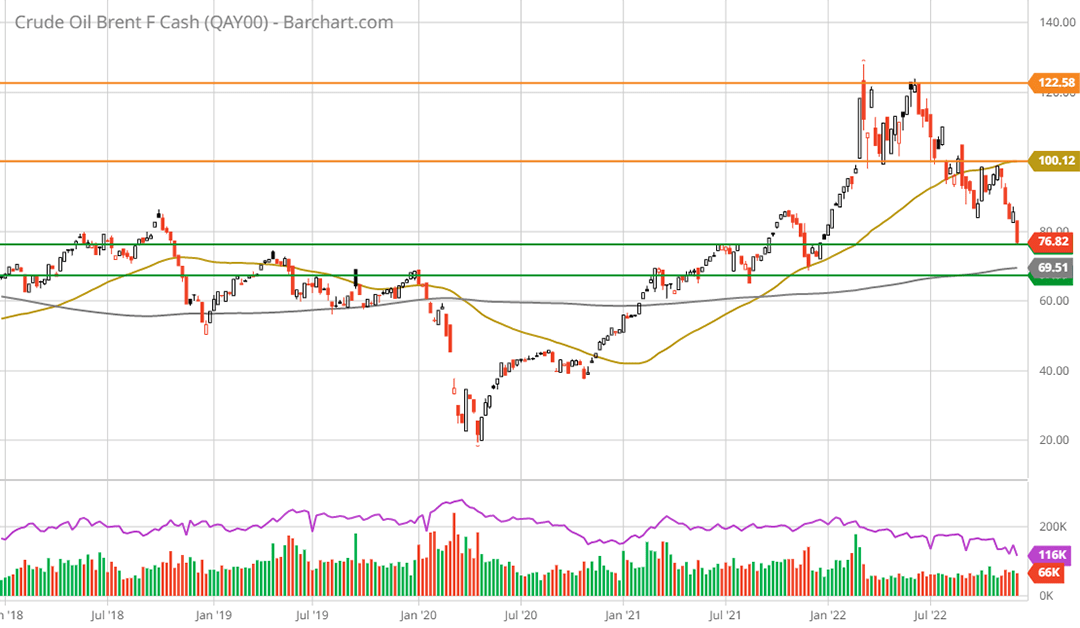
The $70 to $80 range served as resistance in a sideways consolidation during 2018 and 2019. Following the COVID crash, oil first reached the current price of $76 in June 2021. Using June 2021 as a reference point, the following 5-year weekly chart of The Energy Select Sector SPDR® Fund illuminates the divergence between the price of oil and energy stocks. The June 2021 XLE price is highlighted by the green horizontal line.
Energy Select Sector SPDR® Fund XLE 5-year weekly chart (Created by Brian Kapp using a chart from Barchart.com)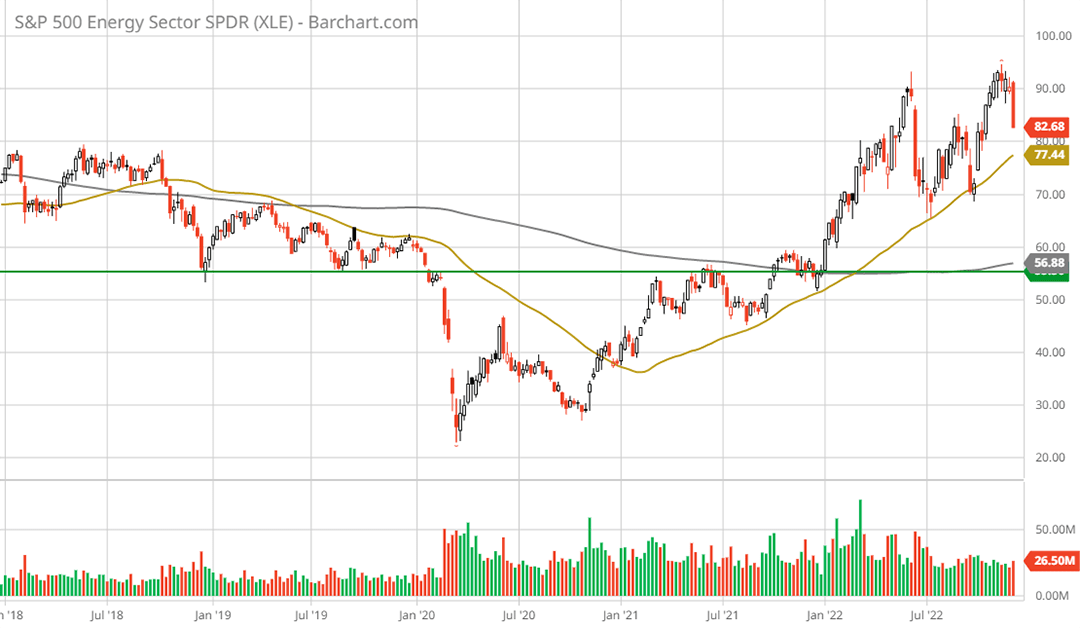
With energy stocks 50% above the level of June 2021 and oil having completed a round trip, investors are right to ask the question: is the sun setting on energy stocks?
The Energy Select Sector SPDR® Fund
In order to answer this question, further context is needed. The XLE is designed to track the energy sector components within the S&P 500 index. They account for 4.9% of the total value of the stock market, using the S&P 500 as the market index. A full list of the energy stocks and their weighting in the sector is displayed below. The table was compiled from State Street Corporation.
Source: State Street Corporation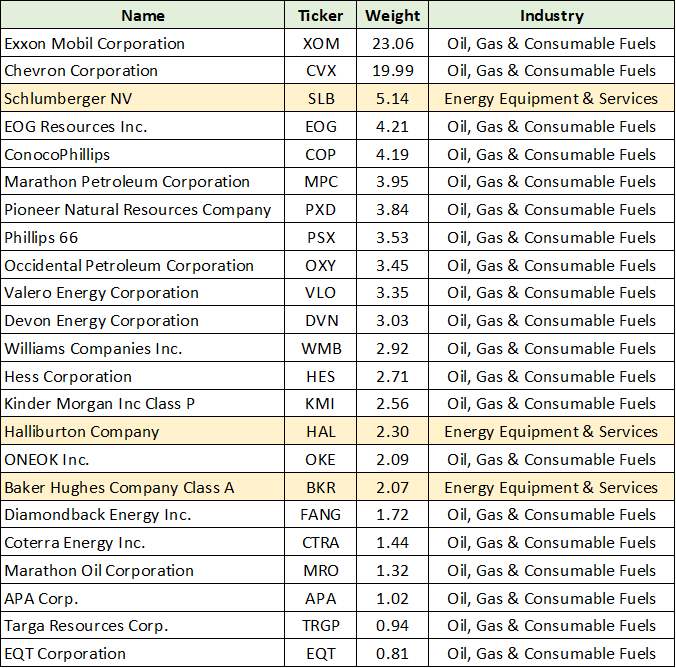
I have highlighted in yellow the energy equipment and services companies within the XLE. They account for just 9.5% of the sector and 0.4% of the S&P 500. As covered in the October 3 report, “A Top Sector Choice For The Coming Cycle,” the industry is timely given the early stage of the oil and gas capex upcycle.
Additionally, the cyclical upturn is occurring alongside secular growth opportunities due to the energy transition. The future looks decidedly bright for the energy equipment and services industry. That being said, 75% of the value in the energy sector is comprised of the oil and gas producers, with 15% exposure to pipelines and processors. As a result, energy prices are a primary driver of sector returns.
The Big Picture
With energy prices driving returns, the round trip in the price of crude oil is front and center. Of utmost importance for investors is the equilibrium price of crude oil looking out over the intermediate term. The recent reversal lower in the price of oil requires further context. The following 20-year monthly chart of Brent crude oil offers a bird’s eye view.
Crude Oil Brent 20-year monthly chart (Created by Brian Kapp using a chart from Barchart.com)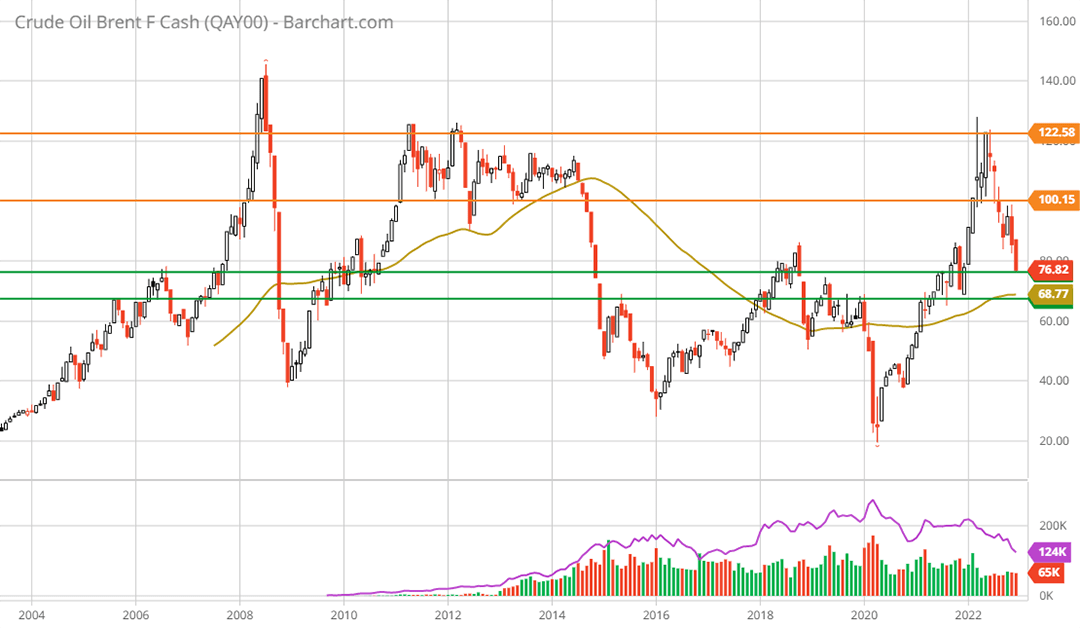
The key technical support zone highlighted by the green horizontal lines remains unchanged from the prior 5-year weekly chart. Notice that the lower end of the support zone was first reached in 2005 and the upper end in 2006. The price of oil has been in a trading range between $40 and $120 for much of the past 18 years.
What is most interesting in the above chart is how little time oil has spent trading between $75 and $100, or between the upper green line and the lower orange line. Over the past 18 months, oil has traded in this range much more frequently, hinting at a possible equilibrium price zone.
Prior to the late 2014 price collapse, oil traded in a tight range between $100 and $120 for over three years. This range was the last stable equilibrium price before shifting to a volatile trading range between $40 and $75 from 2015 to 2021. The central tendency between 2015 and 2021 was roughly $60 per barrel.
Returning to the key question, what is the most likely equilibrium price of crude oil over the intermediate term?
What Happened In 2014?
To reach an estimate we must review what happened in the second half of 2014 which caused the price of oil to collapse from its stable trading range of $100 to $120. The following chart from Trading Economics captures the primary cause of the shift lower in oil prices following 2014. It displays US oil production over the past 20 years.
Source: Trading Economics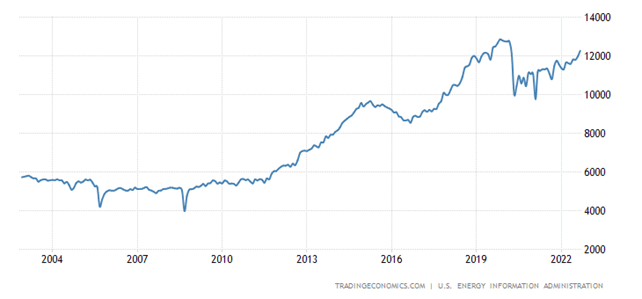
Beginning in 2012, US oil production began to soar and more than doubled by 2019. The energy markets absorbed one of the largest and most rapid additions to global supply in modern times. Between 2012 and 2021, global oil demand increased by roughly the same amount as US oil production. With little room for supply growth in the rest of the world, the price of oil adjusted lower beginning in the second half of 2014.
It is worth noting that Chinese GDP growth also ratcheted lower from over 10% per year prior to 2012 to the mid 7% range through 2015. From 2016 to 2019 GDP growth slowed to around 6%. The OECD forecasts China’s GDP growth to be about 4% through 2024.
In summary, a substantial growth deceleration in China coincided with the historic supply increase from US energy producers. In this context, the oil price collapse during the second half of 2014 and the lower trading range through 2021 makes sense.
Today, US producers are squarely focused on shareholder returns and are unlikely to expand production materially. This is evidenced by the draw down in DUCs (drilled but uncompleted wells) as discussed in “A top sector choice for the coming cycle.” From the report:
Oil and gas producers in the US are restricting available well inventory to the lowest levels in a decade, and beneath the level reached in 2013.
Natural Gas
A feature of most US shale oil wells is that they also produce a significant amount of natural gas. On average, roughly half of the production volume is oil and half natural gas. In fact, three of the top five natural gas producing states are also among the largest oil producing states. Texas is the largest producer of each.
As a result, natural gas is equally important for the energy sector. The above oil supply chart is mirrored in US natural gas production, as can be seen in the following image from the EIA.
Source: EIA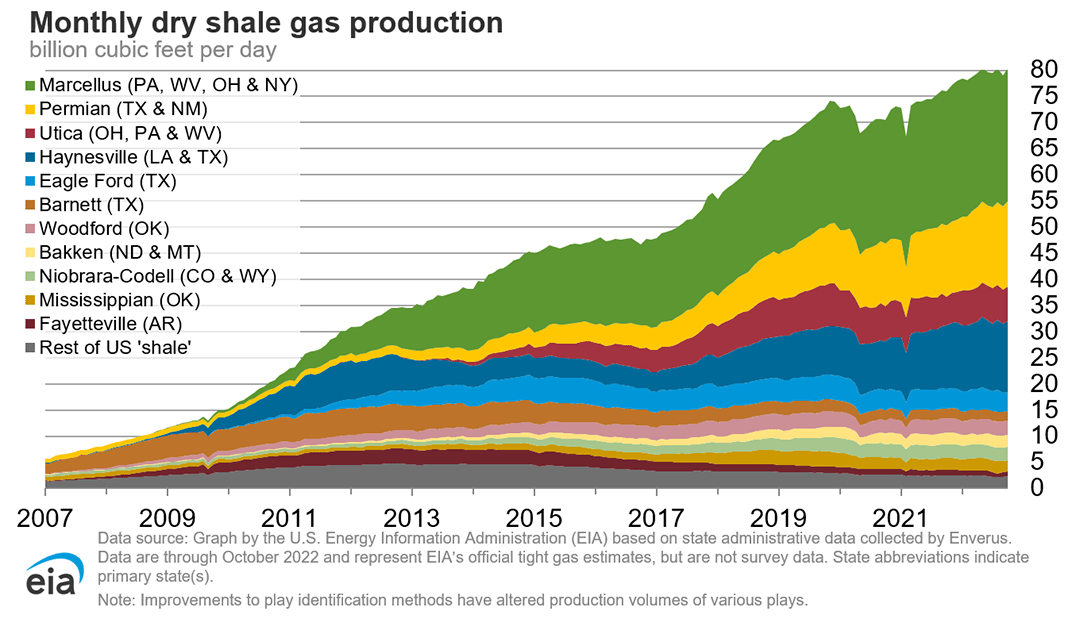
The explosion of US production had a similar effect on the price of natural gas as is it did for oil, as can be seen in the following 20-year monthly chart. Please note that the orange lines represent a resistance zone dating back to 2010. The zone served to cap the price during the doubling of US oil production. Importantly, since August 2021, natural gas has found support at this prior resistance zone which spans the mid-$4 to $6 range.
Natural Gas 20-year monthly chart (Created by Brian Kapp using a chart from Barchart.com)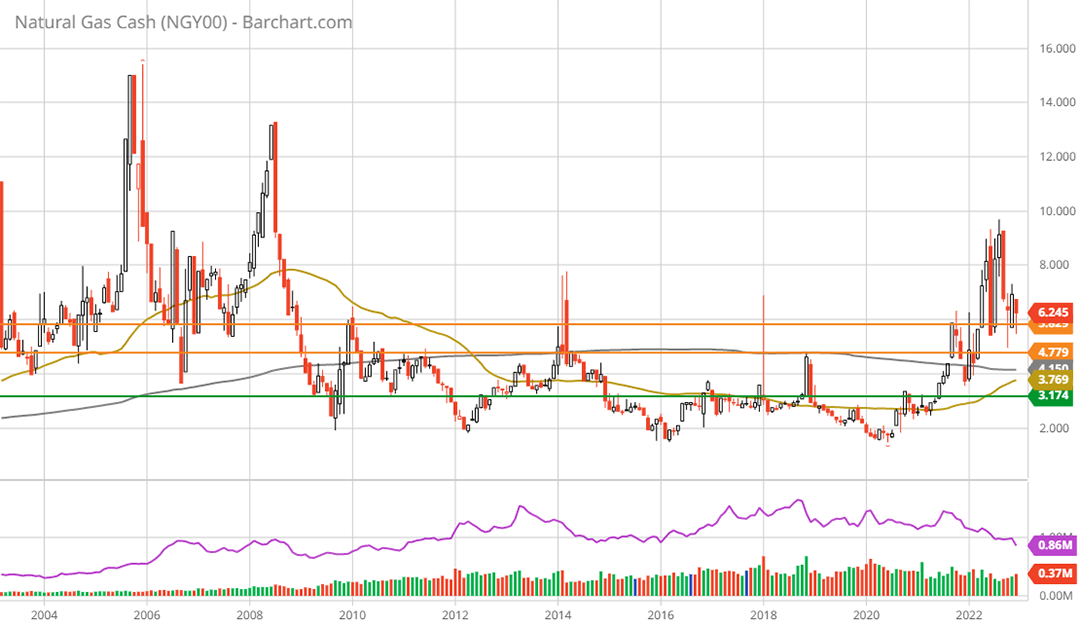
For comparison to the prior oil and XLE charts, the green line marks the June 2021 price level. Unlike oil, natural gas remains well above the level reached in June 2021, at double the price. In this light, energy stocks remaining 50% above the level reached in June 2021 receives support and largely offsets oil’s round trip.
The dominant market force for US natural gas prices over the last decade was the explosion of gas supply associated with oil production growth. Importantly, future US oil production growth looks likely to be mild at best and is largely in the rearview mirror.
As a result, a major headwind for natural gas prices, US oil production growth, has been removed. Projections for US natural gas supply growth through 2050 suggest a much more supportive pricing environment than was the case over the past decade. The following image displays the EIA’s forecast.
Source: EIA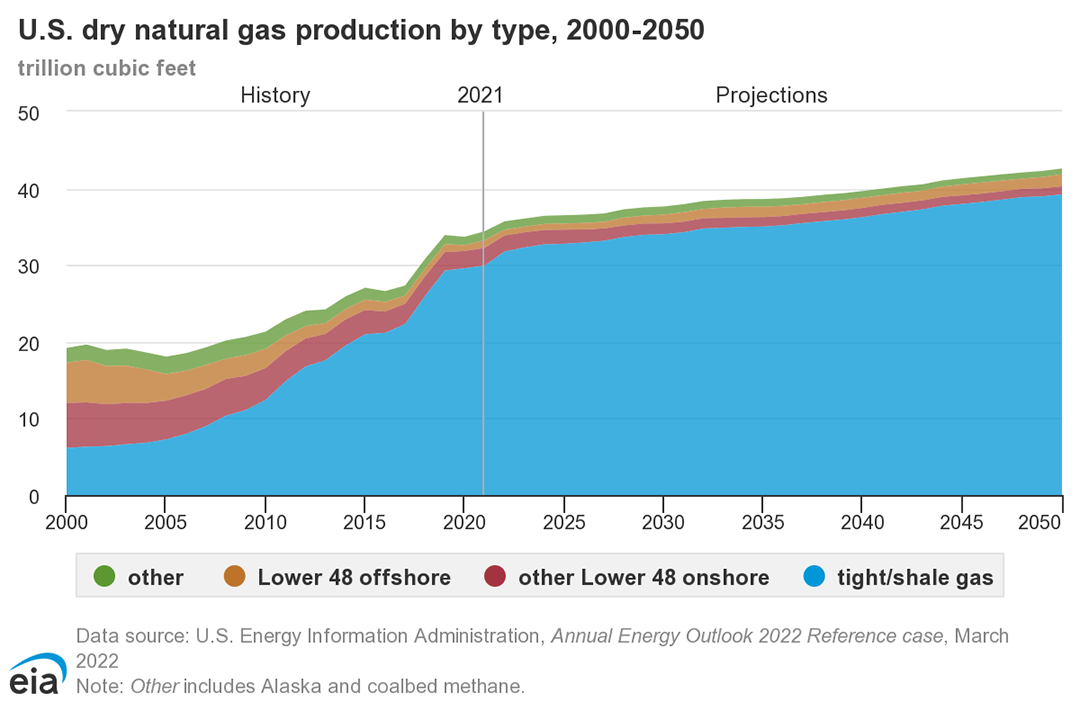
There is no doubt that natural gas is a primary energy source for the coming decades. It is a replacement for coal which still accounts for a greater share of primary energy generation globally. As can be seen in the following image from the bp Statistical Review of World Energy 2022 | 71st edition, natural gas is growing while oil and coal are declining as a percentage of primary energy demand.
bp Statistical Review of World Energy 2022 | 71st edition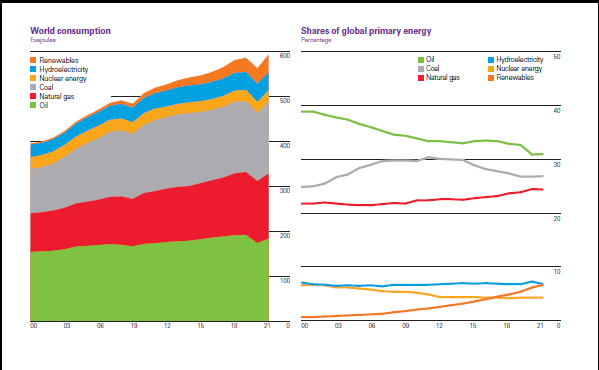
Oil Equilibrium Price
With a positive outlook for natural gas prices relative to the past decade, the question turns back to the likely equilibrium price for oil over the intermediate term. The EIA offers the following forecast which I view as being well supported.
Despite the recent drop in crude oil prices, we still expect that falling global inventories of oil in early 2023 will push Brent prices back above $90/b by the beginning of the second quarter of 2023 (2Q23)… We forecast the Brent crude oil spot price will average $92/b for all of 2023.
A recent OPEC report estimates global oil demand to grow by 13% through 2045 to 110 million barrels per day from 97 million in 2021. While the annual growth rate for oil demand is expected to be minimal, there is a natural production decline from existing wells with which to contend.
In the following image, McKinsey estimates that exploration and production companies will need to find and develop an additional 38 million barrels of daily crude oil production through 2040. This will be needed to fill the gap left by production declines.
Source: McKinsey Global oil outlook to 2040 summary report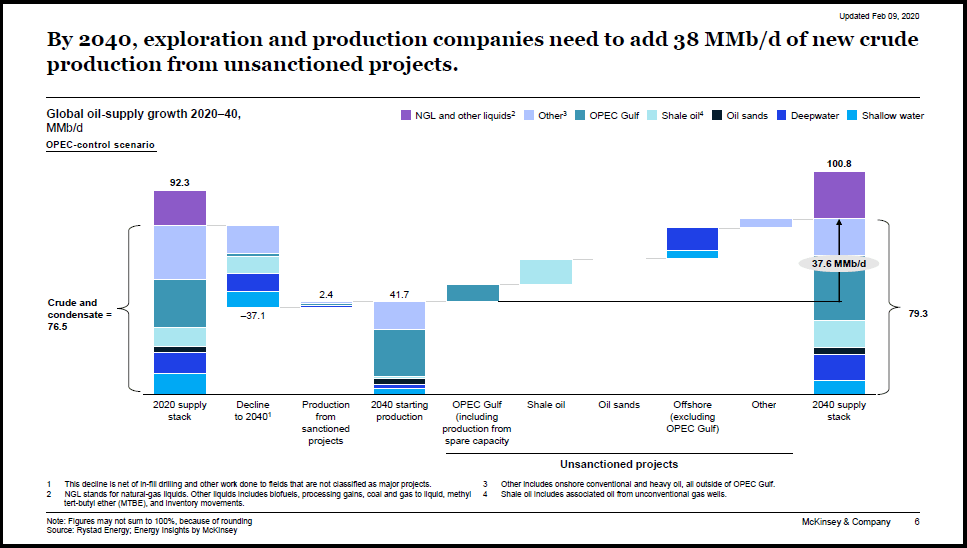
OPEC’s estimate of $12.7 trillion in required capex for oil alone supports an inflationary cost backdrop. The energy services and equipment industry is a relative winner in an environment of muted oil demand growth and heavy capital expenditure requirements.
In contrast to the near-term EIA estimate of $92 for Brent crude in 2023, McKinsey estimates that the equilibrium price through 2040 will be $50 to $60 per barrel. From the report:
Long-term equilibrium oil prices have decreased by $10 to $15/bbl compared with pre-COVID-19 outlooks, as driven by a flattening cost curve and lower demand. Under an OPEC-control scenario, in which OPEC maintains its market share, we see a $50 to $60/bbl equilibrium price range in the long term.
The McKinsey report was published in February 2021. I view the timing of the report to be an excellent window into the downside scenario for oil. The pandemic was still raging and thus negatively influenced the outlook in the extreme. For example, McKinsey estimated that oil would remain in the $50 to $55 area through 2025. This forecast has since proven to be far too conservative.
The McKinsey estimate pre-COVID was for an equilibrium price of $60 to $75 per barrel though 2040. This is an excellent lower-end equilibrium estimate as McKinsey’s projection of a flattening cost curve has run into inflationary realities.
As discussed in “A Top Sector Choice For The Coming Cycle,” the energy equipment and services industry is supply constrained and has increasing pricing power. Cost push inflation is likely to remain elevated going forward thus putting further upward pressure on the price of oil. OPEC’s estimate of $12.7 trillion of required capex for oil alone supports an inflationary cost backdrop.
In summary, an equilibrium oil price of $60 to $75 is an excellent low-end estimate. This price range is technically well-supported by the long-term support zone between $70 and $80 that was discussed in the opening. In this light, the $92 estimate by the EIA over the nearer term appears quite reasonable. This is especially the case with oil spending an increasing amount of time trading in the $75 to $100 range over the past year.
Finally, there is historical evidence for an equilibrium price in the $100 to $120 range as it prevailed prior to the 2014 US supply-induced collapse. As this major headwind is now in the rearview mirror, a return to the $100 to $120 equilibrium range serves as an excellent upside price scenario.
With a likely equilibrium price for oil in the $60 to $120 range over the intermediate term and a $90 central tendency, energy companies should continue to perform quite well. This is especially the case with the improved pricing outlook for natural gas.
Consensus Estimates
Given the generally favorable energy price outlook, the question turns to consensus growth estimates and valuations. State Street reports the PE of The Energy Select Sector SPDR® Fund to be 8x the consensus earnings estimate for the current year, with a dividend yield near 3.4%.
A cursory glance at consensus estimates for the top two companies, Exxon Mobil (NYSE:XOM) and Chevron (NYSE:CVX), confirms State Street’s numbers. Exxon and Chevron alone account for 43% of the energy sector. The following consensus estimate tables were compiled from Seeking Alpha.
Source: Seeking Alpha. Created by Brian Kapp, stoxdox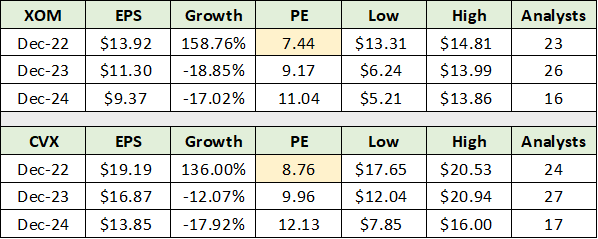
Notice that consensus estimates are for a material earnings decline through 2024. Consensus projections likely reflect the more bearish McKinsey price scenario. With bearish to mild pricing assumptions through 2024, there is upside surprise potential. Regardless, valuations remain quite low at 8x to 12x earnings through 2024. For reference, the S&P 500 is trading at 18x 2023 consensus estimates.
Energy Opportunities
With much of the sector value dominated by just two companies, there may be more interesting opportunities beneath the surface. I covered several leading oil and gas producers in the following reports:
The following table displays consensus estimates for Occidental Petroleum (NYSE:OXY), EOG Resources (NYSE:EOG), and Pioneer Natural Resources (NYSE:PXD).
Source: Seeking Alpha. Created by Brian Kapp, stoxdox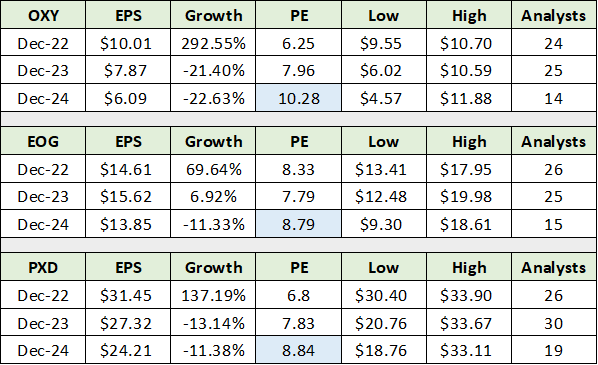
I have highlighted in blue the valuation on 2024 consensus estimates. Each of the above companies trades at a material discount to Exxon and Chevron through 2024. For commodity producers, relative valuations are especially relevant. As a result, a market capitalization-weighted energy portfolio is likely to underperform a more opportunistic approach.
In the energy equipment and services industry, I first reviewed Schlumberger (NYSE:SLB) on December 21, 2021 in “Schlumberger Is A Top Choice For Cyclical Growth.” Consensus estimates for Schlumberger continue to paint a growth stock picture with significant valuation expansion potential over the intermediate term.
Source: Seeking Alpha. Created by Brian Kapp, stoxdox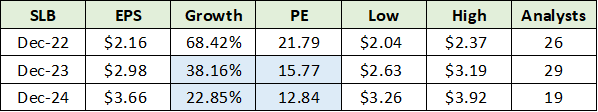
I have highlighted in blue Schlumberger’s expected earnings growth rate and valuation for 2023 and 2024. Schlumberger offers one of the most attractive growth profiles in the energy space and across the broad large-cap stock universe. Investors would be hard pressed to find a similar growth profile for a large cap stock, including technology companies.
Outside of the capitalization-weighted sector fund, there are many asymmetric risk/reward opportunities in the energy space. I covered two small cap gas producers in the following reports:
- “Chesapeake Energy Looking Up After Bankruptcy” – June 24, 2021
- “CNX Resources: The Saudi Arabia Of Natural Gas” – September 7, 2022
Consensus earnings estimates for Chesapeake Energy (NASDAQ:CHK) and CNX Resources (NYSE:CNX), are displayed below. I have highlighted the valuation of each on 2024 consensus earnings estimates. The relative valuations are a fraction of Exxon and Chevron, and roughly half that of Occidental, Pioneer, and EOG.
Source: Seeking Alpha. Created by Brian Kapp, stoxdox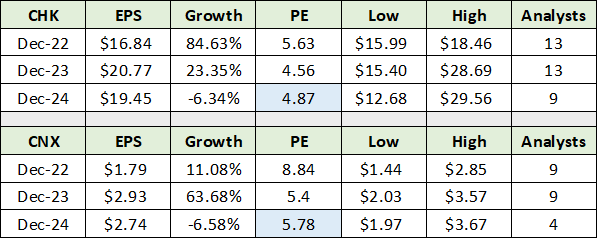
Summary
The energy sector trades at a steep discount to the market, with the S&P 500 trading at 18x 2023 estimates. Conditions remain supportive of continued outperformance with incredible opportunities under the market capitalization-weighted surface. For the companies covered above, excluding the very recent Occidental and CNX reports, the outperformance has been extraordinary as can be seen in the following table.
Created by Brian Kapp, stoxdox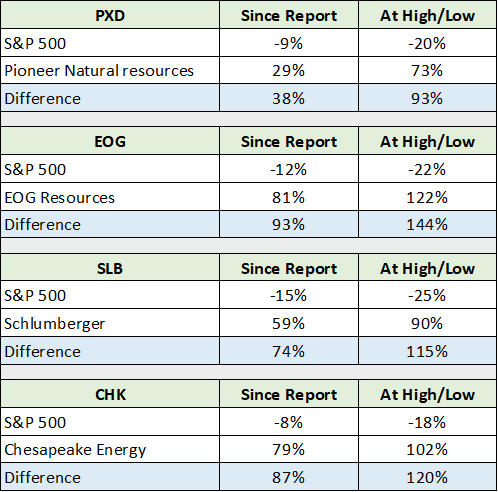
Be the first to comment