

jetcityimage/iStock Editorial via Getty Images
This article was co-produced with James Marino Sr. of Portfolio Insight.
This article series provides a summary of upcoming ex-dividend dates of stocks in Dividend Radar, a weekly automatically generated spreadsheet listing dividend growth stocks with dividend streaks of at least five years.
Created by the author
The ex-dividend date of stocks is usually set one business day before the record date, the cut-off date for determining which shareholders will receive the next dividend payment. If you buy a stock on its ex-dividend date or after, you will not receive the next dividend payment. Instead, the seller will receive the next dividend. If you buy the stock before the ex-dividend date, you will receive the dividend.
Upcoming Ex-Dividend Dates
The following table presents a summary of ex-dividend dates for the next two weeks. The table is divided into sections by Ex-Div Date and sorted by Ticker for each date. Yrs are years of consecutive dividend increases, Yield is the new dividend yield for the market close Price on the date listed, and 5-yr DGR is the compound annual growth rate of the dividend over a 5-year period (on a trailing 12-month basis). Note that Payout is the dollar amount payable per share or unit on the Pay Date.
| Company (Ticker) | Yrs | Price(25 Mar) | Yield | 5-YrDGR | Pay-out | PayDate |
| Ex-Div Date: 03/31 (Last Day to Buy: Wednesday, 03/30) | ||||||
| The Andersons, Inc. (ANDE) | 26 | $52.84 | 1.36% | 2.4% | 0.18 | 04/22 |
| Air Products and Chemicals, Inc. (APD) | 40 | $248.31 | 2.61% | 11.8% | 1.62 | 05/09 |
| Bank of South Carolina Corporation (BKSC) | 12 | $19.00 | 3.58% | 6.7% | 0.17 | 04/29 |
| Bristol-Myers Squibb Company (BMY) | 16 | $73.11 | 2.95% | 5.2% | 0.54 | 05/02 |
| Cardinal Health, Inc. (CAH) | 27 | $57.80 | 3.40% | 2.5% | 0.491 | 04/15 |
| CBTX, Inc. (CBTX) | 5 | $31.51 | 1.65% | 0.0% | 0.13 | 04/15 |
| CubeSmart (CUBE) | 13 | $51.56 | 3.34% | 10.0% | 0.43 | 04/18 |
| Farmers & Merchants Bancorp, Inc. (FMAO) | 13 | $36.76 | 2.07% | 9.3% | 0.19 | 04/20 |
| Fulton Financial Corporation (FULT) | 13 | $17.35 | 3.46% | 7.5% | 0.15 | 04/18 |
| Ingredion Incorporated (INGR) | 12 | $87.51 | 2.97% | 6.3% | 0.65 | 04/26 |
| Morningstar, Inc. (MORN) | 9 | $274.32 | 0.52% | 1.4% | 0.36 | 04/29 |
| Realty Income Corporation (O) | 28 | $68.72 | 4.31% | 3.4% | 0.247 | 04/15 |
| Royal Gold, Inc. (RGLD) | 20 | $139.74 | 1.00% | 10.3% | 0.35 | 04/14 |
| Republic Services, Inc. (RSG) | 19 | $133.06 | 1.38% | 7.4% | 0.46 | 04/14 |
| ServisFirst Bancshares, Inc. (SFBS) | 8 | $94.72 | 0.97% | 34.3% | 0.23 | 04/08 |
| State Street Corporation (STT) | 11 | $90.11 | 2.53% | 13.4% | 0.57 | 04/11 |
| Sysco Corporation (SYY) | 52 | $80.94 | 2.32% | 8.2% | 0.47 | 04/22 |
| Washington Trust Bancorp, Inc. (WASH) | 12 | $53.93 | 4.01% | 7.6% | 0.54 | 04/08 |
| Ex-Div Date: 04/01 (Last Day to Buy: Thursday, 03/31) | ||||||
| Globe Life Inc. (GL) | 16 | $102.03 | 0.81% | 12.0% | 0.208 | 04/29 |
| Healthcare Trust of America, Inc. (HTA) | 10 | $31.51 | 4.13% | 1.6% | 0.325 | 04/11 |
| Main Street Capital Corporation (MAIN) | 11 | $42.25 | 6.11% | 2.6% | 0.215 | 04/14 |
| Raymond James Financial, Inc. (RJF) | 10 | $111.32 | 1.22% | 13.7% | 0.34 | 04/18 |
| Shoe Carnival, Inc. (SCVL) | 9 | $30.77 | 1.17% | 13.6% | 0.09 | 04/18 |
| Ex-Div Date: 04/04 (Last Day to Buy: Friday, 04/01) | ||||||
| Agilent Technologies, Inc. (A) | 11 | $135.42 | 0.62% | 10.2% | 0.21 | 04/27 |
| Cousins Properties Incorporated (CUZ) | 5 | $40.26 | 3.18% | 31.1% | 0.32 | 04/14 |
| Dollar General Corporation (DG) | 8 | $226.30 | 0.97% | 10.1% | 0.55 | 04/19 |
| Erie Indemnity Company (ERIE) | 32 | $177.71 | 2.50% | 13.6% | 1.11 | 04/20 |
| John Wiley & Sons, Inc. (JWA) | 29 | $54.04 | 2.55% | 2.3% | 0.345 | 04/20 |
| John Wiley & Sons, Inc. (JWB) | 23 | $53.82 | 2.56% | 2.3% | 0.345 | 04/20 |
| Roper Technologies, Inc. (ROP) | 29 | $472.26 | 0.53% | 13.4% | 0.62 | 04/22 |
| Ex-Div Date: 04/05 (Last Day to Buy: Monday, 04/04) | ||||||
| Comcast Corporation (CMCSA) | 14 | $47.53 | 2.27% | 7.8% | 0.27 | 04/27 |
| Cisco Systems, Inc. (CSCO) | 12 | $55.14 | 2.76% | 8.2% | 0.38 | 04/27 |
| Quest Diagnostics Incorporated (DGX) | 12 | $144.90 | 1.82% | 8.9% | 0.66 | 04/20 |
| JPMorgan Chase & Co. (JPM) | 12 | $140.87 | 2.84% | 15.0% | 1 | 04/30 |
| Marsh & McLennan Companies, Inc. (MMC) | 13 | $169.22 | 1.26% | 9.0% | 0.535 | 05/13 |
| Parke Bancorp, Inc. (PKBK) | 7 | $24.09 | 2.66% | 23.5% | 0.16 | 04/20 |
| Thor Industries, Inc. (THO) | 14 | $81.70 | 2.11% | 5.9% | 0.43 | 04/20 |
| The Toro Company (TTC) | 19 | $86.25 | 1.39% | 11.7% | 0.3 | 04/21 |
| Ex-Div Date: 04/06 (Last Day to Buy: Tuesday, 04/05) | ||||||
| ABM Industries Incorporated (ABM) | 55 | $44.49 | 1.75% | 2.9% | 0.195 | 05/02 |
| Simpson Manufacturing Co., Inc. (SSD) | 9 | $112.93 | 0.89% | 7.2% | 0.25 | 04/28 |
| Ex-Div Date: 04/07 (Last Day to Buy: Wednesday, 04/06) | ||||||
| Brady Corporation (BRC) | 37 | $46.82 | 1.92% | 1.7% | 0.225 | 04/29 |
| General Dynamics Corporation (GD) | 31 | $240.89 | 2.09% | 9.5% | 1.26 | 05/06 |
| Gentex Corporation (GNTX) | 11 | $28.96 | 1.66% | 6.5% | 0.12 | 04/20 |
| Horizon Bancorp, Inc. (HBNC) | 12 | $19.80 | 3.03% | 14.7% | 0.15 | 04/22 |
| Mastercard Incorporated (MA) | 11 | $350.49 | 0.56% | 18.3% | 0.49 | 05/09 |
| NetApp, Inc. (NTAP) | 9 | $86.14 | 2.32% | 21.5% | 0.5 | 04/27 |
| Oracle Corporation (ORCL) | 13 | $83.60 | 1.53% | 14.9% | 0.32 | 04/21 |
| The Toronto-Dominion Bank (TD) | 7 | $81.47 | 3.46% | 9.1% | 0.89 | 04/30 |
| Verizon Communications Inc. (VZ) | 18 | $51.17 | 5.00% | 2.1% | 0.64 | 05/02 |
| Ex-Div Date: 04/08 (Last Day to Buy: Thursday, 04/07) | ||||||
| Culp, Inc. (CULP) | 10 | $8.16 | 5.64% | 8.7% | 0.115 | 04/19 |
| Intuit Inc. (INTU) | 10 | $480.50 | 0.57% | 20.4% | 0.68 | 04/18 |
| Lincoln National Corporation (LNC) | 13 | $67.29 | 2.67% | 10.9% | 0.45 | 05/02 |
| OGE Energy Corp. (OGE) | 17 | $39.84 | 4.12% | 7.5% | 0.41 | 04/29 |
| UDR, Inc. (UDR) | 13 | $57.69 | 2.63% | 4.5% | 0.38 | 05/02 |
| Universal Corporation (UVV) | 51 | $57.11 | 5.46% | 7.9% | 0.78 | 05/02 |
| Ex-Div Date: 04/12 (Last Day to Buy: Monday, 04/11) | ||||||
| American Tower Corporation (REIT) (AMT) | 12 | $245.03 | 2.29% | 19.2% | 1.4 | 04/29 |
| Kadant Inc. (KAI) | 10 | $195.14 | 0.53% | 6.0% | 0.26 | 05/11 |
| Winnebago Industries, Inc. (WGO) | 5 | $52.79 | 1.36% | 6.2% | 0.18 | 04/27 |
| Ex-Div Date: 04/13 (Last Day to Buy: Tuesday, 04/12) | ||||||
| AbbVie Inc. (ABBV) | 10 | $161.97 | 3.48% | 17.9% | 1.41 | 05/16 |
| Abbott Laboratories (ABT) | 9 | $119.99 | 1.57% | 11.6% | 0.47 | 05/16 |
| Accenture plc (ACN) | 11 | $330.74 | 1.17% | 9.4% | 0.97 | 05/13 |
| Activision Blizzard, Inc. (ATVI) | 13 | $80.01 | 0.59% | 12.6% | 0.47 | 05/06 |
| EOG Resources, Inc. (EOG) | 5 | $120.86 | 2.48% | 19.2% | 0.75 | 04/29 |
| Johnson Outdoors Inc. (JOUT) | 9 | $80.06 | 1.50% | 23.0% | 0.3 | 04/28 |
| Quaker Chemical Corporation (KWR) | 15 | $186.66 | 0.89% | 3.8% | 0.415 | 04/29 |
| Mid-America Apartment Communities, Inc. (MAA) | 13 | $209.69 | 2.07% | 4.6% | 1.088 | 04/29 |
| McGrath RentCorp (MGRC) | 30 | $84.98 | 2.14% | 11.2% | 0.455 | 04/29 |
| Norwood Financial Corp. (NWFL) | 22 | $28.65 | 3.91% | 4.7% | 0.28 | 05/02 |
| RGC Resources, Inc. (RGCO) | 22 | $21.12 | 3.69% | 6.5% | 0.195 | 05/01 |
| Trinity Industries, Inc. (TRN) | 12 | $34.82 | 2.64% | 13.8% | 0.23 | 04/29 |
| WD-40 Company (WDFC) | 13 | $185.22 | 1.68% | 11.0% | 0.78 | 04/29 |
Previous Post:Upcoming Ex-Dividend Dates: March 16-31, 2022
High-Quality Candidates
We use DVK Quality Snapshots to assess the quality of dividend growth stocks. This elegant and effective system employs five quality indicators and assigns 0-5 points to each quality indicator, for a maximum quality score of 25 points.
By assigning quality scores to all Dividend Radar stocks with upcoming ex-dates, we could screen for the highest-quality candidates. This week, thirteen stocks have quality scores of 22 or higher.
We present the quality scores, an assessment of fair value (whether Above, At, or Below fair value), and two measures of each stock’s recent performance (1-year and 3-year trailing total returns [TTR]). Key metrics from the previous table are repeated here for convenience:
Created by the author from data in Dividend Radar and using DVK Quality Snapshots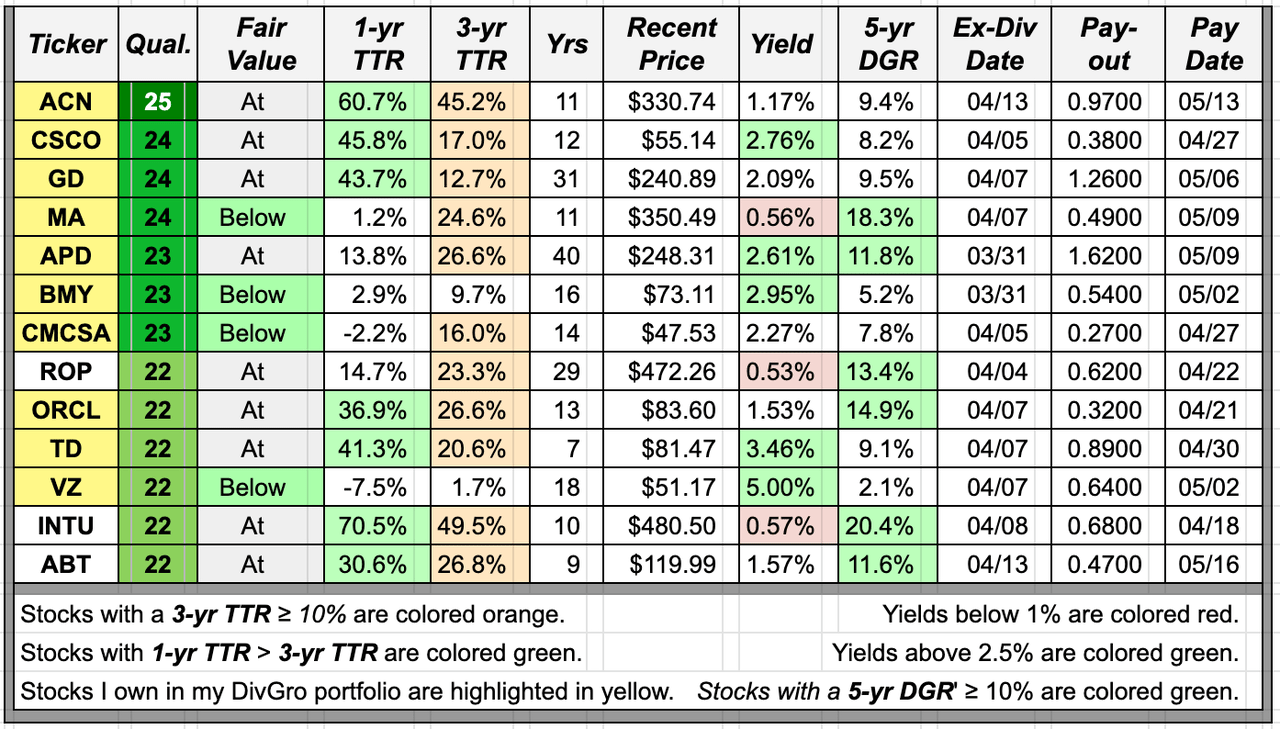
Dividend Radar presents fair value as a range. Four stocks in this week’s shortlist are trading at discounted valuations below the fair value range (BMY, CMCSA, MA, and VZ ), while the remaining stocks are fairly valued as they are trading within the fair value range.
TTR adds the returns due to stock price appreciation (or depreciation) and dividend payments over each time frame. Dividend Radar provides 1-year and 3-year TTRs. In the summary table, we highlight 3-year TTRs of 10% or higher in orange, and each 1-year TRRs that exceeds the 3-year TTR, in green (indicating stronger recent performance).
All but two of this week’s candidates have 3-year TTRs above 10% (the exceptions are BMY and VZ), while seven candidates have 1-year TTRs that exceed their 3-year TTRs (ABT, ACN, CSCO, GD, INTU, ORCL, and TD).
We also color-code the Yield and 5-yr DGR columns, preferring dividend yields above 2.5% and 5-year dividend growth rates of 10% or higher.
Five candidates yield more than 2.5% (APD, BMY, CSCO, TD, and VZ), while six candidates have 5-year dividend growth rates above 10% (ABT, APD, INTU, MA, ORCL, and ROP).
An Interesting Candidate
Ideally, we’d like to see green cells in each of the Fair Value, 1-yr TTR, Yield, and 5-yr DGR columns. That rarely happens, though, so we look for a candidate that offers the best metrics overall, at least based on our current investment objectives.
We haven’t focused on Dividend Contender ORCL yet, so let’s consider it this week.
SWITCH develops, manufactures, markets, sells, hosts, and supplies IT-related application, platform, and infrastructure services to businesses, government agencies, educational institutions, and resellers worldwide. The company also licenses its Oracle Database for storage, retrieval, and manipulation of data. ORCL was founded in 1977 and is headquartered in Austin, Texas.
ORCL is rated Fine (quality score 19-22):
Created by the author from a personal spreadsheet based on DVK Quality Snapshots.
The stock yields 1.53% at $83.60 per share and has an impressive 5-year DGR of 14.9%.
Over the past 10 years, ORCL underperformed the SPDR S&P 500 ETF (SPY), an ETF designed to track the 500 companies in the S&P 500 index:
Portfolio-Insight.com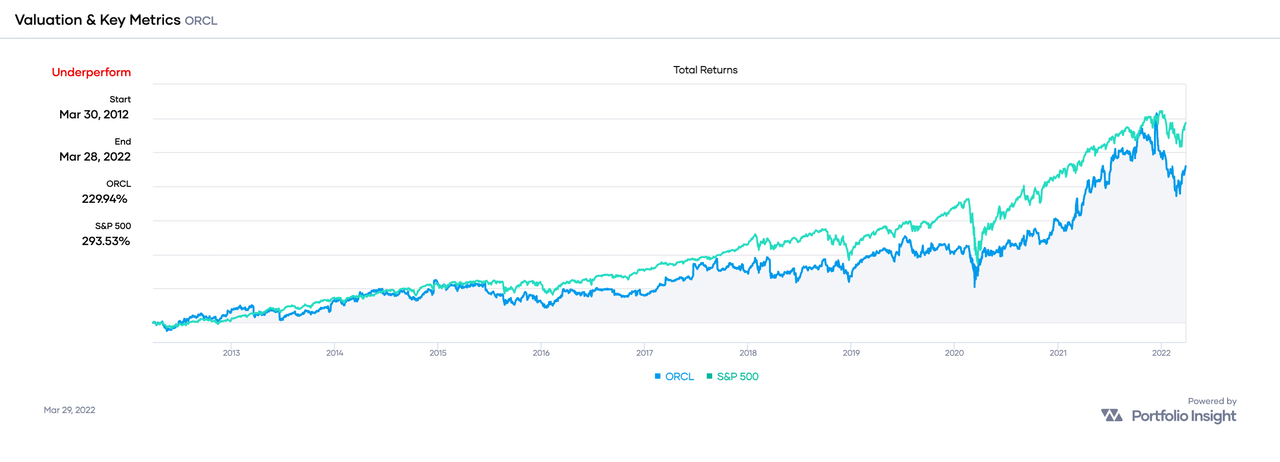
ORCL delivered total returns of 230% versus SPY’s 294%, a margin of 0.78-to-1.
However, if we extend the time frame of comparison to the past 20 years, ORCL outperformed SPY, returning 674% versus SPY’s 484%. That’s a margin of 1.39-to-1.
Here is a chart showing ORCL’s dividend growth history through the end of 2021:
Portfolio-Insight.com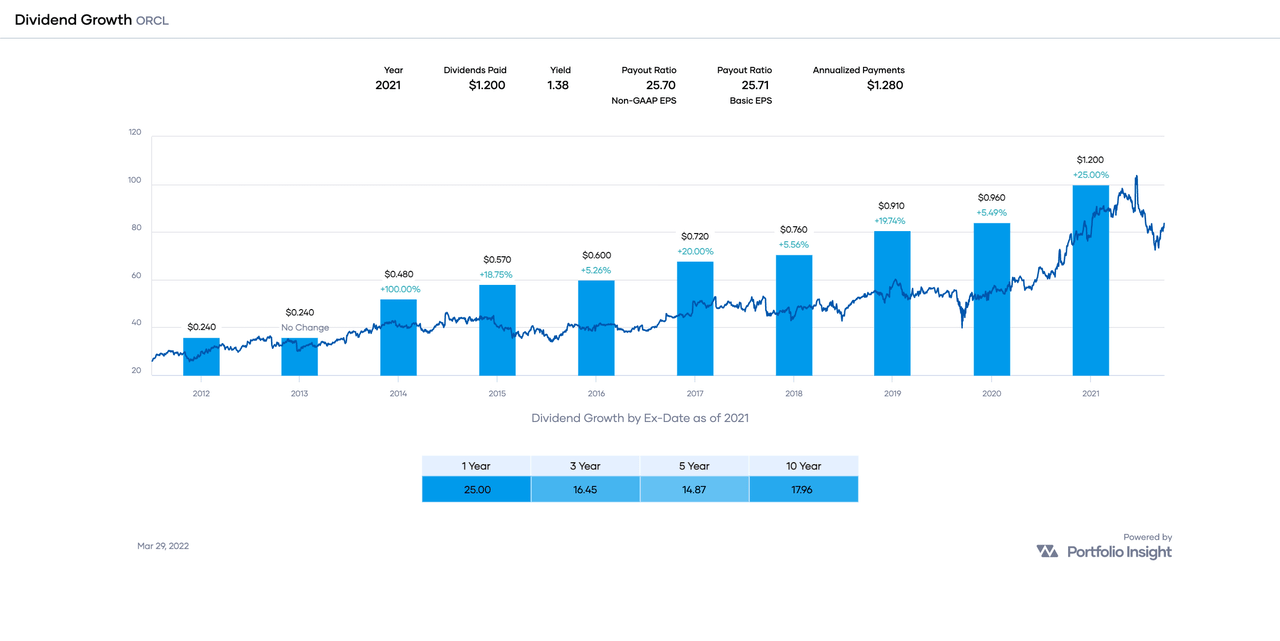
ORCL’s dividend growth is impressive and its dividend growth rate [DGR] is accelerating, particularly in recent years. We can characterize this acceleration by dividing the 3-year dividend growth rate by the 5-year counterpart, 16.45 ÷ 14.87 = 1.11. A ratio above 1.00 indicates an acceleration of the DGR.
The company’s EPS history likewise is impressive, except for some poor years in FY 2015 and FY 2016. Strong continued growth is expected through FY 2024:
Portfolio-Insight.com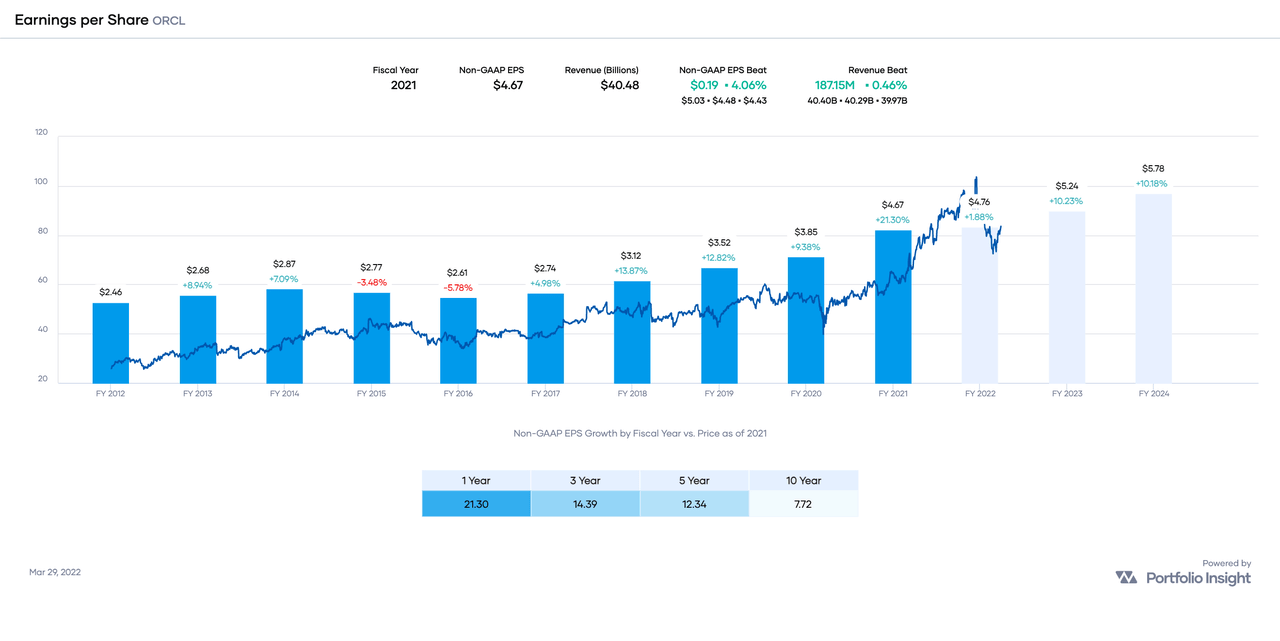
ORCL’s payout ratio of 26% is “very low for most companies”, according to Simply Safe Dividends:
Simply Safe Dividends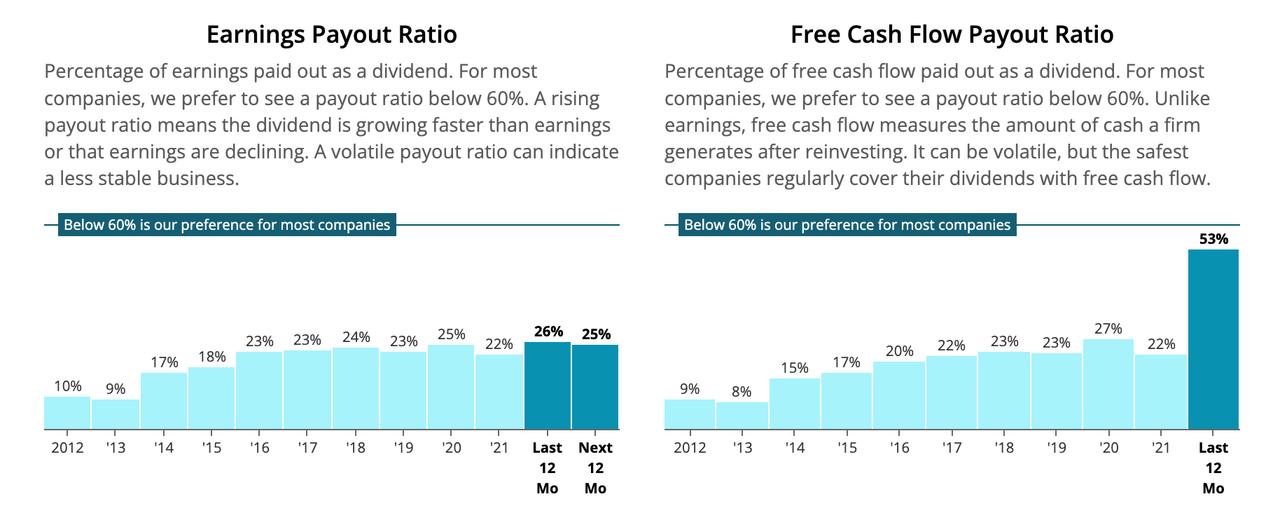
The company has plenty of room to continue with generous dividend increases for the foreseeable future! Moreover, Simply Safe Dividends considers ORCL’s dividend Very Safe with a Dividend Safety Score of 99.
Let’s now consider ORCL’s valuation.
Portfolio-Insight.com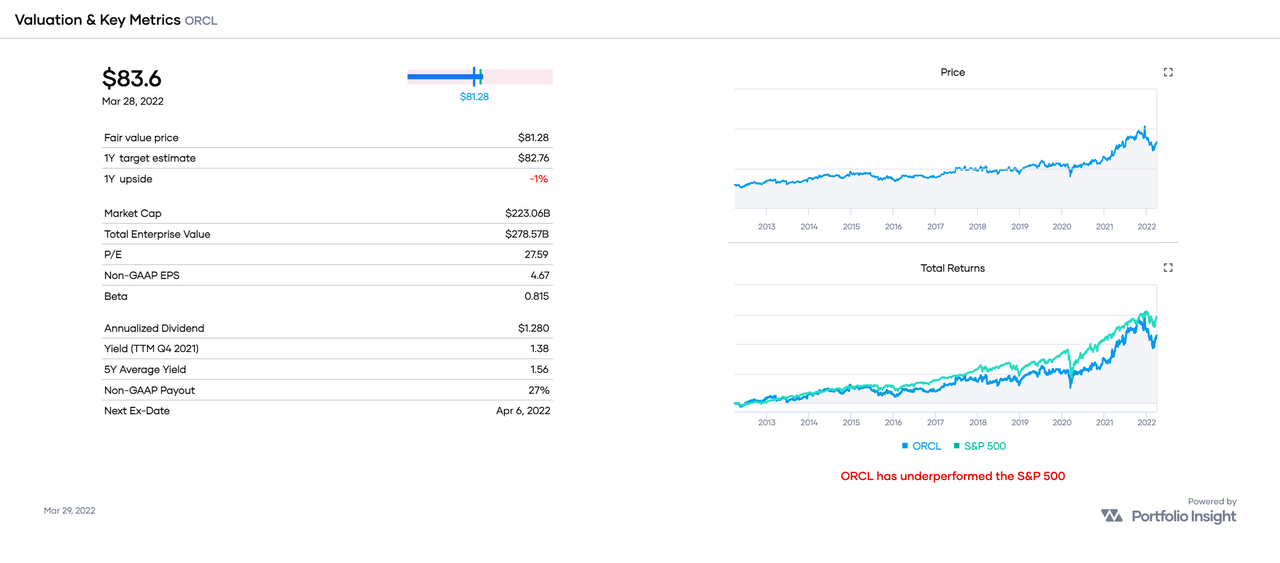
A quick way to estimate fair value is to divide the annualized dividend ($1.28) by the stock’s 5-year average yield (1.56%). That results in a fair value [FV] estimate of $82 based on ORCL’s dividend yield history.
For reference, CFRA’s FV is $55, Morningstar’s FV is $63, Portfolio Insight’s FV is $81, Finbox.com‘s FV is $101, Simply Wall St’s FV is $125.
My own FV estimate of ORCL is $83.
The average of all these estimates is $84. Given the stock’s current share price of $83.60, it would appear that ORCL is trading at about fair value.
Here are the most recent Seeking Alpha articles covering ORCL:
Conclusion: ORCL is a high-quality dividend growth stock trading just about in line with my fair value estimate of $83. For stocks rated Fine, I require a discounted valuation relative to my fair value estimate, so my Buy Below price is $83 per share. For conservative investors, a buy below $75 would be more appropriate.
Please note that we’re not recommending ORCL or any of the stocks listed in this article. Readers should do their own research on these companies before buying shares.
Be the first to comment