

Dan Kitwood
This article was co-produced with James Marino Sr. of Portfolio Insight.
Created by the author
This article series compiles a list of upcoming ex-dividend dates of stocks in Dividend Radar, a spreadsheet containing stocks with dividend increase streaks of five years or more.
To earn the next dividend, be sure to buy a stock before its ex-dividend date, which usually is one business day before the record date. Unfortunately, if you wait until the ex-dividend date or thereafter, you won’t receive the next dividend payment! Instead, the seller will receive the next dividend.
Upcoming Ex-Dividend Dates
The following table presents a summary of ex-dividend dates for the next two weeks. The table is divided into sections by Ex-Div Date and sorted by Ticker for each date. Yrs are years of consecutive dividend increases, Yield is the new dividend yield for the market close Price on the date listed, and 5-yr DGR is the compound annual growth rate of the dividend over a 5-year period (on a trailing 12-month basis). Note that Payout is the dollar amount payable per share or unit on the Pay Date.
| Company (Ticker) | Yrs | Price | Fwd | 5-Yr | Next | Pay |
| (07/14) | Yield | DGR | Payout | Date | ||
| Ex-Div Date: 07/15 (Last Day to Buy: Thursday, 07/14) | ||||||
| Alamo (ALG) | 8 | $112.25 | 0.64% | 11.0% | 0.18 | 08/01 |
| Graco (GGG) | 25 | $60.13 | 1.40% | 16.9% | 0.21 | 08/03 |
| Owens Corning (OC) | 9 | $79.11 | 1.77% | 9.9% | 0.35 | 08/04 |
| Ex-Div Date: 07/18 (Last Day to Buy: Friday, 07/15) | ||||||
| Graham (GHC) | 6 | $554.88 | 1.14% | 4.5% | 1.58 | 08/05 |
| Ex-Div Date: 07/19 (Last Day to Buy: Monday, 07/18) | ||||||
| Caterpillar (CAT) | 29 | $168.03 | 2.86% | 7.6% | 1.2 | 08/19 |
| Lowe’s (LOW) | 60 | $179.06 | 2.35% | 18.0% | 1.05 | 08/03 |
| West Pharmaceutical Services (WST) | 29 | $292.49 | 0.25% | 6.9% | 0.18 | 08/03 |
| Ex-Div Date: 07/20 (Last Day to Buy: Tuesday, 07/19) | ||||||
| Colgate-Palmolive (CL) | 59 | $77.73 | 2.42% | 3.0% | 0.47 | 08/15 |
| Zoetis (ZTS) | 10 | $166.75 | 0.78% | 22.9% | 0.325 | 09/01 |
| Ex-Div Date: 07/21 (Last Day to Buy: Wednesday, 07/20) | ||||||
| First Busey (BUSE) | 8 | $22.83 | 4.03% | 5.6% | 0.23 | 07/29 |
| Gladstone Investment (GAIN) | 11 | $14.12 | 6.37% | 3.3% | 0.075 | 07/29 |
| Gladstone Land (LAND) | 9 | $22.75 | 2.39% | 1.2% | 0.046 | 07/29 |
| Procter & Gamble (PG) | 66 | $144.21 | 2.53% | 5.5% | 0.914 | 08/15 |
| Williams-Sonoma (WSM) | 16 | $126.37 | 2.47% | 13.2% | 0.78 | 08/26 |
| Ex-Div Date: 07/22 (Last Day to Buy: Thursday, 07/21) | ||||||
| Lakeland Financial (LKFN) | 8 | $64.91 | 2.46% | 18.3% | 0.4 | 08/05 |
| Ex-Div Date: 07/26 (Last Day to Buy: Monday, 07/25) | ||||||
| Clorox (CLX) | 45 | $147.19 | 3.15% | 7.7% | 1.18 | 08/12 |
| Fastenal (FAST) | 23 | $50.42 | 2.46% | 13.7% | 0.31 | 08/24 |
| Ex-Div Date: 07/27 (Last Day to Buy: Tuesday, 07/26) | ||||||
| Greenbrier (GBX) | 8 | $33.48 | 3.23% | 4.9% | 0.27 | 08/18 |
| Ex-Div Date: 07/28 (Last Day to Buy: Wednesday, 07/27) | ||||||
| Agree Realty (ADC) | 10 | $72.73 | 3.86% | 6.6% | 0.234 | 08/12 |
| A. O. Smith (AOS) | 29 | $52.98 | 2.11% | 16.2% | 0.28 | 08/15 |
| Enterprise Products Partners (EPD) | 25 | $23.82 | 7.81% | 7.1% | 0.475 | 08/12 |
| NiSource (NI) | 6 | $28.37 | 3.31% | 6.0% | 0.235 | 08/19 |
| Pfizer (PFE) | 12 | $51.08 | 3.13% | 5.0% | 0.4 | 09/06 |
| STAG Industrial (STAG) | 10 | $29.59 | 4.93% | 0.9% | 0.122 | 08/15 |
| Virtus Investment Partners (VRTS) | 5 | $169.04 | 3.55% | 24.2% | 1.5 | 08/15 |
Previous Post: Upcoming Ex-Dividend Dates: July 1-14, 2022
High-Quality Candidates
We use DVK Quality Snapshots to assess the quality of dividend growth stocks. DVK Quality Snapshots is an elegant and effective system that employs five quality indicators and assigns 0-5 points to each quality indicator for a maximum quality score of 25 points.
To find high-quality candidates from Dividend Radars stocks with upcoming ex-dividend dates, we screened for the stocks with quality scores of 22 or higher. There are five such candidates this week.
Below we present the quality scores, an assessment of fair value (whether Above, At, or Below fair value), and two measures of each stock’s recent performance (1-year and 3-year trailing total returns [TTR]). Key metrics from the previous table are repeated here for convenience.
Created by the author from data in Dividend Radar and using DVK Quality Snapshots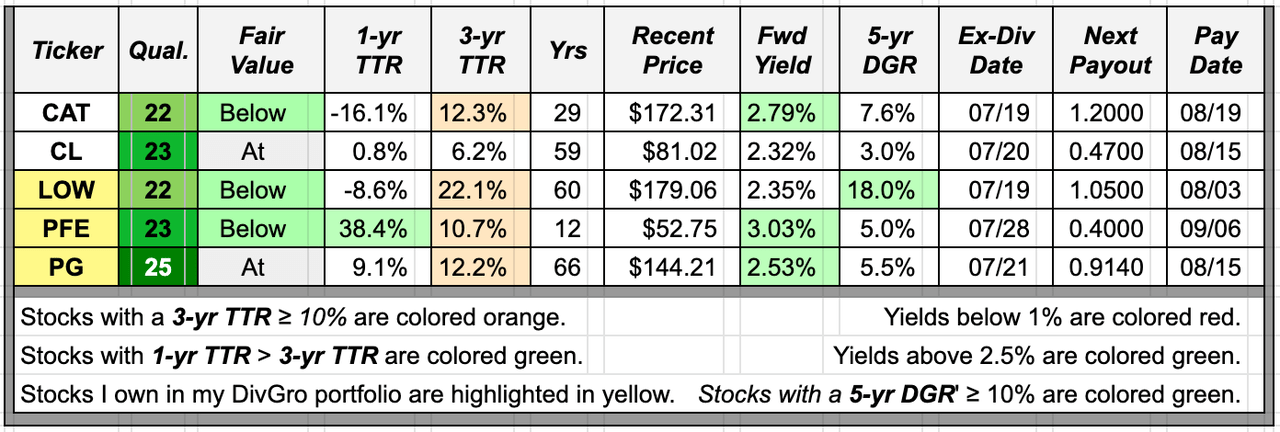
Dividend Radar views fair value as a range. Two stocks are fairly valued as they are trading within the fair value range, and three stocks have discounted valuations below the fair value range. These are indicated with green cells in the Fair Value column.
TTR adds the returns due to stock price appreciation (or depreciation) and dividend payments over each time frame. Dividend Radar provides 1-year and 3-year TTRs. The summary table highlights 3-year TTRs of 10% or higher in orange and any 1-year TRR that exceeds the 3-year TTR in green (indicating stronger recent performance).
Four of this week’s candidates have 3-year TTRs above 10% but only one candidate (PFE) has a 1-year TTR that exceeds the 3-year TTR.
We also color-code the Yield and 5-yr DGR columns, preferring dividend yields above 2.5% and 5-year dividend growth rates of 10% or higher.
One candidate has 5-year dividend growth rates above 10% (LOW) and three have yields above 2.5%. Only CAT, PFE, and PG top both.
An Interesting Candidate
Ideally, we’d like to see green cells in each of the Fair Value, 1-yr TTR, Yield, and 5-yr DGR columns. That rarely happens, though, so we look for a candidate that offers the best metrics overall, at least based on our current investment objectives.
Let’s highlight Dividend Contender PFE this week.
Headquartered in New York and founded in 1849, PFE is one of the world’s largest pharmaceutical firms. The company discovers, develops, and manufactures healthcare products. PFE offers medicines and vaccines in various therapeutic areas, serving wholesalers, retailers, hospitals, clinics, government agencies, pharmacies, and individual provider offices, as well as disease control and prevention centers.
PFE is rated Excellent (quality score 23-24):
Created by the author from a personal spreadsheet based on DVK Quality Snapshots
The stock yields 3.03% at $52.75 per share and has a 5-year dividend growth rate [DGR] of 5.0%.
Over the past 10 years, PFE has underperformed the SPDR S&P 500 ETF (SPY), an ETF designed to track the 500 companies in the S&P 500 index:
Portfolio-Insight.com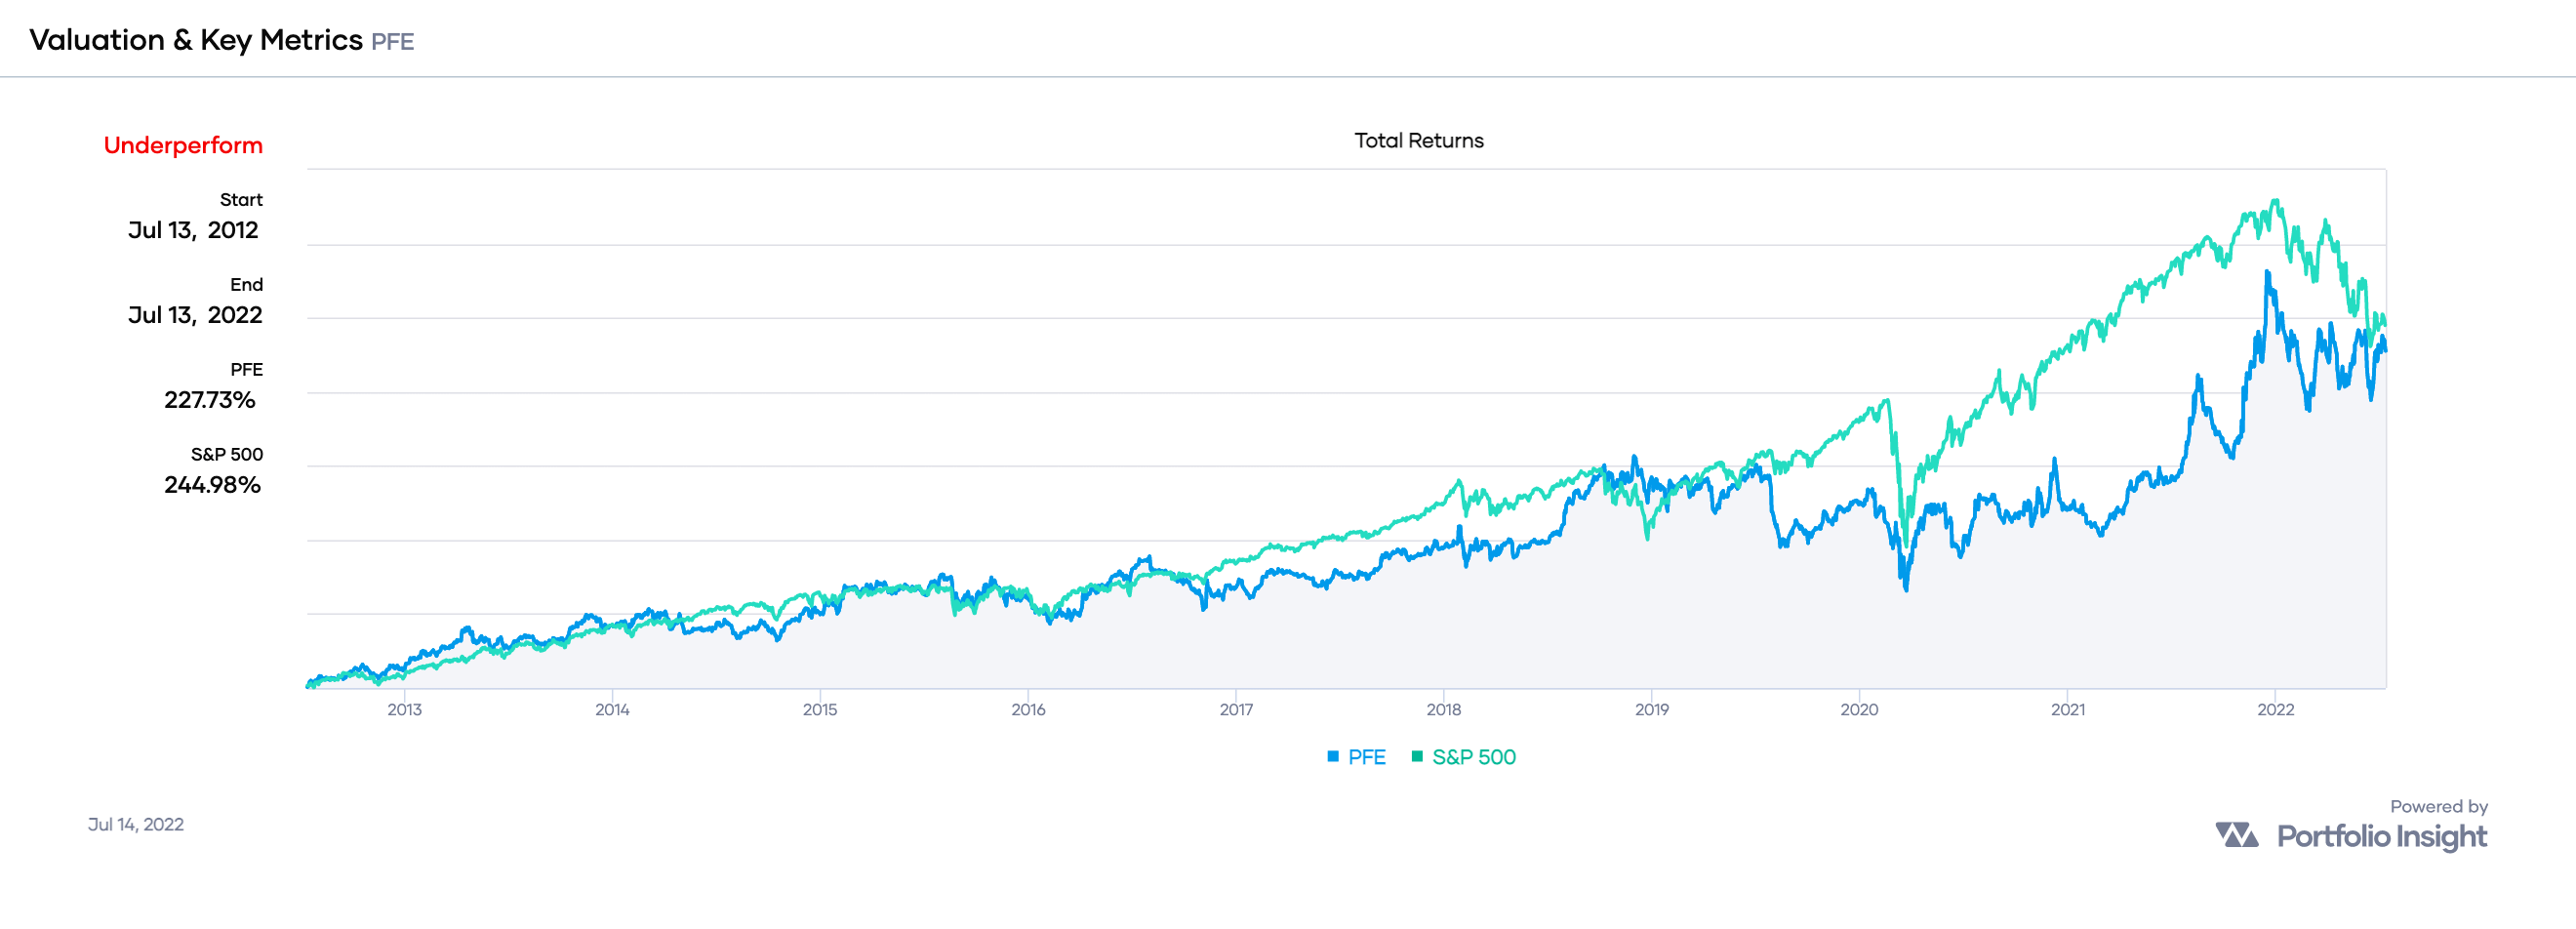
PFE delivered total returns of 228% versus SPY’s 245%, a margin of 0.93-to-1.
If we extend the time frame of comparison to the past 20 years, PFE also underperformed SPY, with total returns of 237% versus SPY’s 509% (a margin of 0.47-to-1).
Here is a chart showing PFE’s dividend growth history through the end of 2021:
Portfolio Insight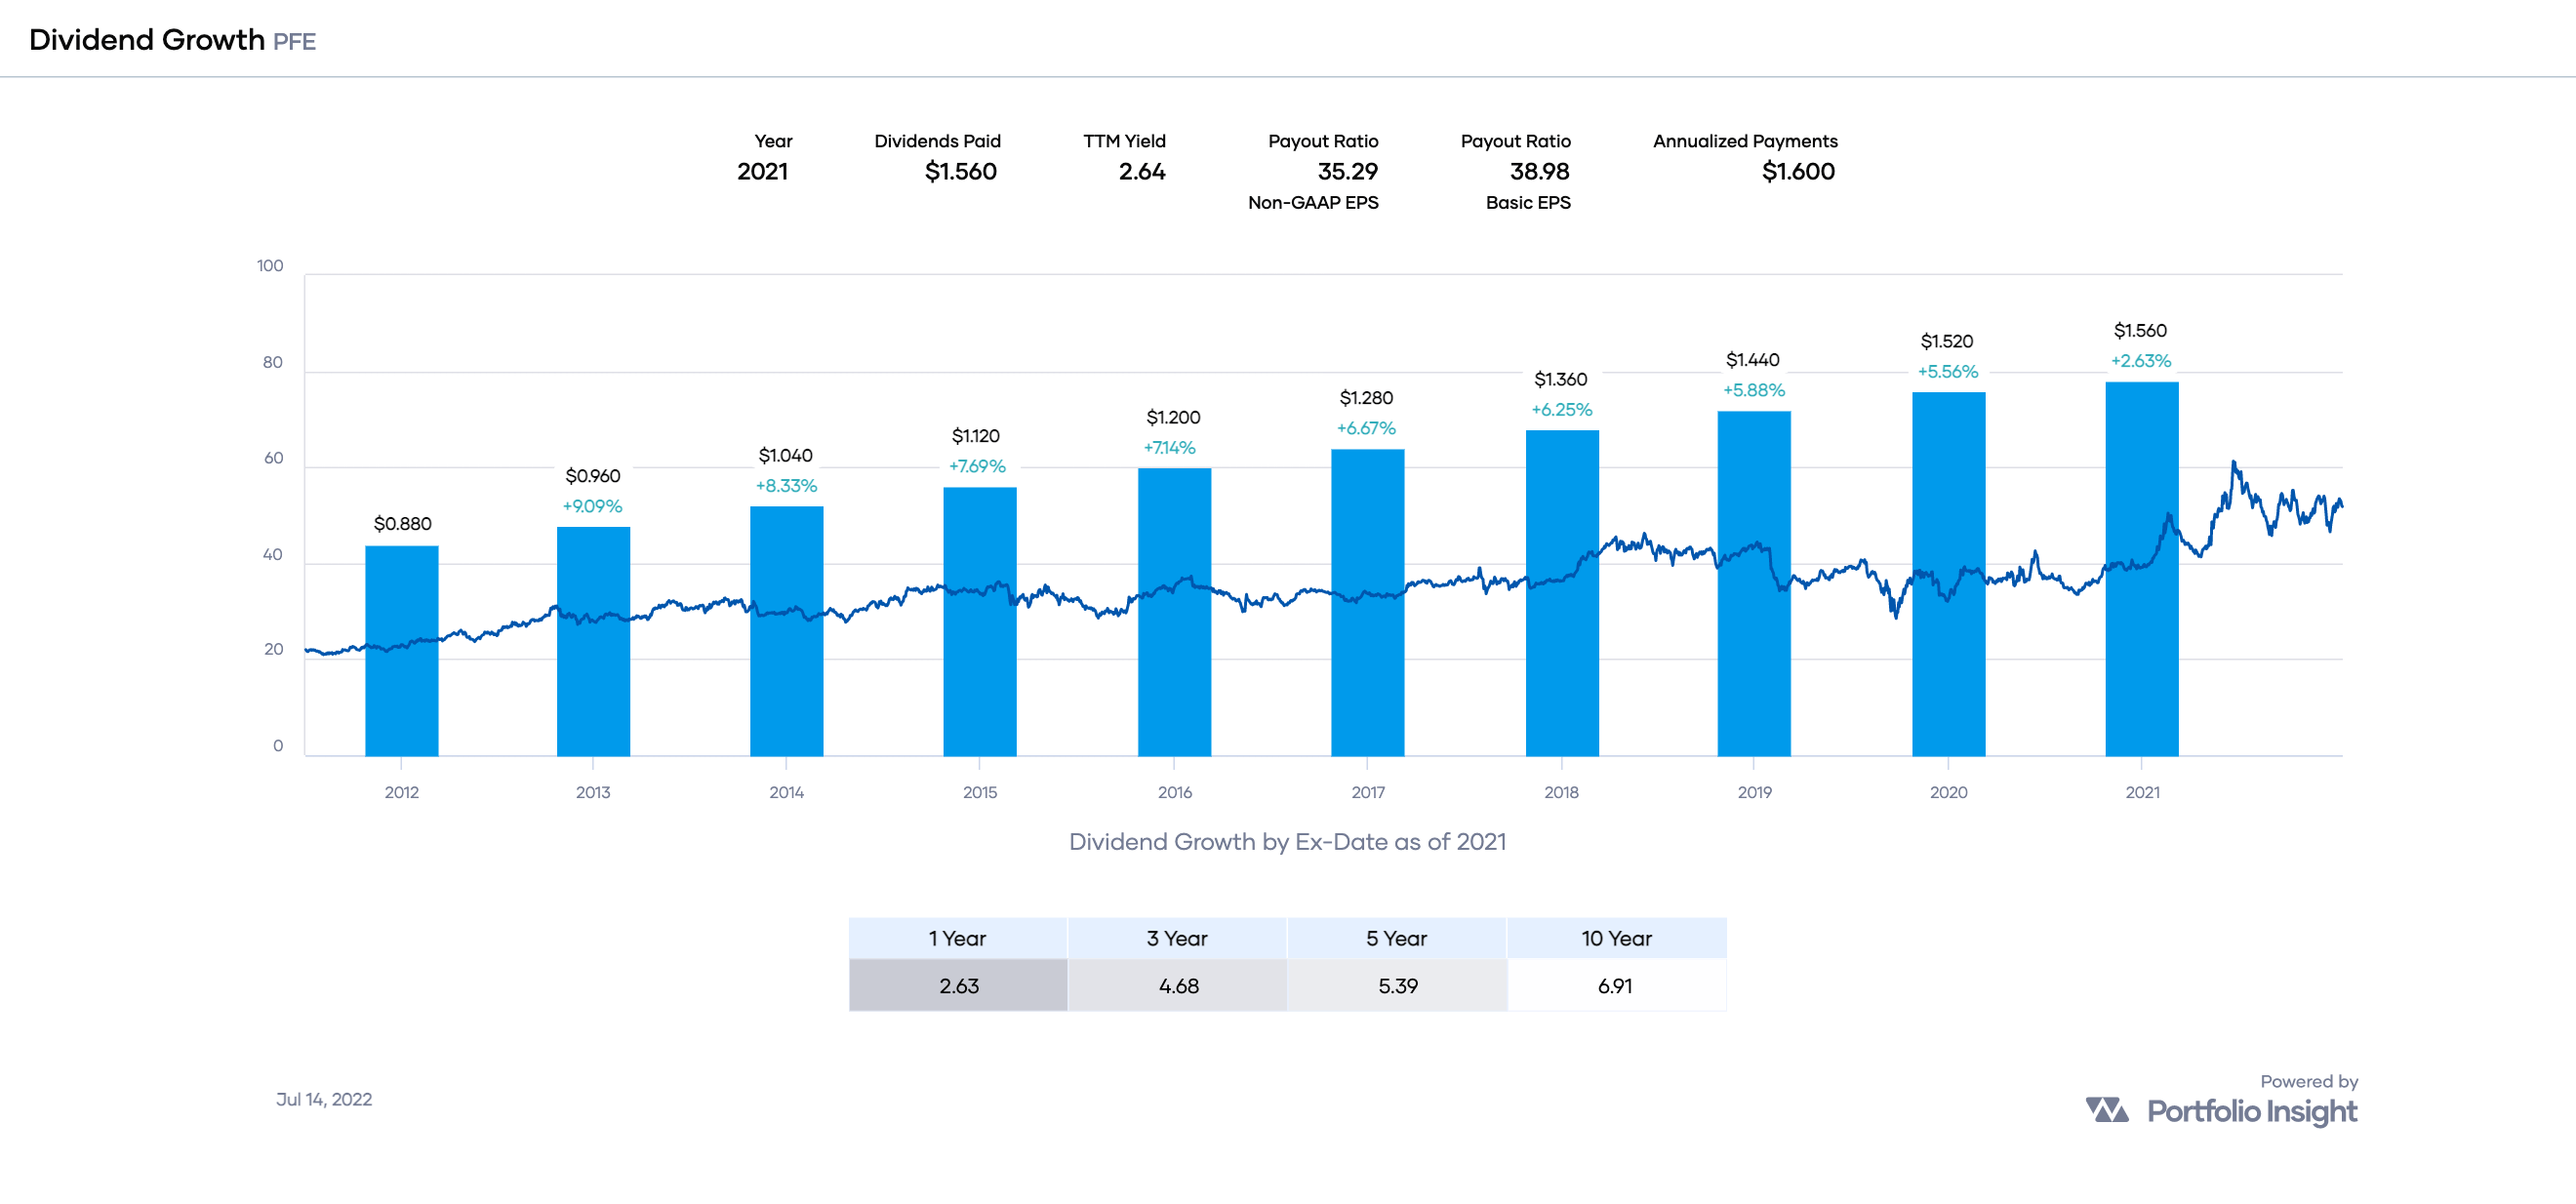
PFE has grown its dividend consistently but at a low and somewhat decelerating rate. We can see this by dividing the 5-year DGR by the 10-year counterpart: 5.39 ÷ 6.91 = 0.78. A ratio below 1.00 indicates a deceleration of the DGR.
Likewise, PFE has generally grown its dividend over the past decade and the earnings growth rate is somewhat higher than the dividend growth:
Portfolio Insight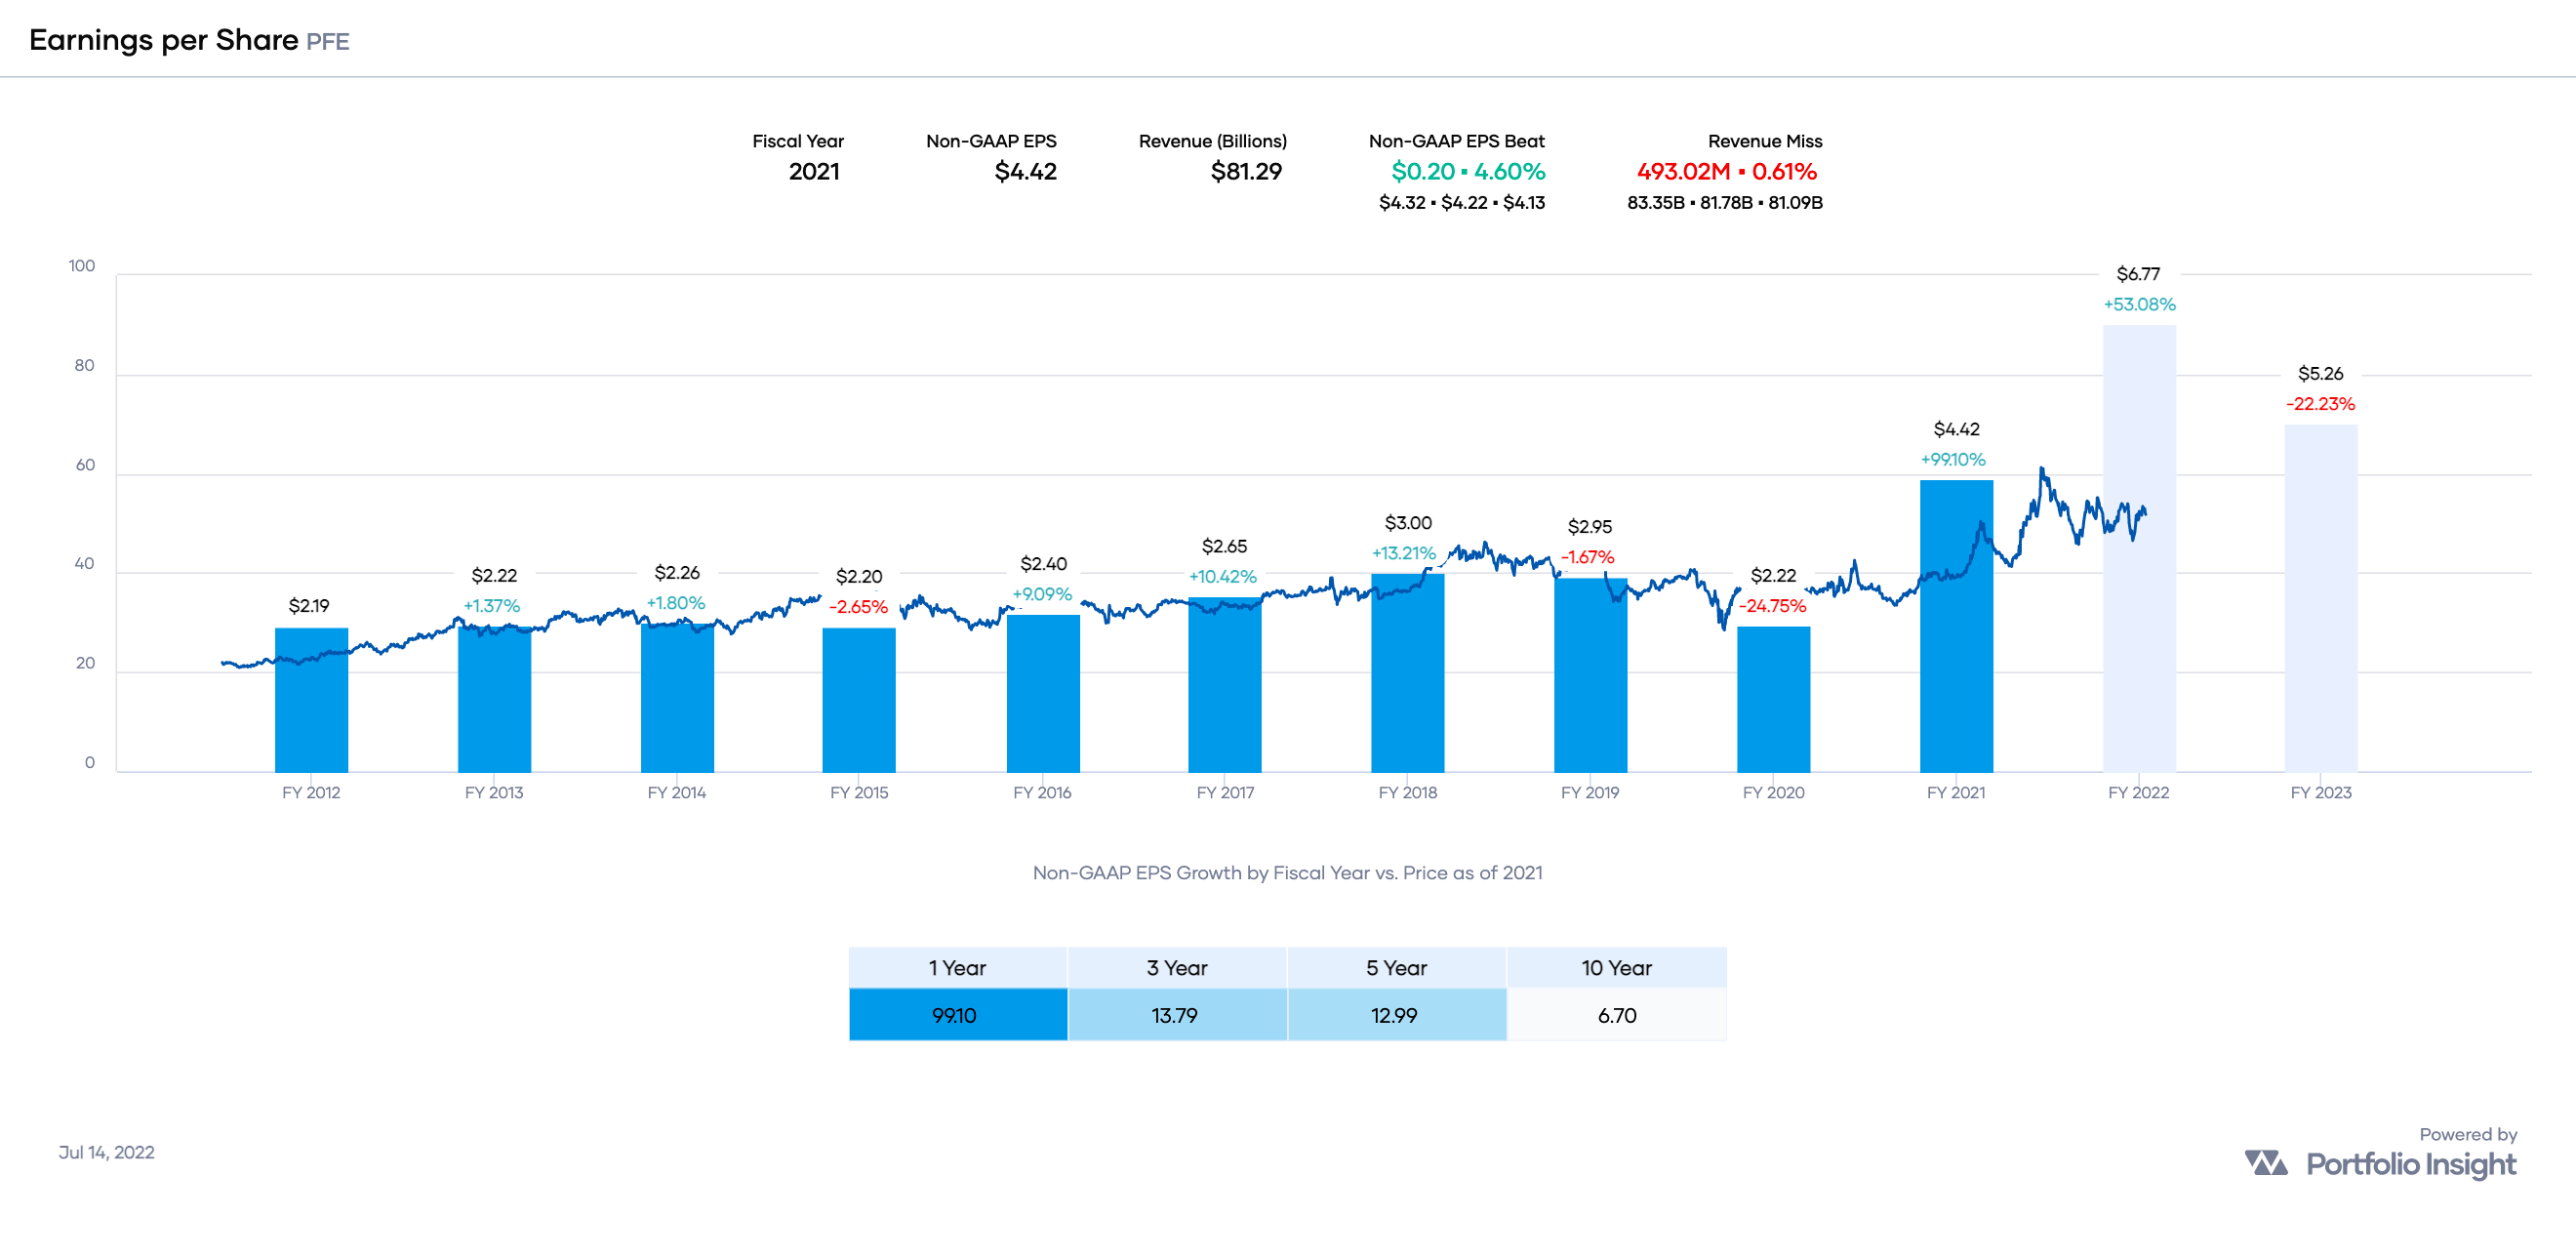
If realized, PFE’s EPS estimates for FY 2022 and FY 2023 would continue the upward trend (even though FY 2023 is projected to be lower than FY 2022).
PFE’s payout ratio of 31% is “low for most companies,” according to Simply Safe Dividends:
Simply Safe Dividends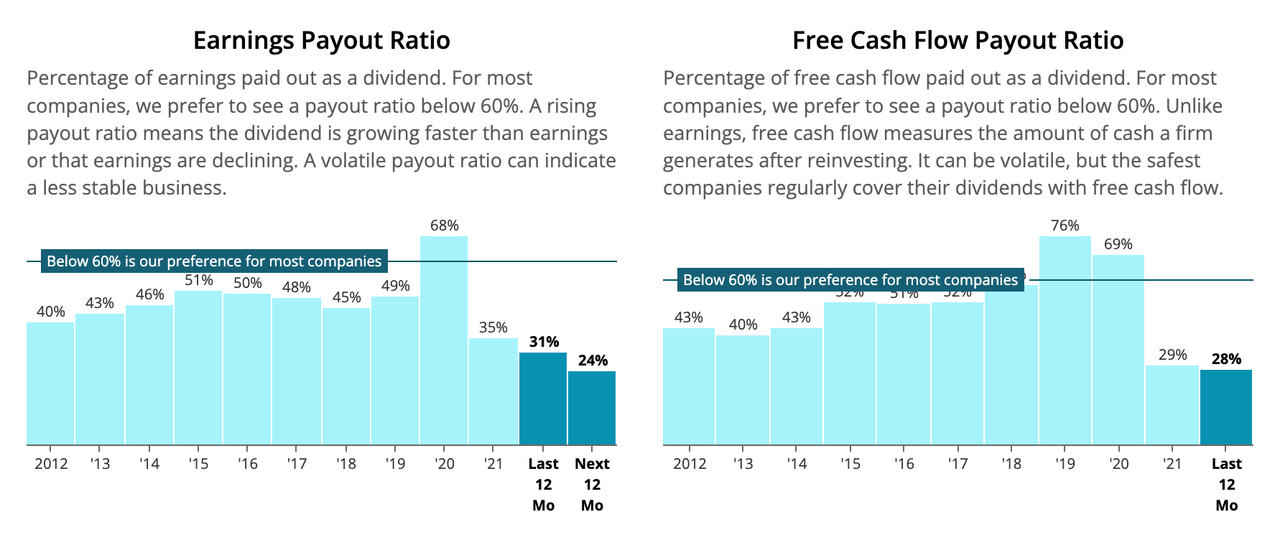
PFE has plenty of room to continue paying and increasing its dividend! Moreover, Simply Safe Dividends considers PFE’s dividend Safe with a Dividend Safety Score of 75.
Let’s now consider PFE’s valuation.
Portfolio Insight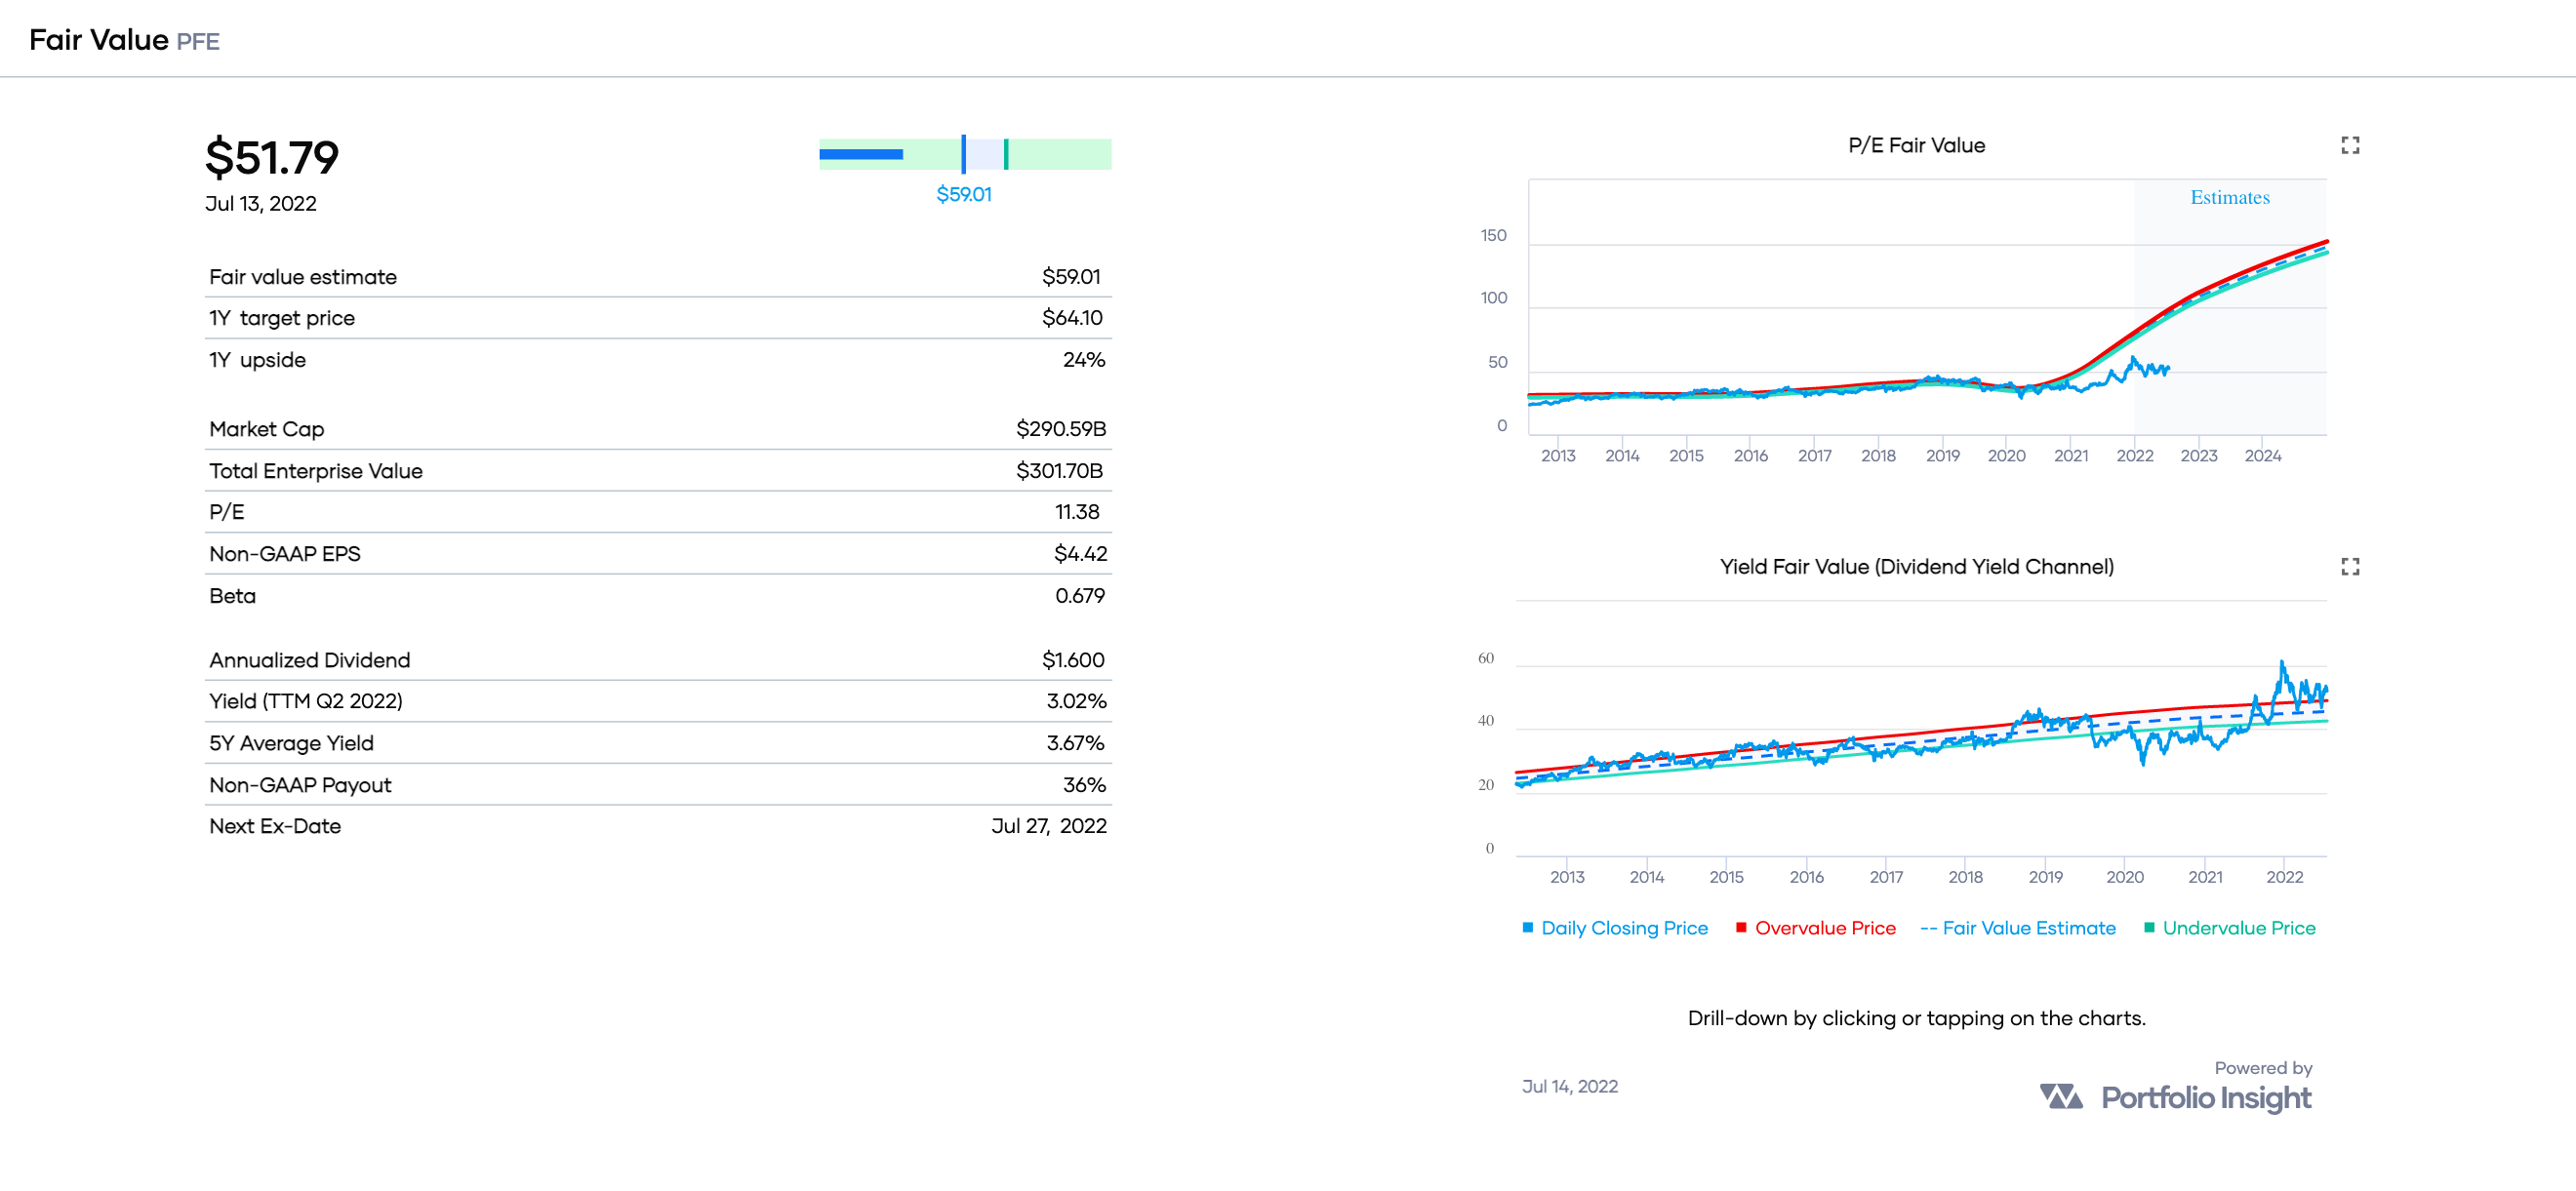
A quick way to estimate fair value is to divide the annualized dividend ($1.60 by the stock’s 5-year average yield (3.67%). That results in a fair value [FV] estimate of $44 based on PFE’s dividend yield history.
For reference, CFRA’s FV is $27, Morningstar’s FV is $48, Portfolio Insight’s FV is $59, Finbox.com’s FV is $70, and Simply Wall St’s FV is $106. That’s quite a range of opinions!
My own FV estimate of PFE is $53.
The average of all these estimates is $58. Given the stock’s current share price of $52.75 per share, it appears that PFE is trading at a discounted valuation of about 9%.
Here are the most recent Seeking Alpha articles covering PFE:
- Buy: Pfizer: New Potential Billion-Dollar Drugs Under Development, by Davide Ravera
- Buy: Eli Lilly’s Market Cap Is Higher Than Pfizer’s – This Anomaly Won’t Last, by Edmund Ingham
- Hold: Pfizer: In Anticipation Of A New Wave Of COVID-19, by Nathan Aisenstadt
Conclusion: PFE is a high-quality dividend growth stock trading just below my FV estimate of $53. For stocks rated Excellent, I allow a premium valuation of up to 5%. Therefore, my Buy Below price for PFE is $58 per share. For conservative investors, a buy below $48 would be more appropriate.
Please note that we’re not recommending PFE or any of the stocks listed in this article. Readers should do their own research on these companies before buying shares.
Be the first to comment