

Sundry Photography/iStock Editorial via Getty Images
This article was co-produced with James Marino Sr. of Portfolio Insight.
This article series provides a summary of upcoming ex-dividend dates of stocks in Dividend Radar, a weekly automatically generated spreadsheet listing dividend growth stocks with dividend streaks of at least five years.
Created by the author
The ex-dividend date of stocks is usually set one business day before the record date, the cut-off date for determining which shareholders will receive the next dividend payment. If you buy a stock on its ex-dividend date or after, you will not receive the next dividend payment. Instead, the seller will receive the next dividend. If you buy the stock before the ex-dividend date, you will receive the dividend.
Upcoming Ex-Dividend Dates
The following table presents a summary of ex-dividend dates for the next two weeks. The table is divided into sections by Ex-Div Date and sorted by Ticker for each date. Yrs are years of consecutive dividend increases, Yield is the new dividend yield for the market close Price on the date listed, and 5-yr DGR is the compound annual growth rate of the dividend over a 5-year period (on a trailing 12-month basis). Note that Payout is the dollar amount payable per share or unit on the Pay Date.
| Company (Ticker) | Yrs | Price(1 Apr) | Yield | 5-YrDGR | Pay-out | Pay Date |
| Ex-Div Date: 04/08 (Last Day to Buy: Thursday, 04/07) | ||||||
| Culp, Inc. (CULP) | 10 | $7.86 | 5.85% | 8.2% | 0.115 | 04/19 |
| The First Bancorp, Inc. (FNLC) | 10 | $30.02 | 4.26% | 6.9% | 0.32 | 04/22 |
| Hormel Foods Corporation (HRL) | 56 | $52.27 | 1.99% | 10.5% | 0.26 | 05/16 |
| Intuit Inc. (INTU) | 10 | $496.05 | 0.55% | 20.3% | 0.68 | 04/18 |
| Lincoln National Corporation (LNC) | 13 | $65.54 | 2.75% | 10.5% | 0.45 | 05/02 |
| McCormick & Company, Incorporated (MKC) | 23 | $102.79 | 1.44% | 9.6% | 0.37 | 04/25 |
| McCormick & Company, Incorporated (MKC.V) | 36 | $102.59 | 1.44% | 9.6% | 0.37 | 04/25 |
| Omega Flex, Inc. (OFLX) | 5 | $137.53 | 0.87% | 0.0% | 0.3 | 04/25 |
| OGE Energy Corp. (OGE) | 17 | $41.29 | 3.97% | 7.1% | 0.41 | 04/29 |
| Riverview Bancorp, Inc. (RVSB) | 8 | $7.55 | 2.91% | 21.3% | 0.055 | 04/21 |
| UDR, Inc. (UDR) | 13 | $58.16 | 2.61% | 4.2% | 0.38 | 05/02 |
| Universal Corporation (UVV) | 51 | $58.15 | 5.37% | 7.9% | 0.78 | 05/02 |
| Ex-Div Date: 04/11 (Last Day to Buy: Friday, 04/08) | ||||||
| Glacier Bancorp, Inc. (GBCI) | 11 | $48.55 | 2.72% | 9.7% | 0.33 | 04/21 |
| Ex-Div Date: 04/12 (Last Day to Buy: Monday, 04/11) | ||||||
| American Tower Corporation (REIT) (AMT) | 12 | $262.92 | 2.13% | 19.2% | 1.4 | 04/29 |
| Kadant Inc. (KAI) | 10 | $192.94 | 0.54% | 5.7% | 0.26 | 05/11 |
| The PNC Financial Services Group, Inc. (PNC) | 12 | $182.39 | 3.29% | 17.8% | 1.5 | 05/05 |
| Winnebago Industries, Inc. (WGO) | 5 | $53.49 | 1.35% | 8.5% | 0.18 | 04/27 |
| Ex-Div Date: 04/13 (Last Day to Buy: Tuesday, 04/12) | ||||||
| AbbVie Inc. (ABBV) | 10 | $163.43 | 3.45% | 17.7% | 1.41 | 05/16 |
| Abbott Laboratories (ABT) | 9 | $119.48 | 1.57% | 11.7% | 0.47 | 05/16 |
| Accenture plc (ACN) | 11 | $342.82 | 1.13% | 9.9% | 0.97 | 05/13 |
| American Financial Group, Inc. (AFG) | 17 | $144.29 | 1.55% | 12.3% | 0.56 | 04/25 |
| Activision Blizzard, Inc. (ATVI) | 13 | $80.38 | 0.58% | 9.4% | 0.47 | 05/06 |
| Camden National Corporation (CAC) | 10 | $46.79 | 3.42% | 12.3% | 0.4 | 04/29 |
| City Holding Company (CHCO) | 12 | $77.24 | 3.11% | 6.4% | 0.6 | 04/29 |
| EOG Resources, Inc. (EOG) | 5 | $117.83 | 2.55% | 24.3% | 0.75 | 04/29 |
| Global Water Resources, Inc. (GWRS) | 5 | $16.92 | 1.74% | 4.1% | 0.025 | 04/29 |
| Johnson Outdoors Inc. (JOUT) | 9 | $76.86 | 1.56% | 24.6% | 0.3 | 04/28 |
| Quaker Chemical Corporation (KWR) | 15 | $177.58 | 0.93% | 3.6% | 0.415 | 04/29 |
| Mid-America Apartment Communities, Inc. (MAA) | 13 | $211.28 | 2.06% | 4.6% | 1.088 | 04/29 |
| McGrath RentCorp (MGRC) | 30 | $84.53 | 2.15% | 16.4% | 0.455 | 04/29 |
| Norwood Financial Corp. (NWFL) | 22 | $28.69 | 3.90% | 4.9% | 0.28 | 05/02 |
| Bank OZK (OZK) | 26 | $41.78 | 2.87% | 12.2% | 0.31 | 04/22 |
| RGC Resources, Inc. (RGCO) | 22 | $21.38 | 3.65% | 6.4% | 0.195 | 05/01 |
| RPM International Inc. (RPM) | 48 | $83.12 | 1.92% | 6.3% | 0.4 | 04/29 |
| Trinity Industries, Inc. (TRN) | 12 | $32.27 | 2.85% | 14.4% | 0.23 | 04/29 |
| WD-40 Company (WDFC) | 13 | $177.71 | 1.76% | 10.9% | 0.78 | 04/29 |
| Watsco, Inc. (WSO) | 9 | $302.43 | 2.91% | 15.5% | 2.2 | 04/29 |
| Watsco, Inc. (WSO.B) | 9 | $301.25 | 2.59% | 15.5% | 2.2 | 04/29 |
| Ex-Div Date: 04/14 (Last Day to Buy: Wednesday, 04/13) | ||||||
| Alamo Group Inc. (ALG) | 8 | $140.02 | 0.51% | 10.2% | 0.18 | 05/02 |
| Graco Inc. (GGG) | 25 | $69.96 | 1.20% | 11.4% | 0.21 | 05/04 |
| Ex-Div Date: 04/18 (Last Day to Buy: Friday, 04/15) | ||||||
| The Greenbrier Companies, Inc. (GBX) | 7 | $46.90 | 2.30% | 5.4% | 0.27 | 05/10 |
| Ex-Div Date: 04/19 (Last Day to Buy: Monday, 04/18) | ||||||
| Graham Holdings Company (GHC) | 6 | $602.45 | 1.05% | 4.5% | 1.58 | 05/12 |
| Lowe’s Companies, Inc. (LOW) | 60 | $204.87 | 1.56% | 17.7% | 0.8 | 05/04 |
| West Pharmaceutical Services, Inc. (WST) | 29 | $408.64 | 0.18% | 7.0% | 0.18 | 05/04 |
| Ex-Div Date: 04/20 (Last Day to Buy: Tuesday, 04/19) | ||||||
| Colgate-Palmolive Company (CL) | 59 | $77.45 | 2.43% | 2.9% | 0.47 | 05/13 |
| Zoetis Inc. (ZTS) | 10 | $188.40 | 0.69% | 22.5% | 0.325 | 06/01 |
Previous Post: Upcoming Ex-Dividend Dates: March 31-April 13, 2022
High-Quality Candidates
We use DVK Quality Snapshots to assess the quality of dividend growth stocks. This elegant and effective system employs five quality indicators and assigns 0-5 points to each quality indicator, for a maximum quality score of 25 points.
By assigning quality scores to all Dividend Radar stocks with upcoming ex-dates, we could screen for the highest-quality candidates. This week, ten stocks have quality scores of 22 or higher.
We present the quality scores, an assessment of fair value (whether Above, At, or Below fair value), and two measures of each stock’s recent performance (1-year and 3-year trailing total returns [TTR]). Key metrics from the previous table are repeated here for convenience:
Created by the author from data in Dividend Radar and using DVK Quality Snapshots
Dividend Radar views fair value as a range. Three stocks are trading at discounted valuations below the fair value range (LOW, MA, and VZ) and one stock is trading at a premium valuation above the fair value range (ACN). The remaining stocks are fairly valued as they are trading within the fair value range.
TTR adds the returns due to stock price appreciation (or depreciation) and dividend payments over each time frame. Dividend Radar provides 1-year and 3-year TTRs. In the summary table, we highlight 3-year TTRs of 10% or higher in orange, and each 1-year TRR that exceeds the 3-year TTR in green (indicating stronger recent performance).
All but three of this week’s candidates have 3-year TTRs above 10%, while four candidates have 1-year TTRs that exceed their 3-year TTRs (HRL, INTU, ORCL, and TD).
We also color-code the Yield and 5-yr DGR columns, preferring dividend yields above 2.5% and 5-year dividend growth rates of 10% or higher.
Only two candidates yield more than 2.5% (TD and VZ), while six candidates have 5-year dividend growth rates above 10% (ABT, HRL, INTU, LOW, MA, and ORCL).
An Interesting Candidate
Ideally, we’d like to see green cells in each of the Fair Value, 1-yr TTR, Yield, and 5-yr DGR columns. That rarely happens, though, so we look for a candidate that offers the best metrics overall, at least based on our current investment objectives.
We haven’t focused on Dividend Contender INTU yet, so let’s do so this week!
Intuit (INTU) provides financial management and compliance products and services for consumers, small businesses, self-employed, and accounting professionals in the United States, Canada, and internationally. The company operates in three segments: Small Business & Self-Employed, Consumer, and Strategic Partner. INTU was founded in 1983 and is headquartered in Mountain View, California.
INTU is rated Fine (quality score 19-22):
Created by the author from a personal spreadsheet based on DVK Quality Snapshots.
The stock yields only 0.55% at $496.05 per share but has a spectacular 5-year DGR of 20.3%!
Over the past 10 years, INTU outperformed the SPDR S&P 500 ETF (SPY), an ETF designed to track the 500 companies in the S&P 500 index:
Portfolio-Insight.com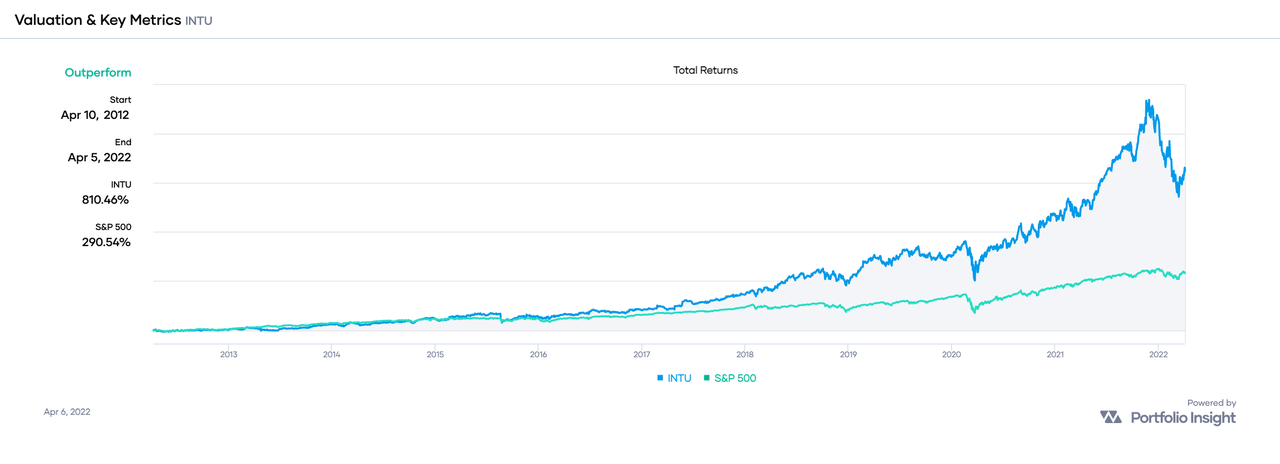
INTU‘s total returns of 810% outperformed SPY’s 291% by a healthy margin of 2.78-to-1.
If we extend the time frame of comparison to the past 20 years, INTU’s outperformance of SPY is even more impressive, in this case by a margin of 5.83-to-1. INTU’s total returns over this period were 2,843% versus SPY’s 488%.
Here is a chart showing INTU’s dividend growth history through the end of 2021:
Portfolio-Insight.com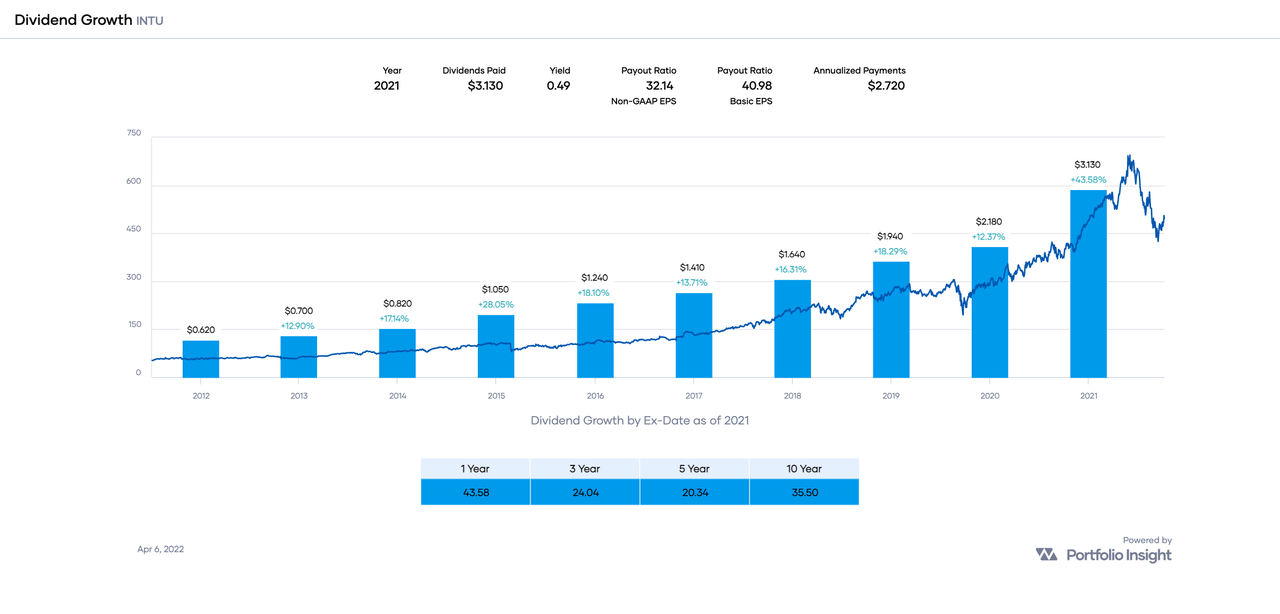
INTU’s dividend growth is impressive and its dividend growth rate [DGR] is accelerating, particularly in recent years. We can characterize this acceleration by dividing the 3-year dividend growth rate by the 5-year counterpart, 24.04 ÷ 20.34 = 1.18. A ratio above 1.00 indicates an acceleration of the DGR.
The company’s EPS history likewise is impressive, except for a poor year in FY 2015 where earnings dropped nearly 26%. Earnings estimates for FY 2022 through FY 2024 look great and likely will maintain the stock’s earnings growth rate of around 20%!
Portfolio-Insight.com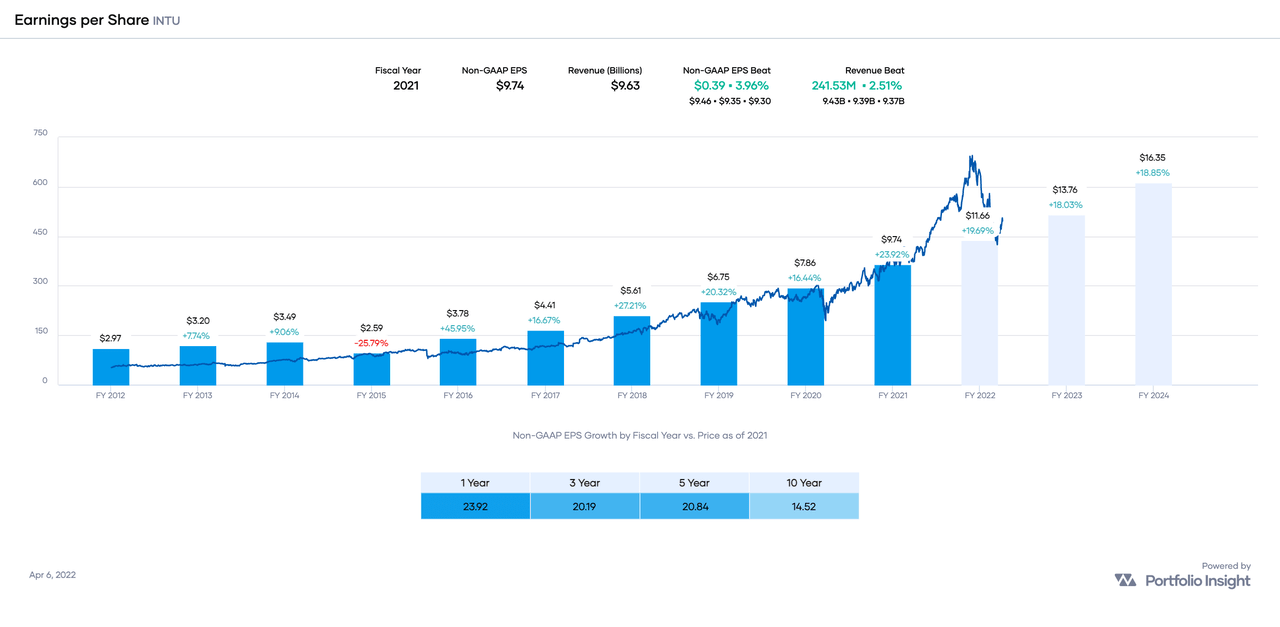
INTU’s payout ratio of 23% is “very low for most companies”, according to Simply Safe Dividends:
Simply Safe Dividends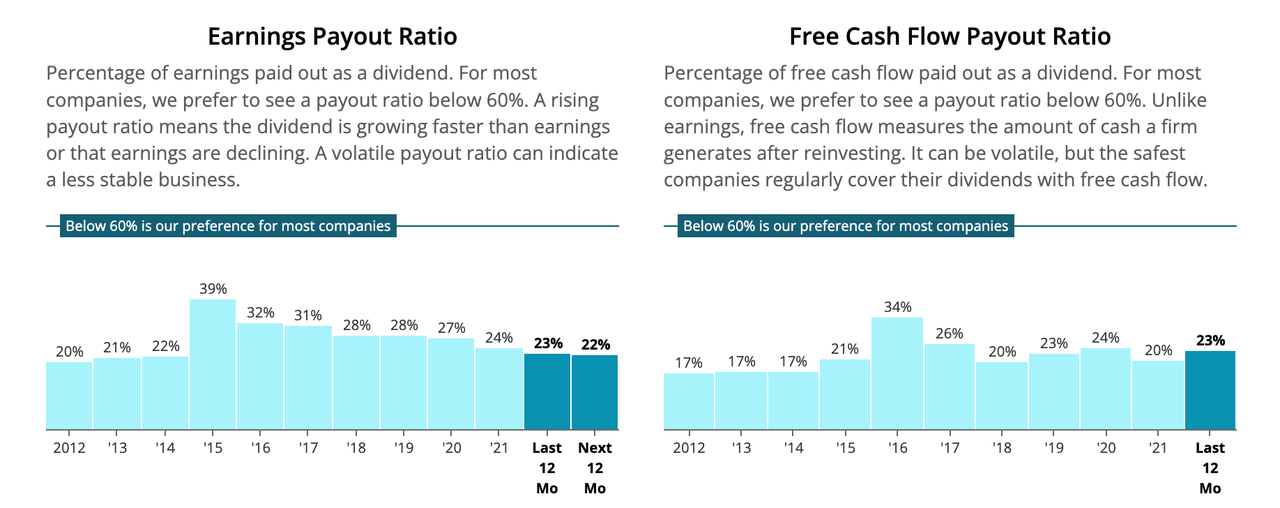
Simply Safe Dividends considers INTU’s dividend Very Safe with a Dividend Safety Score of 98.
Let’s now consider INTU’s valuation.
Portfolio-Insight.com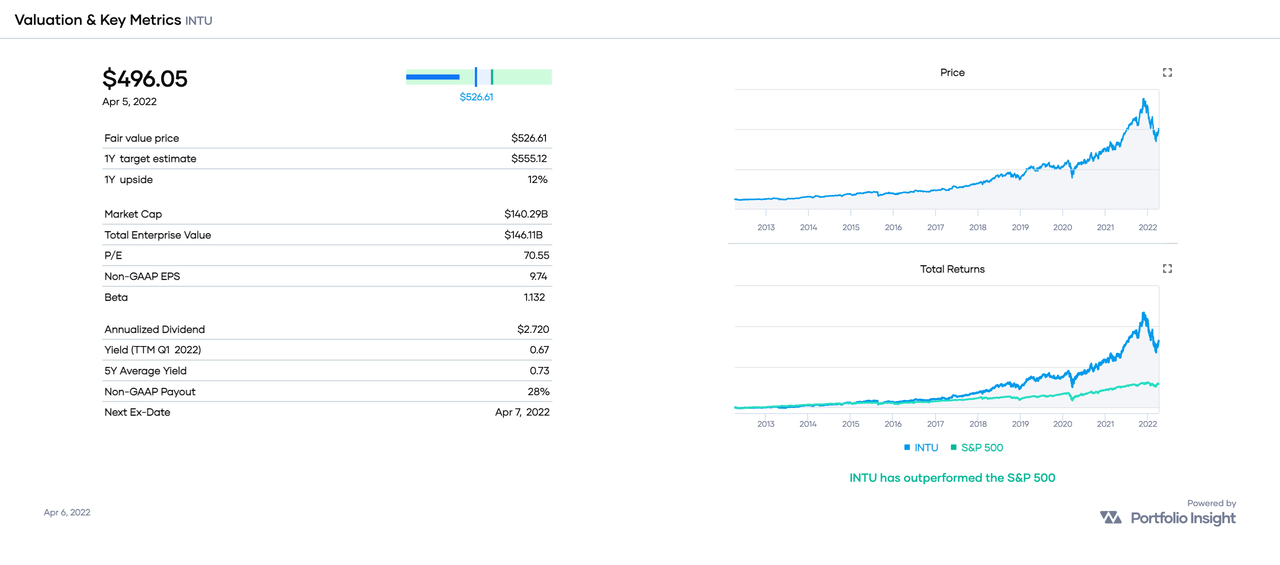
A quick way to estimate fair value is to divide the annualized dividend ($2.72) by the stock’s 5-year average yield (0.73%). That results in a fair value [FV] estimate of $373 based on INTU’s dividend yield history.
For reference, CFRA’s FV is $395, Finbox.com’s FV is $477, Morningstar’s FV is $511, Portfolio Insight’s FV is $527, and Simply Wall St’s FV is $541. That’s quite a range of opinions!
My own FV estimate of INTU is $438.
The average of all these estimates is $466. Given the stock’s current share price of $496.05, it would appear that INTU is trading at a premium of about 6.4%.
Here are the most recent Seeking Alpha articles covering INTU:
Conclusion:
INTU is a high-quality dividend growth stock trading well above my fair value estimate of $438. For stocks rated Fine, I require a discounted valuation relative to my fair value estimate, so my Buy Below price is $438 per share. For conservative investors, a buy below $394 would be more appropriate.
Be the first to comment