

JHVEPhoto/iStock Editorial via Getty Images
Upcoming Ex-Dividend Dates: 15-27 April 2022
This article was co-produced with James Marino Sr. of Portfolio Insight.
In this article series, we summarize upcoming ex-dividend dates for stocks in Dividend Radar, a weekly automatically generated spreadsheet of dividend growth stocks with dividend increase streaks of at least five years.
Created by the author.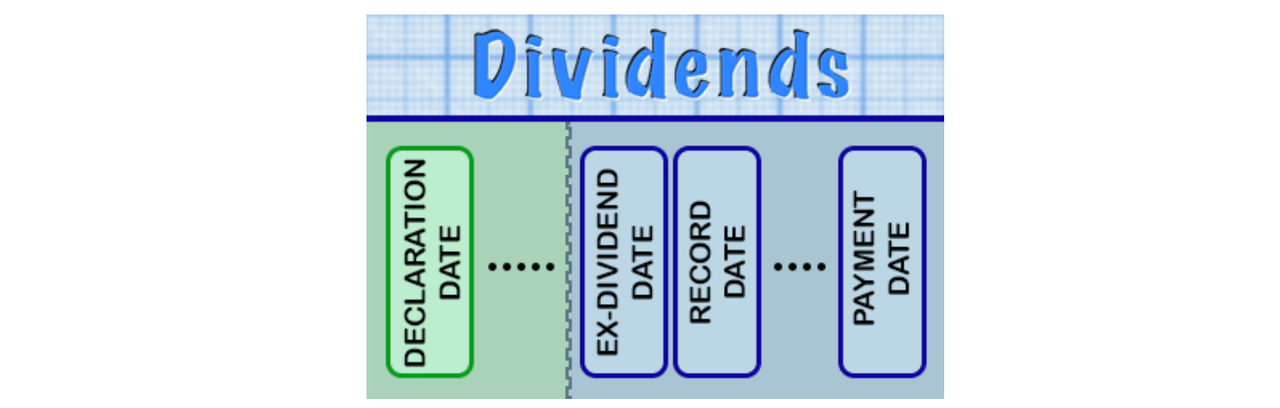
To earn the next dividend, be sure to buy a stock before the ex-dividend date, which is usually one business day before the record date. If you wait until the ex-dividend date or thereafter, unfortunately, you won’t receive the next dividend payment! Instead, the seller will receive the next dividend payment.
Upcoming Ex-Dividend Dates
The following table presents a summary of ex-dividend dates for the next two weeks. The table is divided into sections by Ex-Div Date and sorted by Ticker for each date. Yrs are years of consecutive dividend increases, Yield is the new dividend yield for the market close Price on the date listed, and 5-yr DGR is the compound annual growth rate of the dividend over a 5-year period (on a trailing 12-month basis). Note that Payout is the dollar amount payable per share or unit on the Pay Date.
| Company (Ticker) | Yrs | Price | Fwd | 5-Yr | Next | Pay |
| (04/14) | Yield | DGR | Payout | Date | ||
| Ex-Div Date: 04/18 (Last Day to Buy: Friday, 04/15) | ||||||
| Greenbrier (GBX) | 7 | $45.51 | 2.37% | 5.4% | 0.27 | 05/10 |
| Ex-Div Date: 04/19 (Last Day to Buy: Monday, 04/18) | ||||||
| Graham (GHC) | 6 | $611.41 | 1.03% | 4.5% | 1.58 | 05/12 |
| Lowe’s (LOW) | 60 | $205.51 | 1.56% | 17.7% | 0.8 | 05/04 |
| West Pharmaceutical Services (WST) | 29 | $387.02 | 0.19% | 7.0% | 0.18 | 05/04 |
| Ex-Div Date: 04/20 (Last Day to Buy: Tuesday, 04/19) | ||||||
| Colgate-Palmolive (CL) | 59 | $80.99 | 2.32% | 2.9% | 0.47 | 05/13 |
| H.B. Fuller (FUL) | 53 | $68.99 | 0.97% | 3.7% | 0.19 | 05/05 |
| Zoetis (ZTS) | 10 | $189.52 | 0.69% | 22.5% | 0.325 | 06/01 |
| Ex-Div Date: 04/21 (Last Day to Buy: Wednesday, 04/20) | ||||||
| Williams-Sonoma (WSM) | 16 | $153.14 | 2.04% | 11.9% | 0.78 | 05/27 |
| Ex-Div Date: 04/22 (Last Day to Buy: Thursday, 04/21) | ||||||
| Royal Bank of Canada (RY) | 7 | $108.58 | 3.50% | 7.2% | 1.2 | 05/24 |
| Ex-Div Date: 04/26 (Last Day to Buy: Monday, 04/25) | ||||||
| Clorox (CLX) | 45 | $145.39 | 3.19% | 7.7% | 1.16 | 05/13 |
| Ex-Div Date: 04/28 (Last Day to Buy: Wednesday, 04/27) | ||||||
| AES (AES) | 10 | $24.47 | 2.58% | 6.3% | 0.158 | 05/13 |
| A. O. Smith (AOS) | 29 | $64.70 | 1.73% | 16.7% | 0.28 | 05/16 |
| Ames National (ATLO) | 12 | $24.23 | 4.46% | 4.4% | 0.27 | 05/13 |
| Enterprise Products Partners (EPD) | 25 | $26.72 | 6.96% | 7.2% | 0.465 | 05/12 |
| NiSource (NI) | 6 | $31.68 | 2.97% | 6.3% | 0.235 | 05/20 |
| PNM Resources (PNM) | 11 | $48.00 | 2.90% | 8.1% | 0.348 | 05/13 |
| Virtus Investment Partners (VRTS) | 5 | $207.01 | 2.90% | 20.9% | 1.5 | 05/13 |
| Ex-Div Date: 04/29 (Last Day to Buy: Thursday, 04/28) | ||||||
| Bank of Montreal (BMO) | 7 | $113.34 | 3.69% | 6.5% | 1.33 | 05/26 |
| Casey’s General Stores (CASY) | 23 | $210.63 | 0.66% | 8.0% | 0.35 | 05/16 |
| Ex-Div Date: 05/02 (Last Day to Buy: Friday, 04/29) | ||||||
| Main Street Capital (MAIN) | 11 | $41.86 | 6.16% | 0.9% | 0.215 | 05/13 |
| Ex-Div Date: 05/03 (Last Day to Buy: Monday, 05/02) | ||||||
| VSE (VSEC) | 9 | $40.41 | 0.99% | 9.5% | 0.1 | 05/18 |
| Ex-Div Date: 05/04 (Last Day to Buy: Tuesday, 05/03) | ||||||
| Entergy (ETR) | 8 | $123.37 | 3.27% | 2.7% | 1.01 | 06/01 |
| Constellation Brands (STZ) | 7 | $248.63 | 1.22% | 13.7% | 0.8 | 05/19 |
| Constellation Brands (STZ.B) | 7 | $281.25 | 0.98% | 13.9% | 0.72 | 05/19 |
Previous Post: Upcoming Ex-Dividend Dates: April 8-20, 2022
High-Quality Candidates
To assess the quality of dividend growth stocks, we use DVK Quality Snapshots, an elegant and effective system devised by David Van Knapp. The system employs five quality indicators and assigns 0-5 points to each quality indicator, for a maximum quality score of 25 points.
We assign quality scores to every Dividend Radar stock with upcoming ex-dividend dates and screen for the stocks with quality scores of 22 or higher. This week we found 3 candidates.
Below we present the quality scores, an assessment of fair value (whether Above, At, or Below fair value), and two measures of each stock’s recent performance (1-year and 3-year trailing total returns (TTR)). Key metrics from the previous table are repeated here for convenience.
Created by the author from data in Dividend Radar and using DVK Quality Snapshots.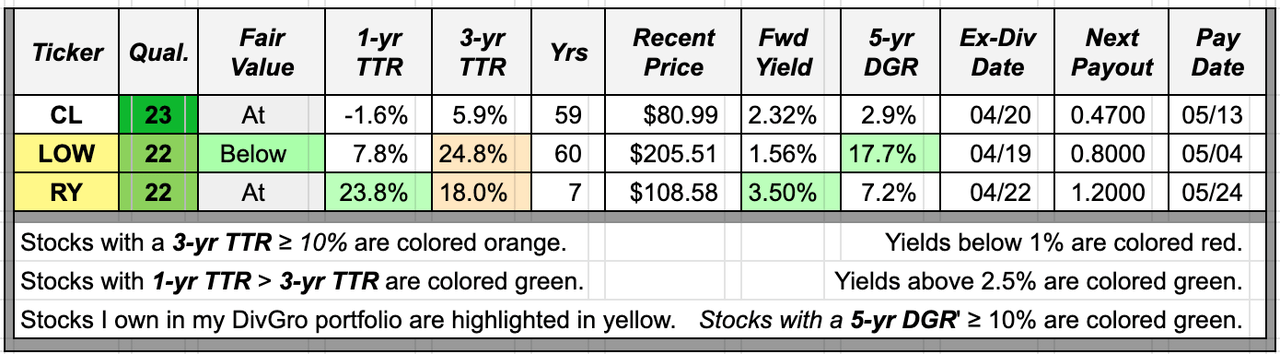
Dividend Radar regards fair value as a range. One stock in this week’s shortlist is trading at a discounted valuation below the fair value range (LOW) while the other two stocks are fairly valued as they are trading within the fair value range.
TTR adds the returns due to stock price appreciation (or depreciation) and dividend payments over each time frame. Dividend Radar provides 1-year and 3-year TTRs. In the summary table, we highlight 3-year TTRs of 10% or higher in orange, and 1-year TRRs that exceed the 3-year TTR, in green (indicating stronger recent performance).
Two of this week’s candidates have 3-year TTRs above 10% (LOW and RY), but only RY has a 1-year TTR that exceeds its 3-year TTR.
We also color-code the Yield and 5-yr DGR columns, preferring dividend yields above 2.5% and 5-year dividend growth rates of 10% or higher.
Only RY yields more than 2.5% and only LOW has a 5-year dividend growth rate above 10%.
An Interesting Candidate
Ideally, we’d like to see green cells in each of the Fair Value, 1-yr TTR, Yield, and 5-yr DGR columns. That rarely happens, though, so we look for a candidate that offers the best metrics overall, at least based on our current investment objectives.
We last focused on Dividend Champion LOW in April 2021, so let’s revisit it this week. Remarkably, LOW has increased its dividend payments every year for sixty years!
Lowe’s is a home improvement retailer. The company offers a complete line of products for maintenance, repair, remodeling, and home decorating. It also offers installation services through independent contractors, as well as extended protection plans and repair services. LOW was founded in 1946 and is based in Mooresville, North Carolina.
LOW is rated Fine (quality score 19-22):
Created by the author from a personal spreadsheet based on DVK Quality Snapshots.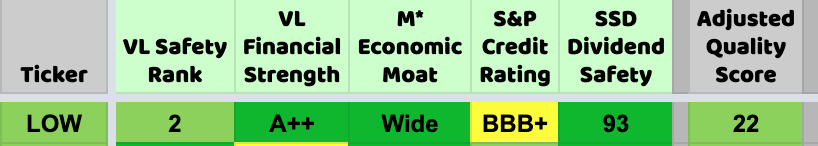
The stock yields 1.56% at $205.51 per share and has an impressive 5-year DGR of 17.7%.
Over the past 10 years, LOW easily outperformed the SPDR S&P 500 ETF (SPY), an ETF designed to track the 500 companies in the S&P 500 index:
Portfolio-Insight.com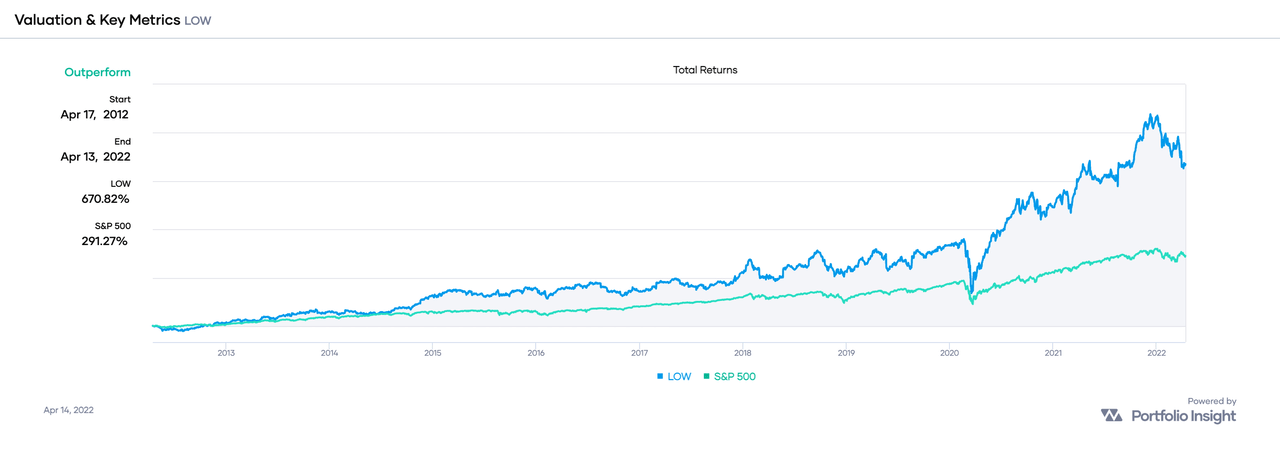
LOW delivered total returns of 671% versus SPY’s 291%, a margin of 2.31-to-1!
If we extend the time frame of comparison to the past 20 years, LOW also outperformance SPY, in this case returning 1,108% versus SPY’s 484%. That’s a margin of 2.29-to-1!
Here is a chart showing LOW’s dividend growth history through the end of 2021:
Portfolio Insight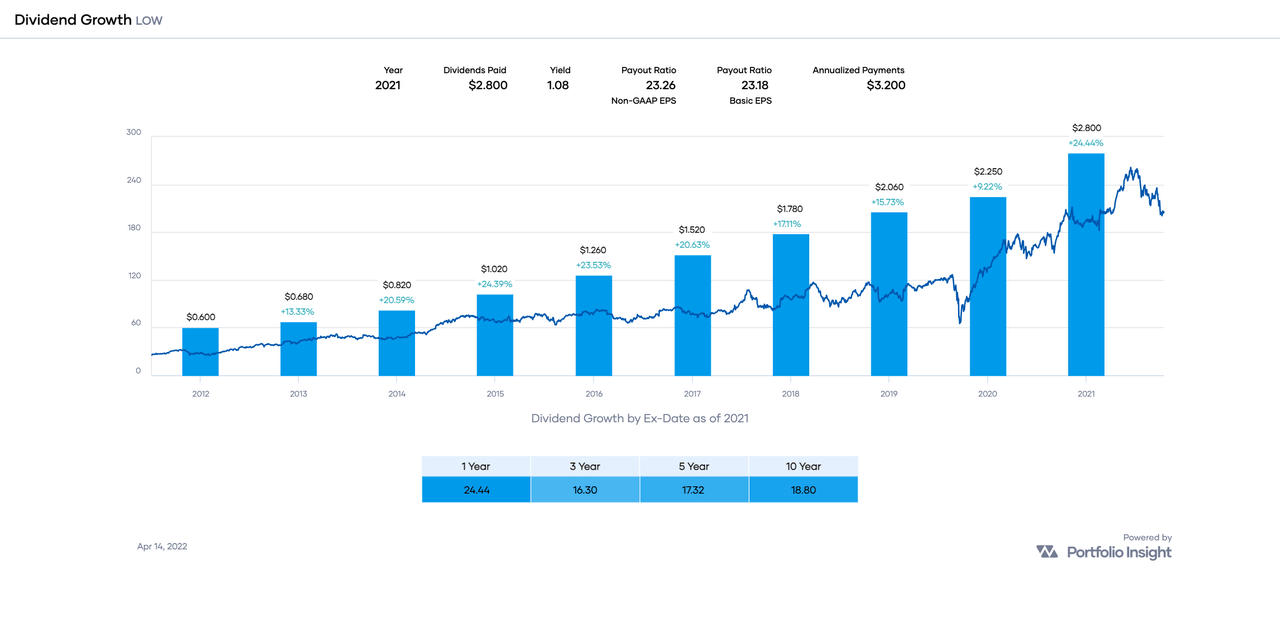
LOW’s dividend growth is impressive and a model of consistency! As a dividend growth investor, I love charts like this one! Note that LOW’s latest dividend increase of 24% easily tops prior dividend increases (at least over the past decade!)
The company’s EPS history likewise is impressive, with increases every year for the past ten years! Earnings estimates for FY 2023 and FY 2024 look strong, too!
Portfolio Insight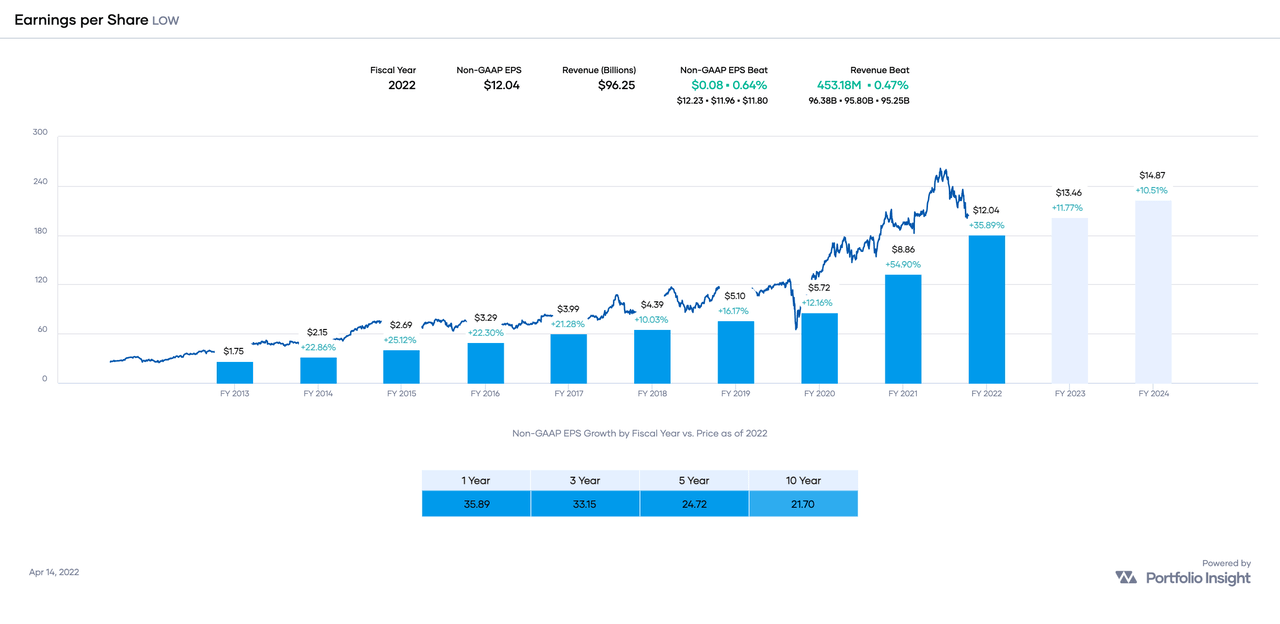
LOW’s payout ratio of 25% is “very low for most companies”, according to Simply Safe Dividends:
Simply Safe Dividends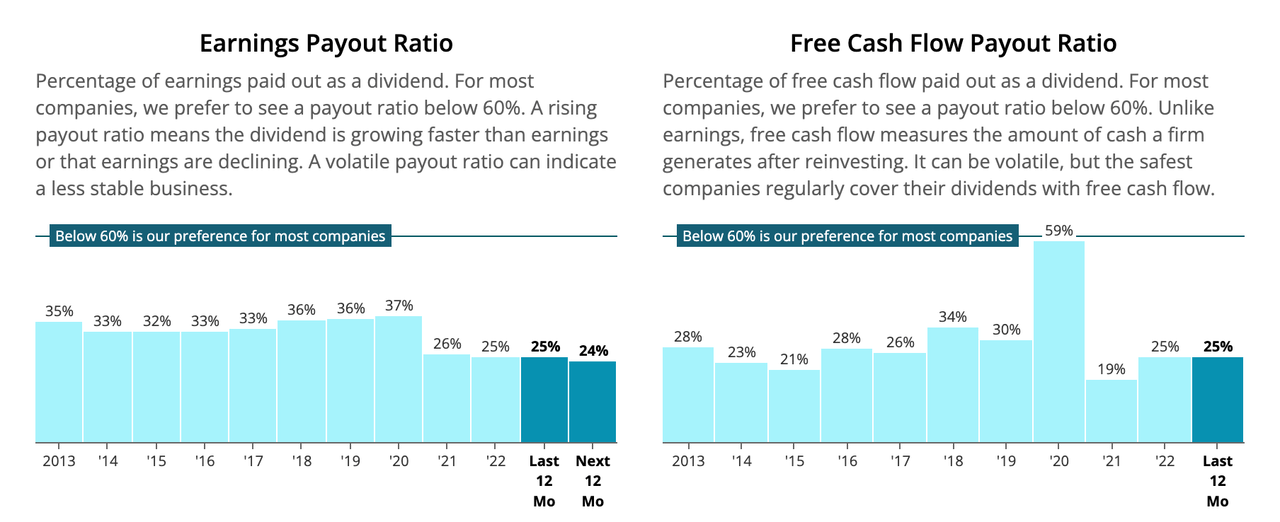
The company has plenty of room to continue with generous dividend increases for the foreseeable future! Moreover, Simply Safe Dividends considers LOW’s dividend Very Safe with a Dividend Safety Score of 93.
Let’s now consider LOW’s valuation.
Portfolio Insight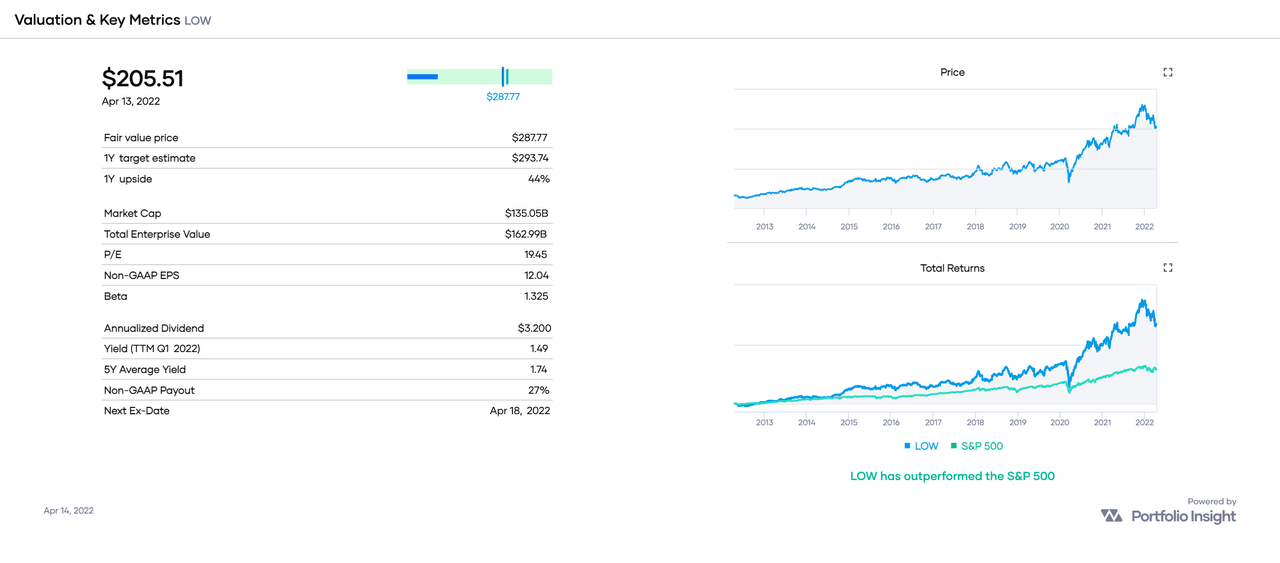
A quick way to estimate fair value is to divide the annualized dividend ($3.20) by the stock’s 5-year average yield (1.74%). That results in a fair value (FV) estimate of $184 based on LOW’s dividend yield history.
For reference, CFRA’s FV is $202, Morningstar’s FV is $203, Finbox.com’s FV is $255, Simply Wall St’s FV is $279, and Portfolio Insight’s FV is $288.
My own FV estimate of LOW is $213.
The average of all these estimates is $232. Given the stock’s current share price of $205.51, it would appear that LOW is trading at a discounted valuation.
Here are the most recent Seeking Alpha articles covering LOW:
Conclusion: LOW is a high-quality dividend growth stock trading below my fair value estimate of $213. For stocks rated Fine, I require a discounted valuation relative to my fair value estimate, so my Buy Below price is $213 per share. For conservative investors, a buy below $192 would be more appropriate.
Be the first to comment