

Falcor/iStock via Getty Images
We’re nearing the start of the Q1 Earnings Season for the Gold Miners Index (GDX) and one of the first companies to release its preliminary results is Osisko Gold Royalties (NYSE:OR). The company reported a slight dip in quarterly gold-equivalent ounces [GEOs] earned offset by a record quarterly cash margin of 94%. However, while Q1 volume was a little softer, the company expects to see significant growth in GEO volumes this year. Given the company’s industry-leading growth profile and attractive valuation, I see this recent underperformance in the stock as a buying opportunity.
All references to “Osisko” in this article refer to Osisko Gold Royalties, a mid-cap royalty company, and all references to “Osisko Mining” refer to Osisko Mining (OTCPK:OBNNF), a development-stage company with its flagship project in Quebec.
Canadian Malartic Operations – Osisko GR (5% NSR Royalty) (Yamana Gold Presentation)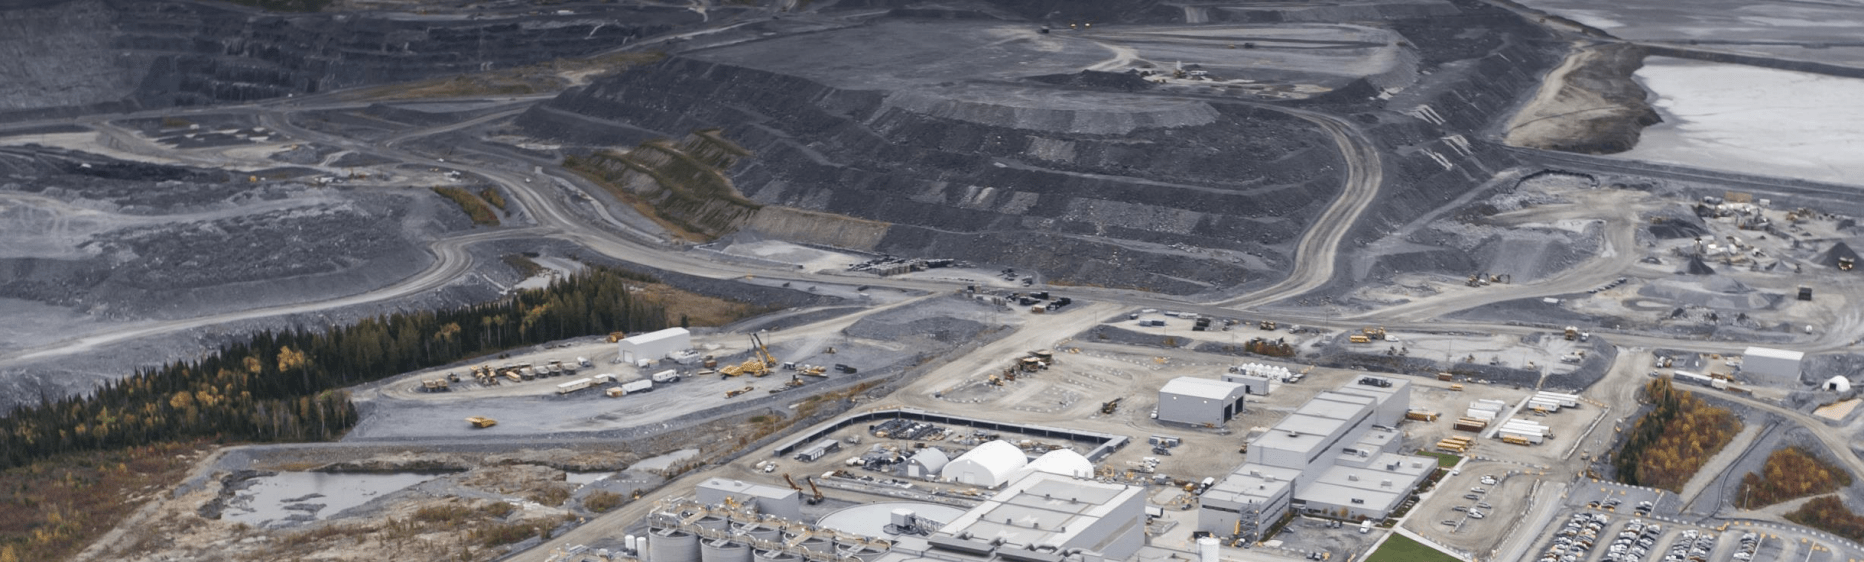
Osisko Gold Royalties (“Osisko”) released its preliminary Q1 results this week, reporting a quarterly volume of ~18,300 GEOs earned, an 8% decline from the year-ago period. While this might appear disappointing at first glance, it’s important to note that this was to be expected. This is because one of the company’s larger contributors, the Eagle Gold Mine, has a much weaker Q1 and H2 each year due to its decision to forego stacking ore on the leach pads in the coldest period of the year in the Yukon. The seasonal headwind translates to a nearly ~1,000 GEO shortfall, or ~5% of Osisko’s attributable Q1 production.
Osisko Gold Royalties – Quarterly GEOs Earned (Company Filings, Author’s Chart)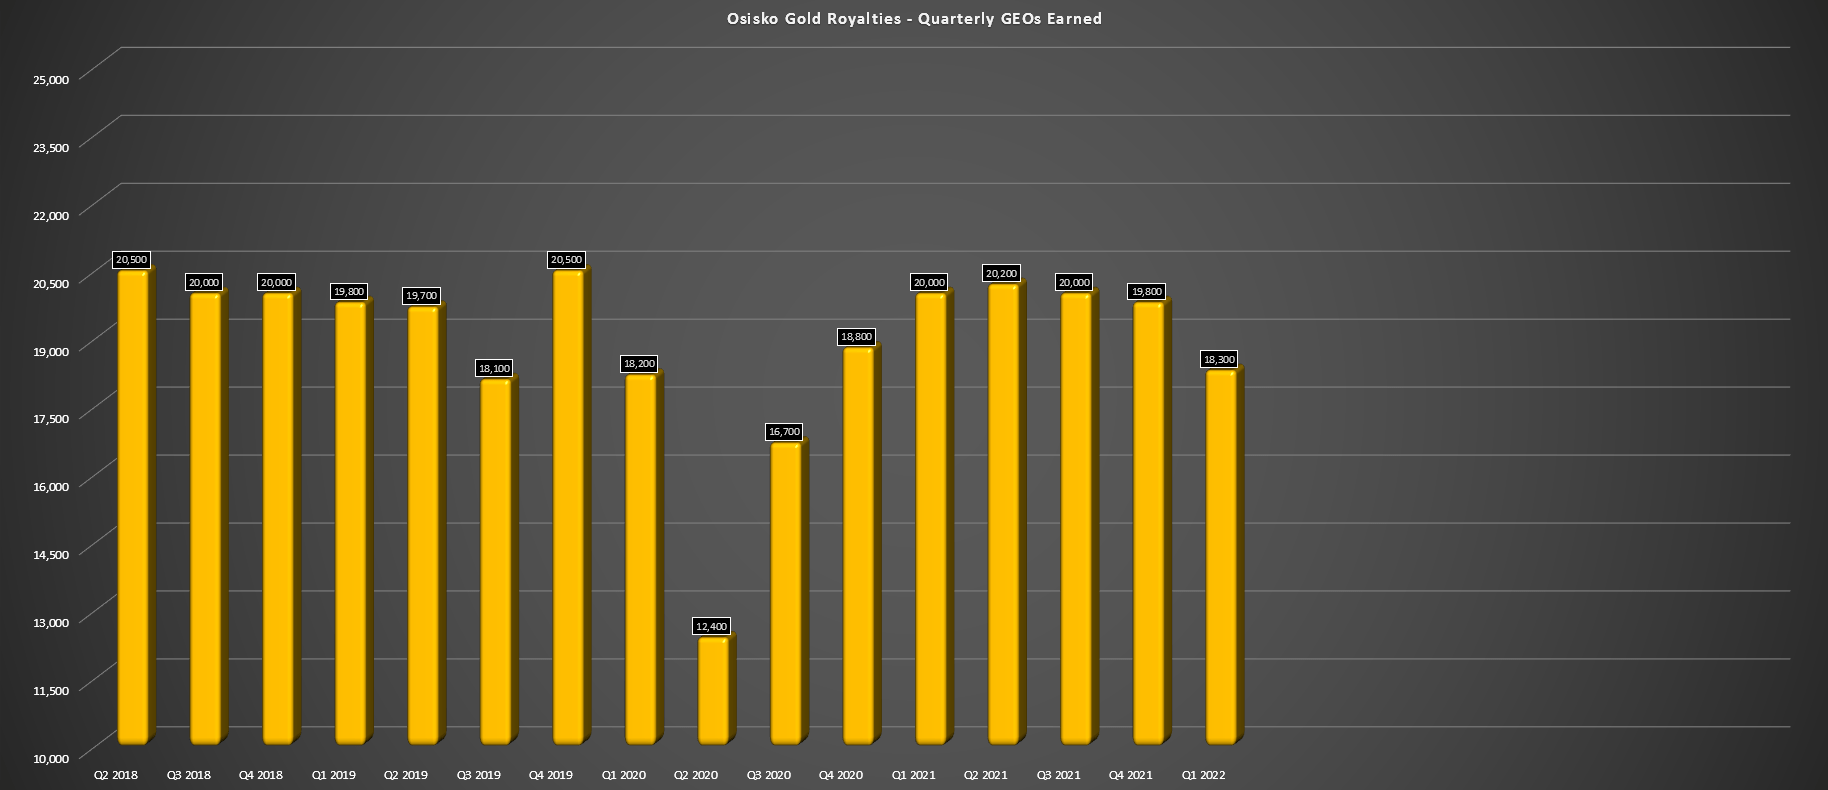
The good news is that this seasonal headwind should be less impactful beginning next year, with Victoria Gold (OTCPK:VITFF) planning to reduce its no-stacking period to just six weeks. At the same time, the company is looking to ramp up production to 250,000 ounces per annum next year, meaning that Osisko’s attributable production from this asset will increase from ~9,000 GEOs per annum to 12,500 GEOs per annum, representing significant growth. The other key point worth noting is that the Renard Diamond Stream will begin contributing again in May, which will add more than 2,500 GEOs per quarter.
For those unfamiliar, proceeds from the Renard Diamond Stream will no longer be invested into the bridge loan beginning this May, meaning that revenue from this asset (FY2021 attributable production: ~9,200 GEOs) will be recognized as GEOs.
In addition to a boost from Renard and more normal quarterly production from Eagle starting in Q2, the company will also benefit from the Mantos Expansion, the progressive ramp-ups of production at Ermitano, and Minera Alamos’ (OTCQX:MAIFF) Santana operation, and a major stream announced earlier this year. This addition was the silver stream on the high-grade CSA Mine in Australia, which covers 100% of payable silver at 4% of the spot silver price and will translate to more than 5,000 GEOs per annum beginning in 2023. However, Osisko should see some contribution in H2 of this year.
CSA Mine – Australia (Osisko Company Presentation)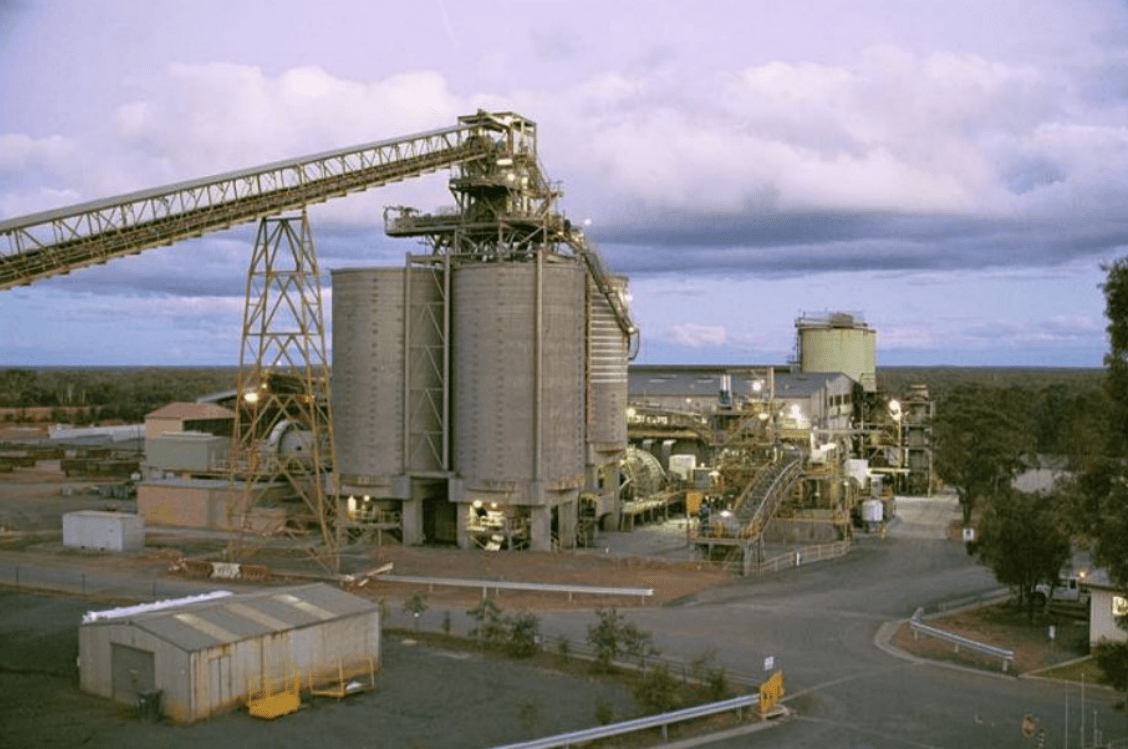
So, while the year-over-year decline in quarterly GEOs in Q1 may turn off some investors, the real story is the nearly 20% growth expected this year (~80,000 GEOs —–> ~95,000 GEOs). This is based on the previous guidance of ~92,500 GEOs at the mid-point plus additional contribution from the CSA Mine, which was not included in the February 2022 guidance update.
Canadian Malartic – Recent Developments
One area of concern among some investors that occasionally comes up is the belief that Canadian Malartic’s best days are over, with this being Osisko’s #1 asset, contributing ~35,600 GEOs in FY2021. However, the belief that this asset is a point of weakness is a strange argument unless one has completely ignored all of the developments over the past year by the Canadian Malartic Partnership [“CMP”]. In fact, I would argue that Canadian Malartic is one of the company’s strengths, operated by two of the best gold producers sector-wide with a laser focus on exploration and resource/reserve growth.
CMP Mine Plan – Canadian Malartic (Company Technical Report)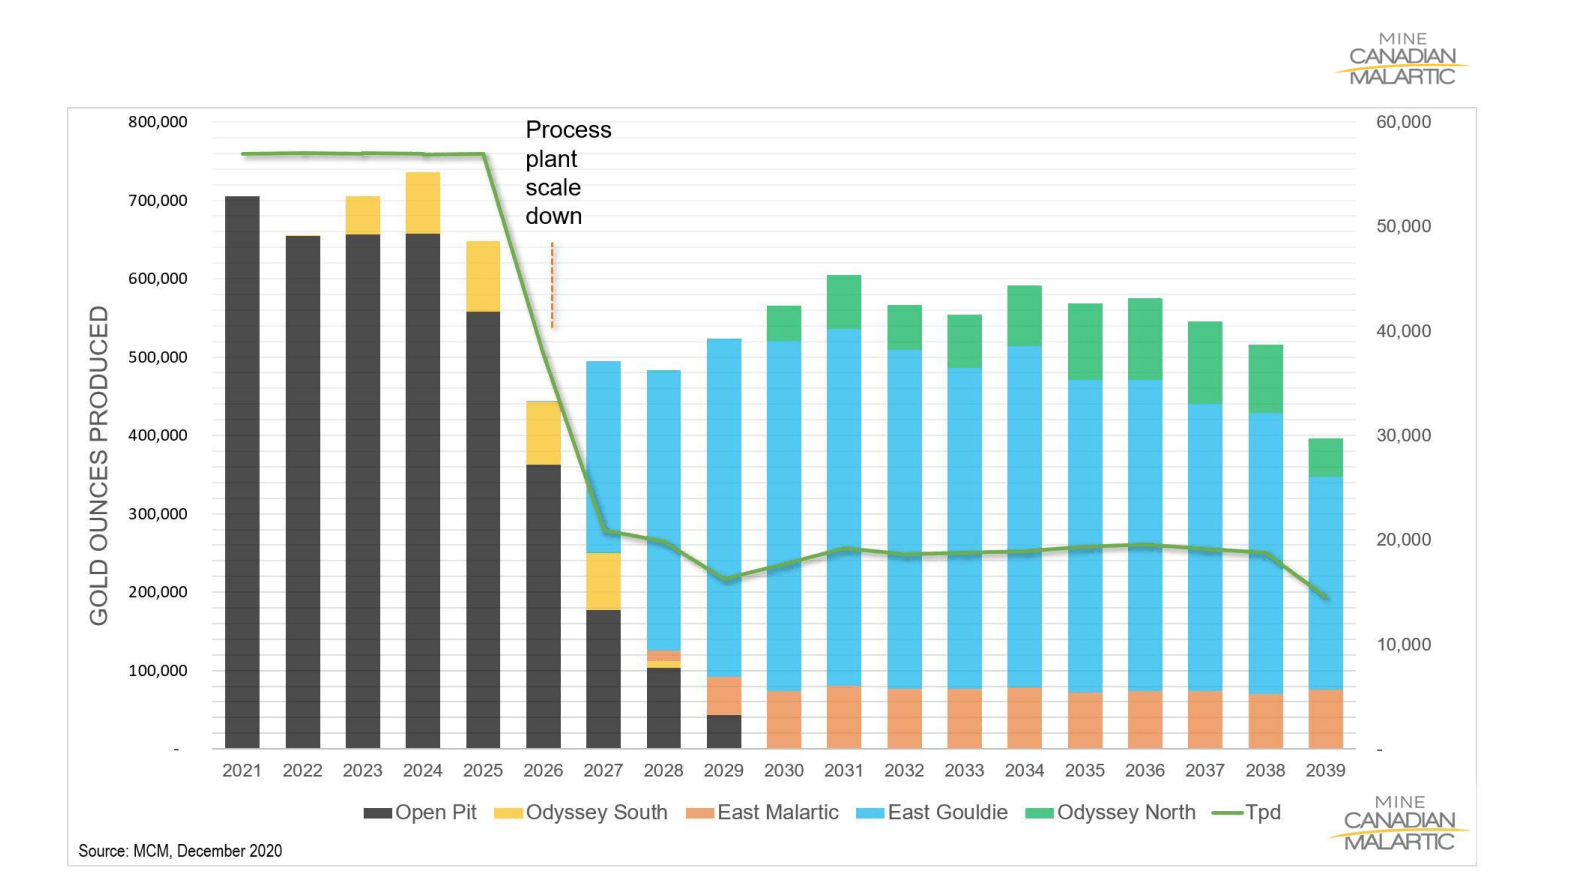
If we look at the chart above, it is quite clear that Osisko’s attributable production from Canadian Malartic from its 5% net smelter return [NSR] royalty is set to decline steadily as the CMP transitions from open-pit to underground mining. However, while this will lead to a decline in annual production at this asset starting in 2025 as the processing plant scales down to ~19,000 tonnes per day, this will leave an excess capacity of ~40,000 tonnes per day or ~14.6 million tonnes per annum at the mill. This represents significant processing capacity and opens up significant possibilities post-2025. It’s also worth noting that while Osisko’s attributable production will dip, other assets will more than pick up the slack.
Canadian Malartic Deposits/Zones (Yamana Gold Presentation)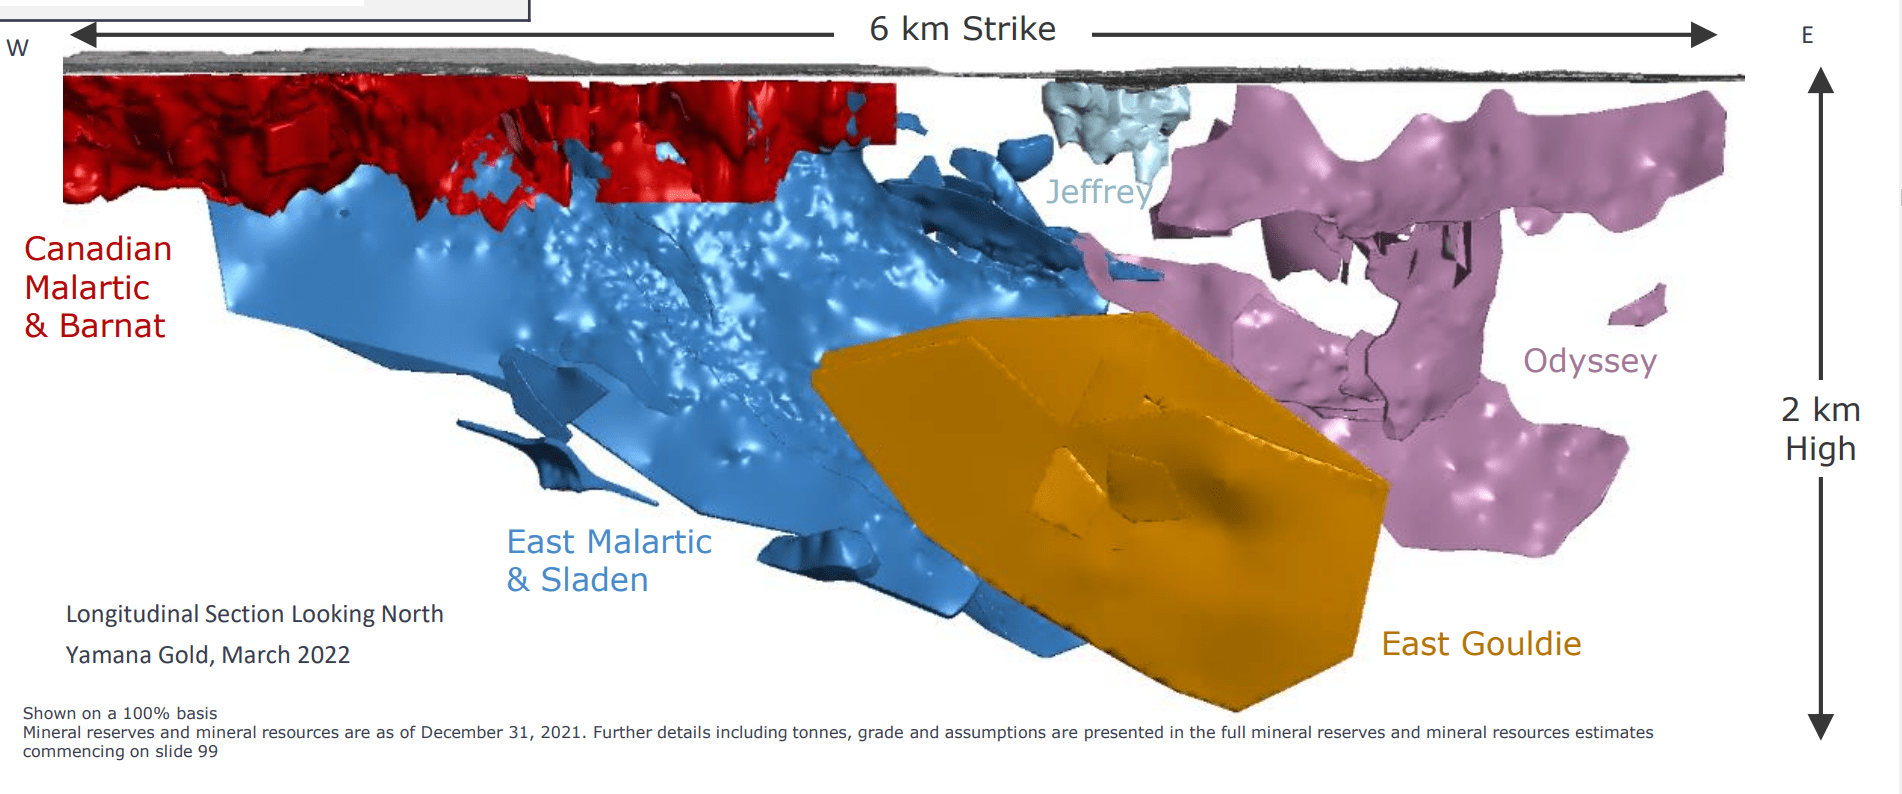
Looking at the Canadian Malartic Project above, we can see that the underground resource has grown at a torrid pace thanks to continued exploration success. The project is now home to ~15.5 million ounces of underground resources at a grade well above the operation’s open-pit grades. Notably, the highest-grade portion of this underground ore body continues to grow (East Gouldie) and now stands at ~1.50 million ounces at 3.88 grams per tonne gold, with an additional ~6.2 million ounces of gold in the inferred category at 3.07 grams per tonne gold. These grades are phenomenal, and the asset’s thick intercepts will allow for mine production north of 12,000 tonnes per day from East Gouldie alone.
East Gouldie Extension (Yamana Gold Presentation)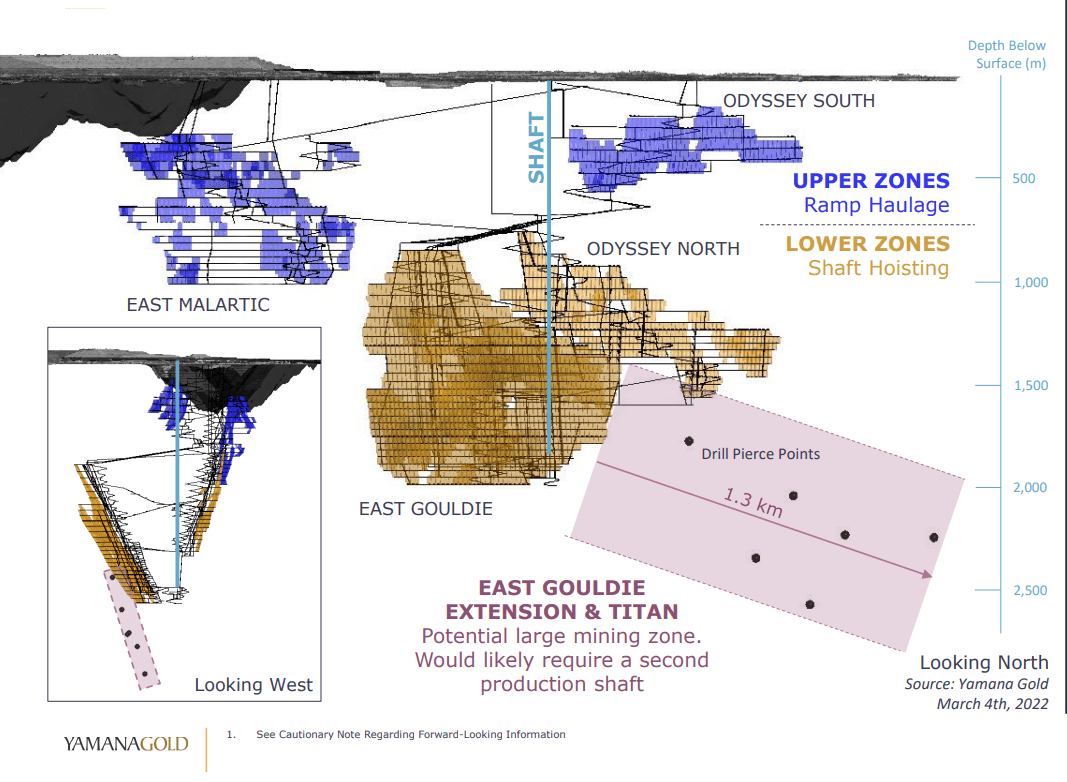
However, in addition to world-class intercepts for an underground operation reported at East Gouldie over the past year (40.9 meters at 4.8 grams per tonne gold, 35.9 meters at 7.1 grams per tonne gold, and 58.5 meters at 3.95 grams per tonne gold) step-out drilling has also been quite encouraging. In fact, the company is defining a significant extension east of East Gouldie, intersecting 10.85 meters at 2.67 grams per tonne gold (1.5 kilometers east of the ore body), 4.81 meters of 6.29 grams per tonne gold, and 9.89 meters at 1.38 grams per tonne gold even further east.
Canadian Malartic – Underground Exploration Results (Yamana Gold Presentation)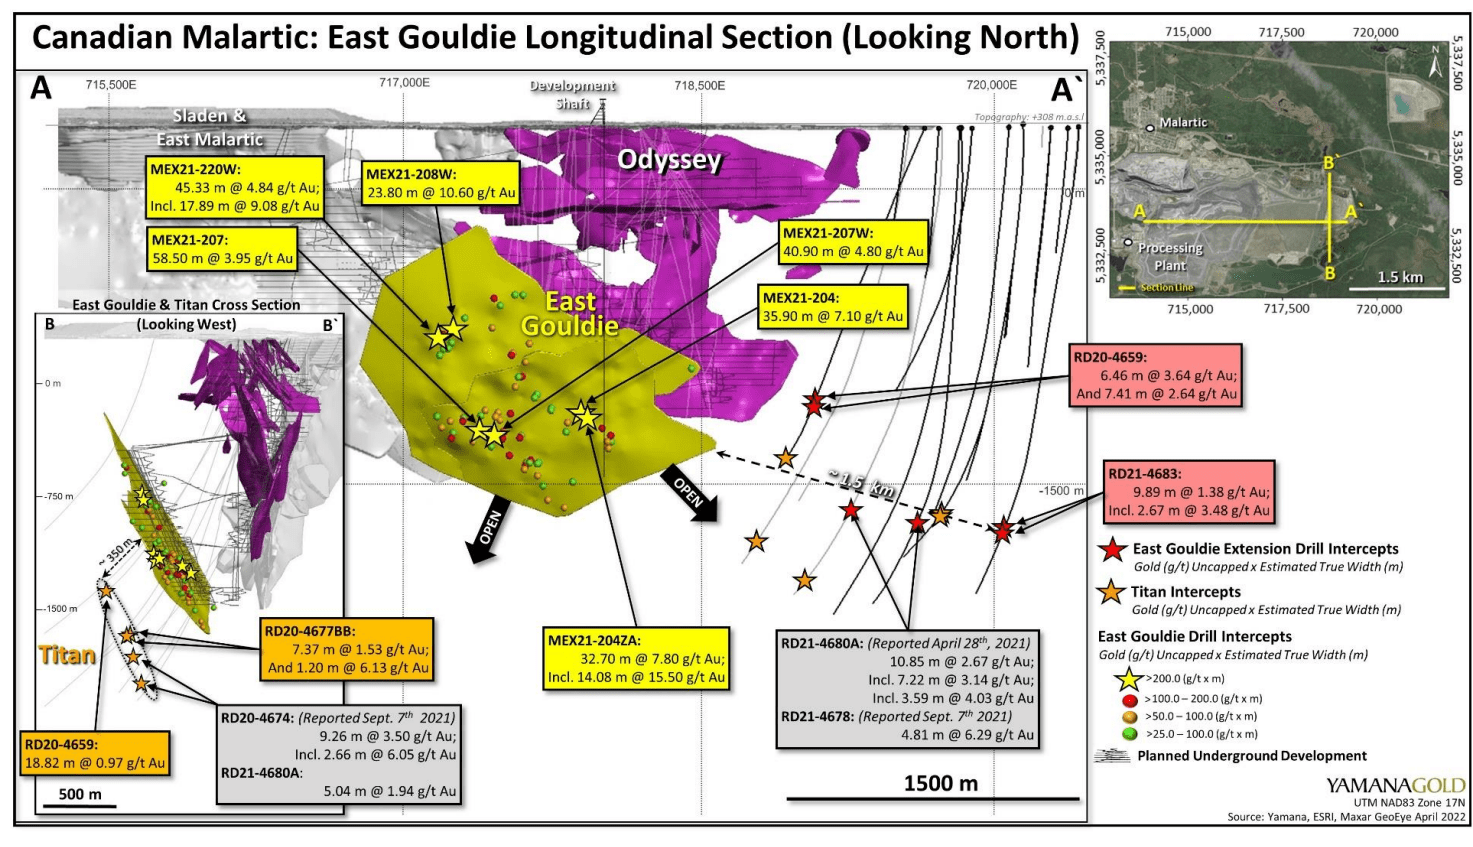
In addition, the company is working to define a new target, Titan, a second mineralized shear zone that is parallel to and approximately 350 meters south of East Gouldie. This continued resource growth, shown above, has the potential to increase the resource base significantly. Assuming the company is successful proving up resources in this extensional drilling and sees continued drilling success, there is a path to 22+ million ounces of underground resources (M&I plus inferred) by 2025, which would give Canadian Malartic a nearly 30-year mine life, even at a 70% conversion ratio based on the projected production profile of ~545,000 ounces per annum (2029-2039).
Previously, there was chatter about the possibility of a second shaft at Canadian Malartic to exploit this significant resource base. However, it wasn’t clear whether this would be discussed formally. However, in Yamana Gold’s (AUY) Investor Day Presentation, it has added this to its long-term growth plan among its “Concept Projects” with a second shaft for the East Gouldie Extension. This would make complete sense to boost the project’s NPV (5%) rather than mine it out over 25+ years, especially given that there’s idle capacity sitting at the mill that lies right next door. This is not a near-term opportunity, but it could be exploited later this decade.
Yamana Gold – Canadian Malartic East Gouldie Extension Concept Study (Yamana Gold Presentation)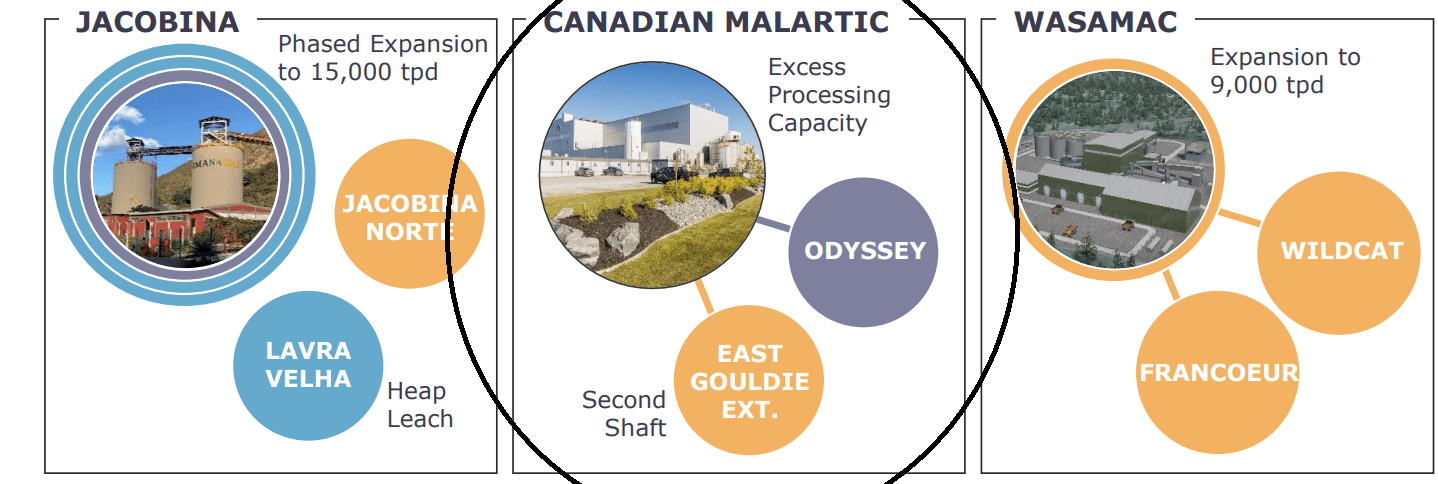
Assuming a second shaft is sunk, capable of feeding an excess 15,000 tonnes per day to the mill, plus additional lower-grade ore sources are exploited on the property (incremental ~5,000 tonnes per day), this would translate to an additional ~390,000 ounces per annum for the production profile at this asset. At an average feed grade of 2.05 grams per tonne gold, this would be an opportunity to add an additional ~450,000 ounces per annum to the ~545,000-ounce production profile. This would make Canadian Malartic a ~1.0 million-ounce producer, increasing Osisko’s attributable production to over 41,000 ounces per annum, assuming an average royalty rate of ~4.50%. To summarize, I don’t see any reason to be negative about the contribution from Canadian Malartic when it comes to Osisko Gold Royalties.
Osisko Gold Royalties – Attributable Production from Canadian Malartic + Upside Case (Author’s Chart & Estimates)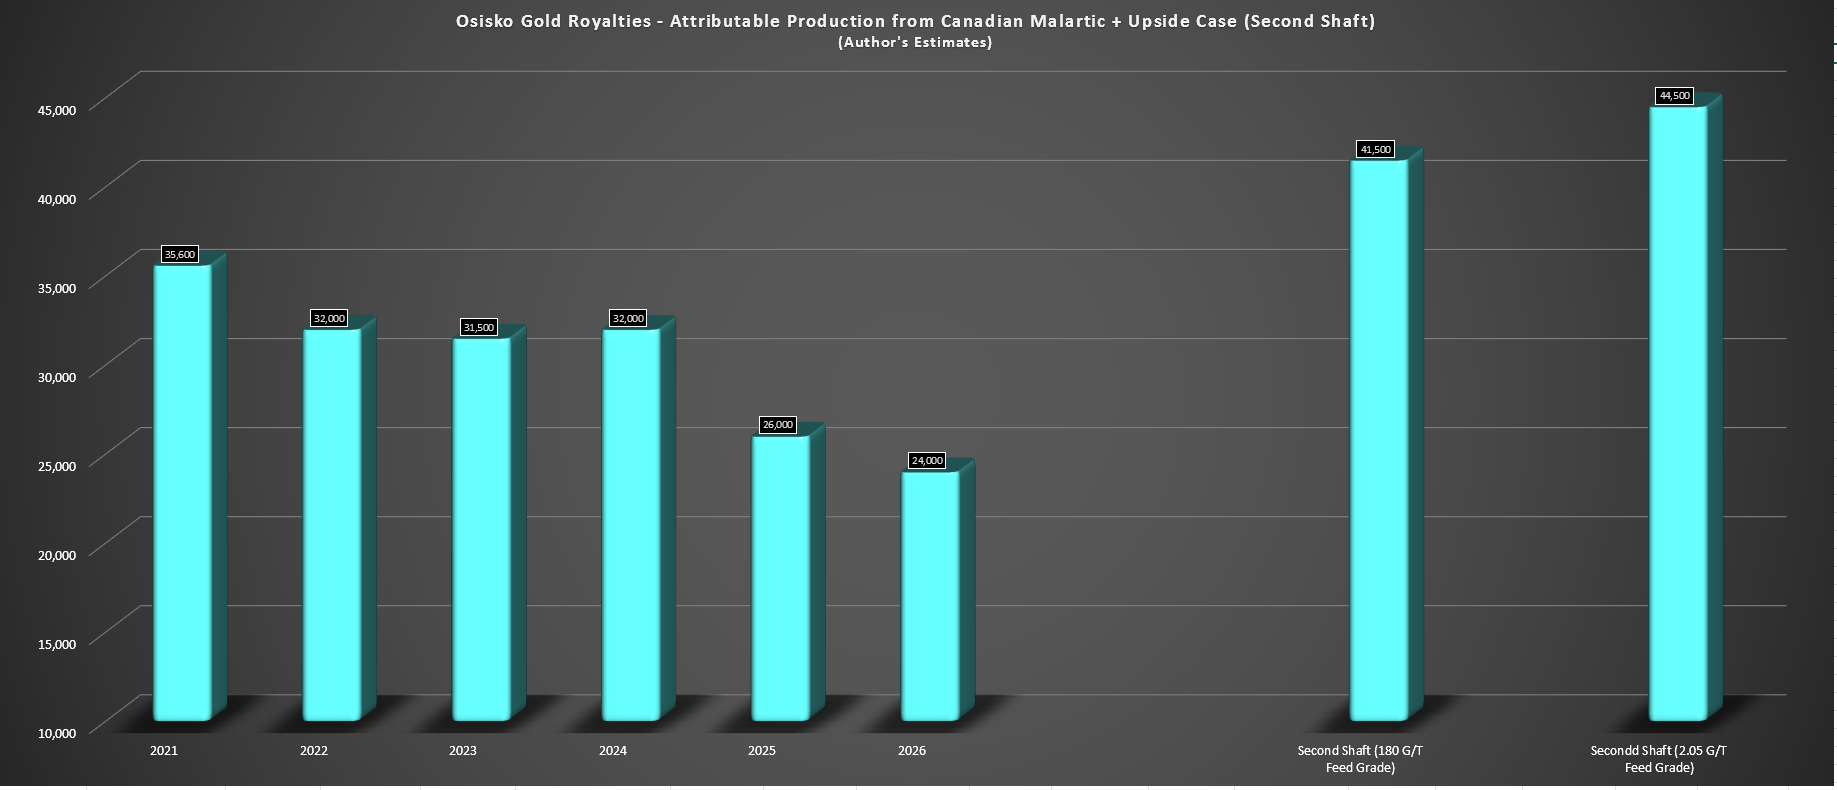
The chart above shows how Osisko’s attributable production profile would change in this scenario, highlighting that production would actually increase more than 20% above FY2021 levels. In the case that grades are higher in the East Gouldie Extension and closer to East Gouldie grades, or if more low-grade opportunities can be exploited on the property (even with a second shaft, there will still be an excess ~8.0 million tonnes per annum of excess capacity at the mill), the attributable production profile for Osisko would be even more significant.
For this reason, I don’t see any reason to count out Canadian Malartic or to suggest that its best days are over. In fact, an operation that is set to operate at ~65% of its former production profile (2029-2039: ~545,000 ounces) utilizing just one-third of the capacity is arguably in its best position ever for future growth. So, while this is conceptual in nature and still an opportunity that is several years away, given that the current focus is on sinking the first shaft, I am confident that the dip in production later this decade can be avoided thanks to these new developments.
Osisko Gold Royalties – Long-Term Growth Profile (Author’s Chart & Estimates)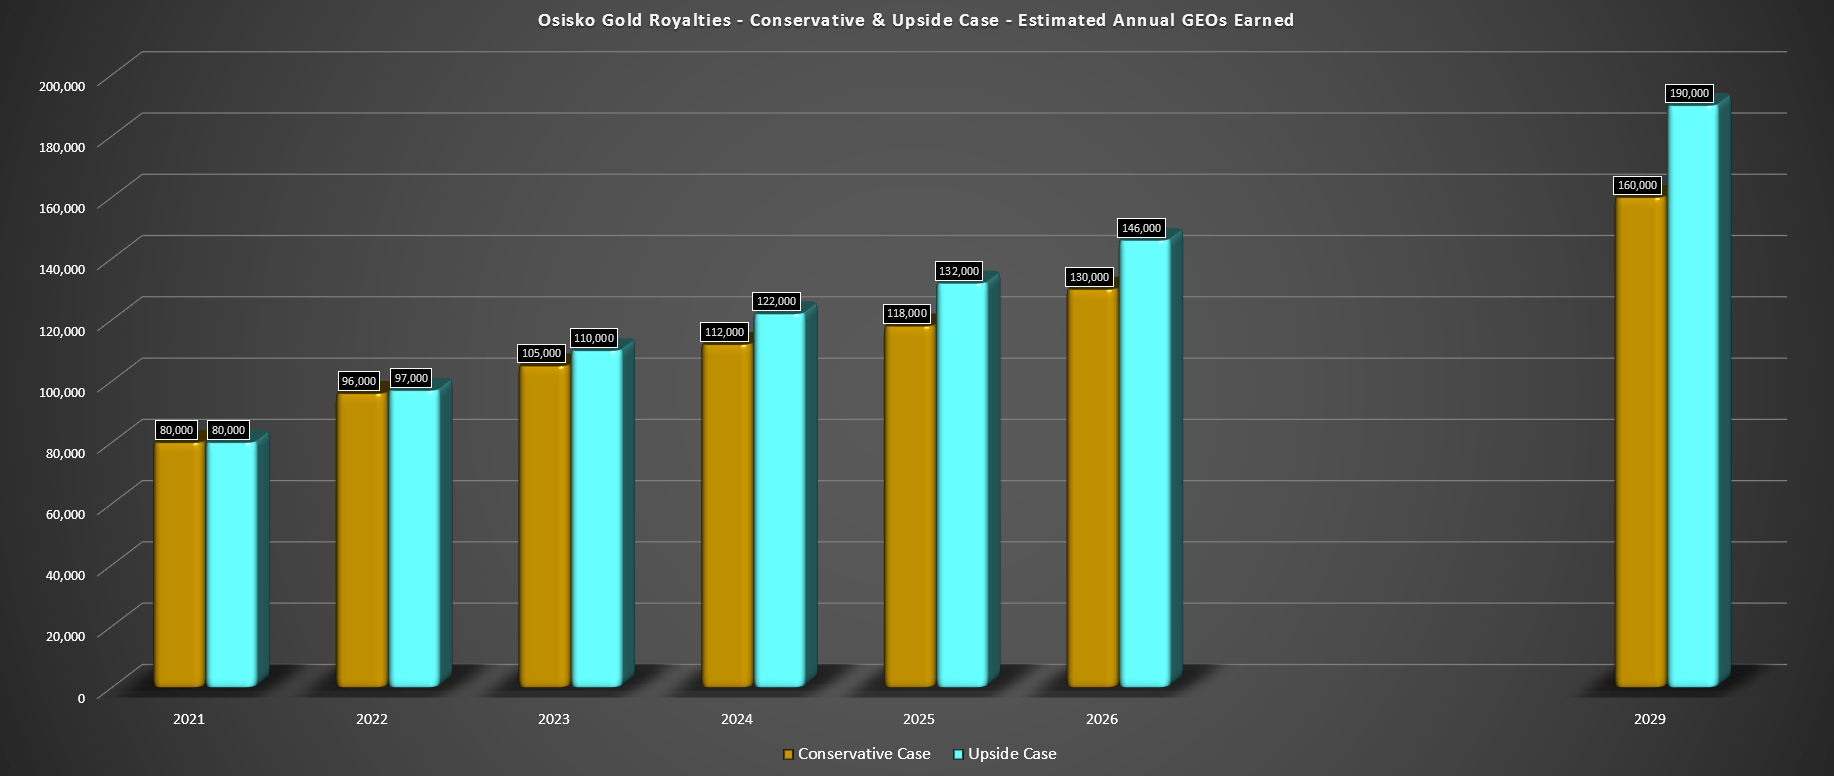
The chart above shows my estimated attributable long-term production profile for Osisko, clearly showing that the slight decline in attributable production from Canadian Malartic will not affect the company’s long-term growth profile. In fact, in the upside case in 2029, which includes optionality projects, there is the possibility that Osisko would see attributable production grow by more than 135% from FY2021 levels (~80,000 GEOs —-> ~190,000 GEOs), giving it one of the highest growth profiles sector-wide. Notably, this growth is expected to come from multiple assets, so this is not a lumpy growth profile like that of Sandstorm (SAND), relying on mainly one asset (Hod Maden) in a less favorable jurisdiction (Turkey) to catapult itself above the 100,000 GEO per annum mark.
Other Developments
Outside of Canadian Malartic, there were some positive developments among earlier-stage assets. This included an increase in the resource base at Shanta’s West Kenya Project, which covers over 1,100 square kilometers in the highly prospective Lake Victoria greenstone goldfield in western Kenya. The total resources at the project have increased to ~1.55 million ounces of gold from ~1.18 million ounces at the time of the acquisition. Notably, the grades at the West Kenya Project are well above the industry average at 6.18 grams per tonne of gold, with an average grade above 10.50 grams per tonne of gold in the Liranda region.
West Kenya Project Resources (Shanta Gold Presentation)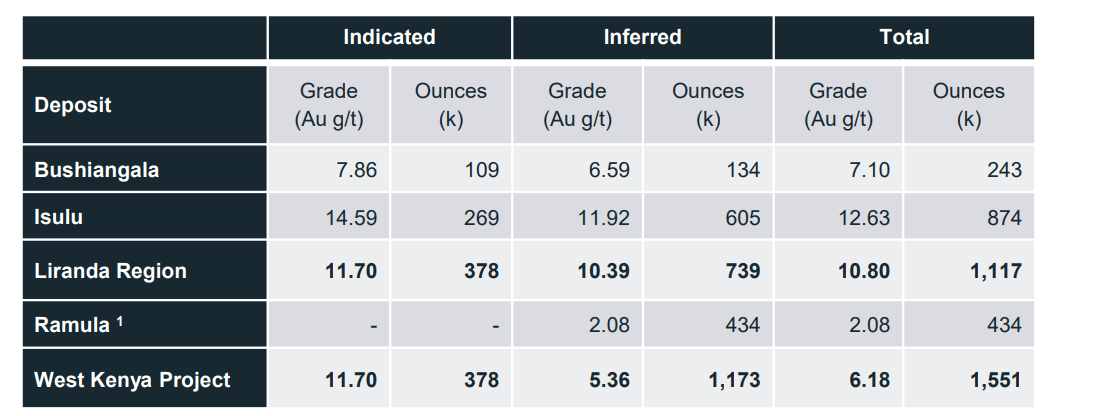
The next key milestone for the West Kenya Project will be the commencement of a Feasibility Study later this year. Based on the Scoping Study already completed on the project, the study envisioned open-pit mining followed by underground mining, with average annual gold production of ~105,000 ounces per annum at sub $700/oz all-in sustaining costs. Assuming a similar production profile with a longer mine life, this asset could potentially contribute to Osisko’s attributable ounces by 2026, translating to ~2,000 GEOs per annum in incremental growth.
West Kenya Project Resource Outline (Shanta Gold Presentation)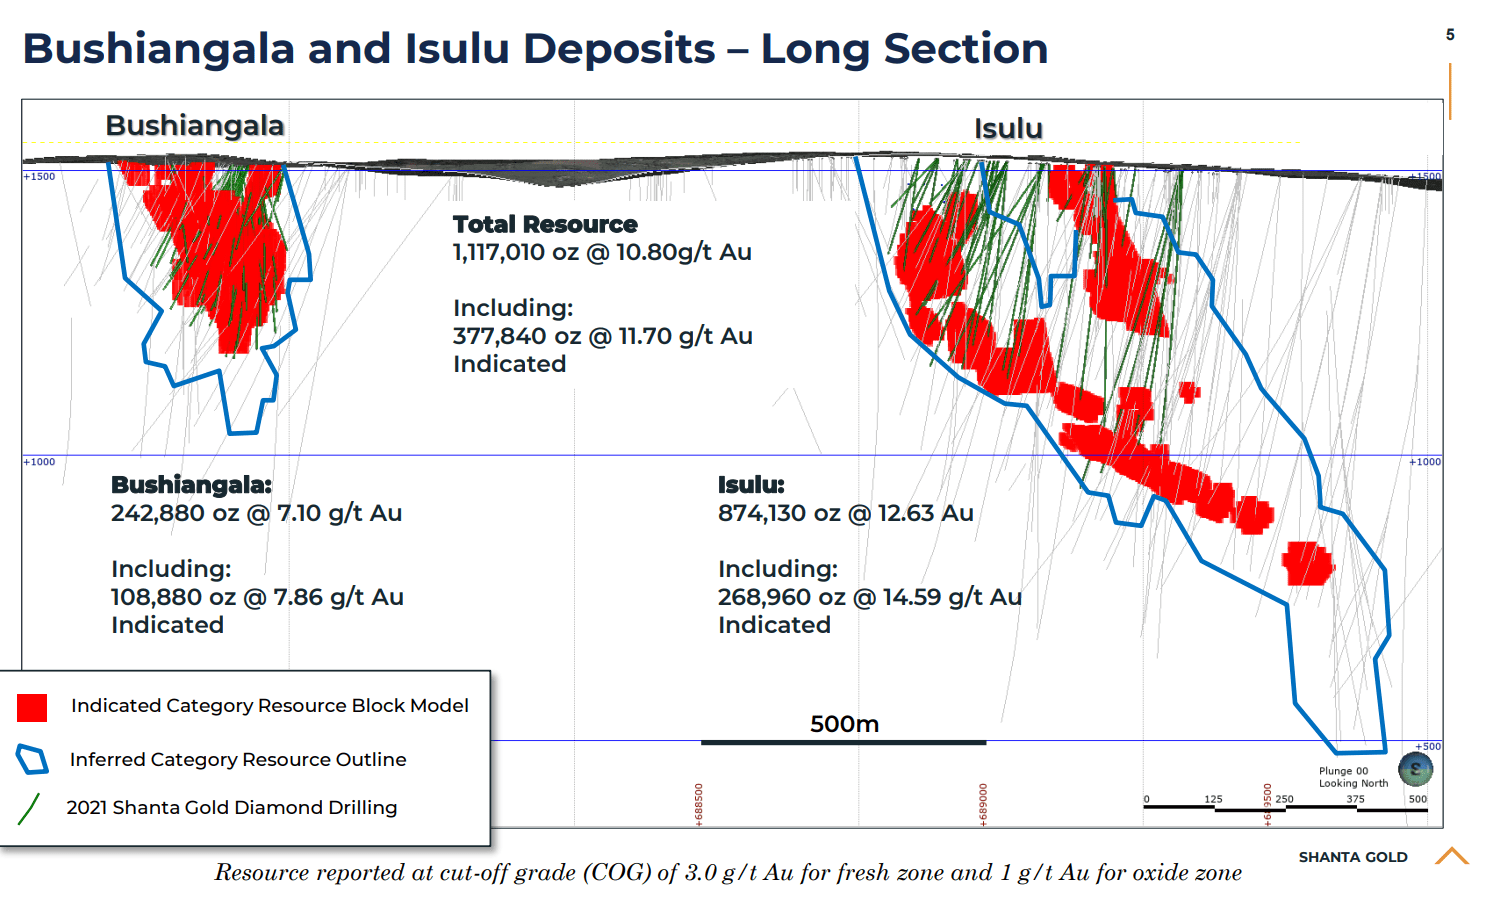
While nowhere as significant as developments at much larger assets, one of Osisko’s partners, Westhaven (OTCPK:WTHVF) did see a solid result from its Shovelnose Property in British Columbia recently. For those that missed it, the company reported ~23 meters at 39.8 grams per tonne gold-equivalent from the FMN Zone, one of the best intercepts drilled year-to-date sector-wide. This is another optionality opportunity, with Shovelnose unlikely to head into production before H2 2026.
Shovelnose Property Drill Intercepts + Current Resource Base (Westhaven Company Presentation)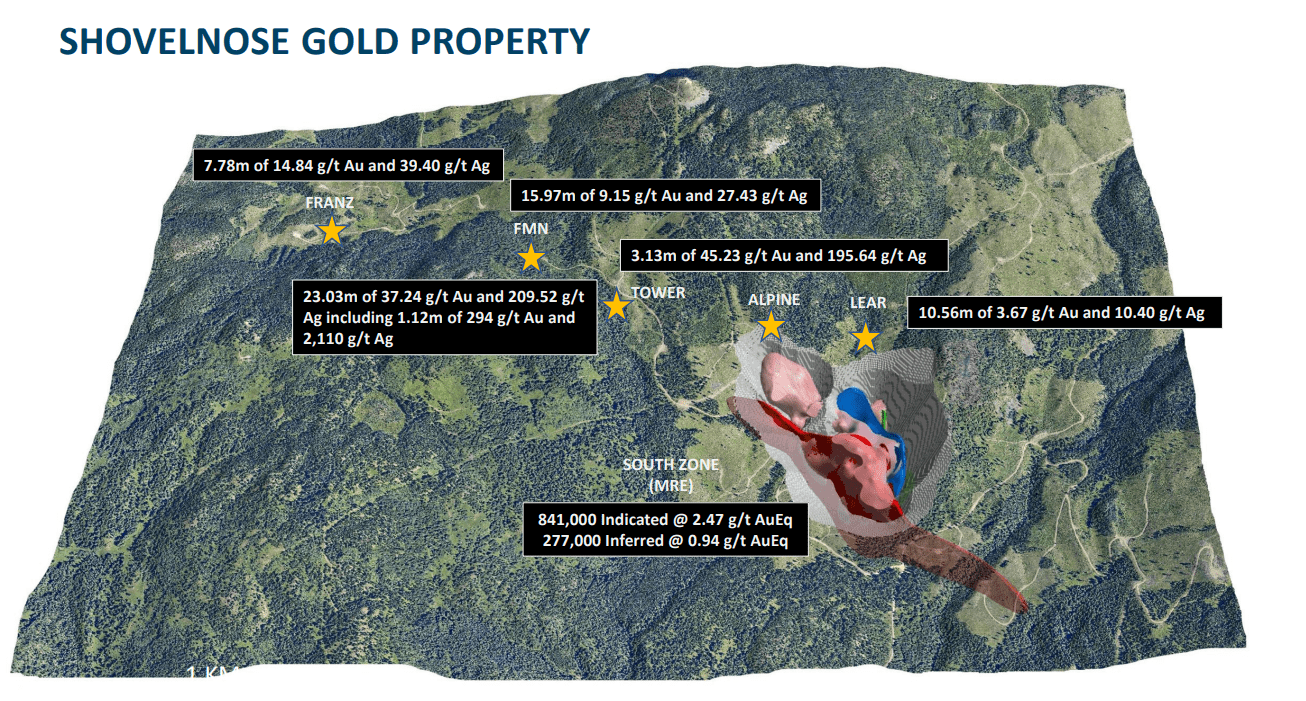
However, in the event of a production decision, it could add upwards of 2,700 GEOs per annum based on Osisko’s 2% NSR royalty at Shovelnose. This may not seem that significant, but several of these smaller opportunities do add up. The nice thing is that many of them are in Tier-1 jurisdictions, allowing Osisko to maintain its Tier-1 jurisdiction focus relative to peers. As it stands, Shovelnose is home to ~1.12 million ounces of gold, with more than 70% of the ounces in the indicated category (2.47 grams per tonne gold-equivalent), a respectable resource base.
As the chart below shows, Shovelnose’s recent drill result was a top-10 intercept (gram-meter standpoint) sector-wide for open-pit projects/mines in the past two years.
Best Drill Intercepts Since Q4 2019 – Grams Per Tonne Gold x Interval Thickness (Company Filings, Author’s Chart)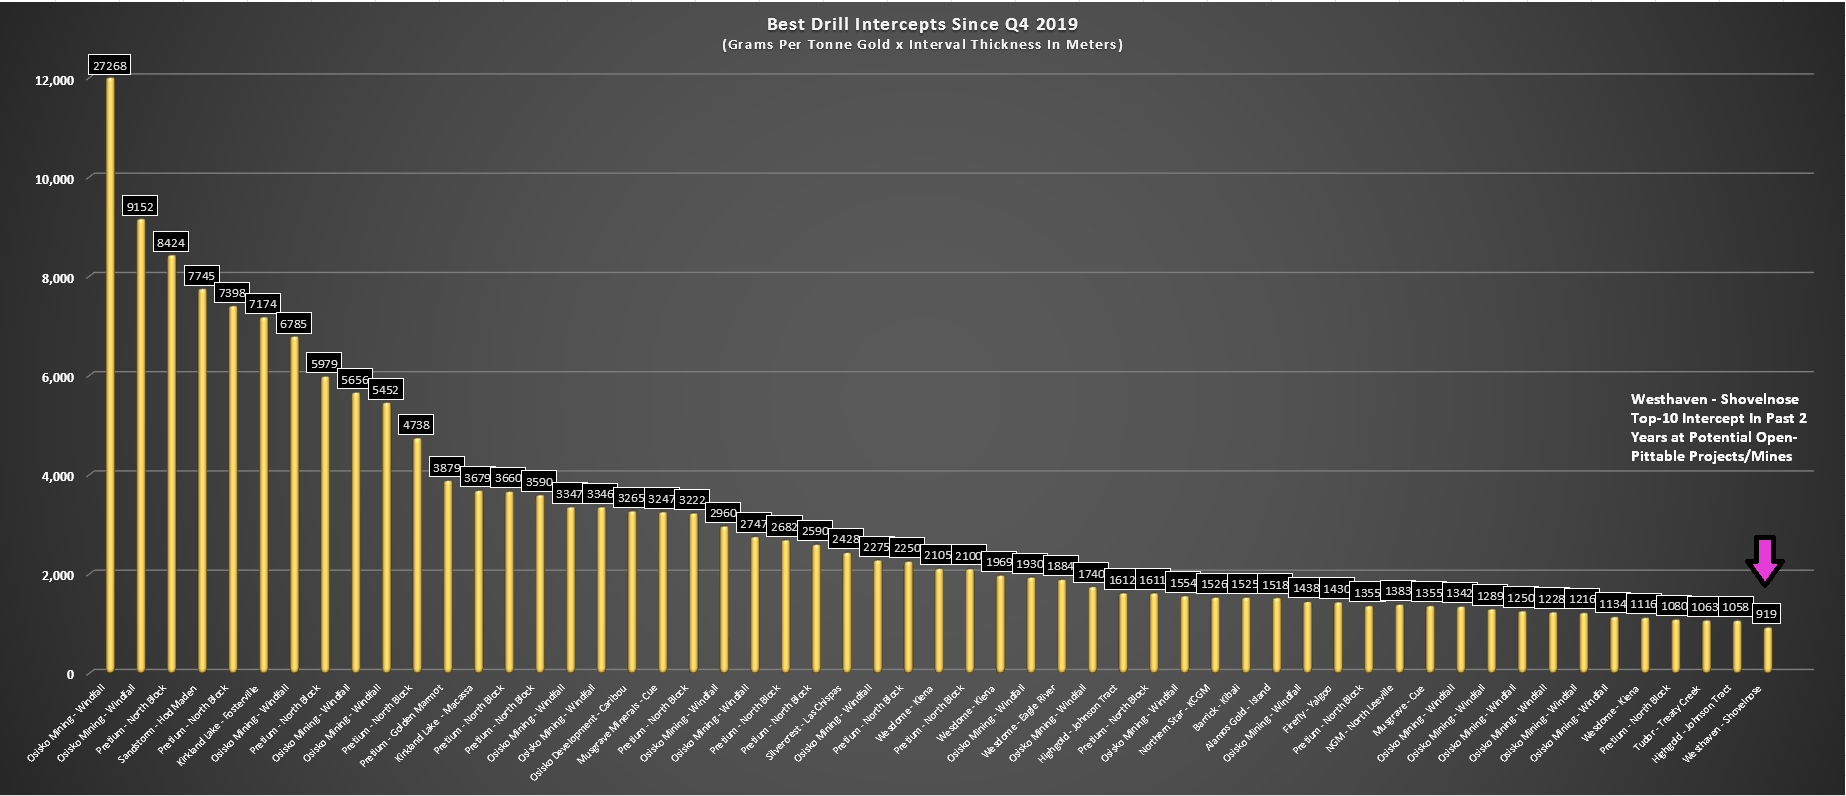
Finally, at one of Osisko Gold Royalties’ key pillars for growth, the Windfall deposit in Quebec, Osisko Mining (OTCPK:OBNNF) continues to release blockbuster results. It also recently announced that it has entered into a memorandum of understanding with the Cree First Nation of Waswanipi [“CFNW”] to transport hydroelectric power to the Windfall Project. The CFNW will finance, build, own and operate a 120-kilovolt transmission line to supply hydroelectricity to Windfall. This has de-risked the path to production and should improve upfront capex for the project.
Windfall Mineralization – (Osisko GR 2-3% NSR Royalty) (Osisko Mining Presentation)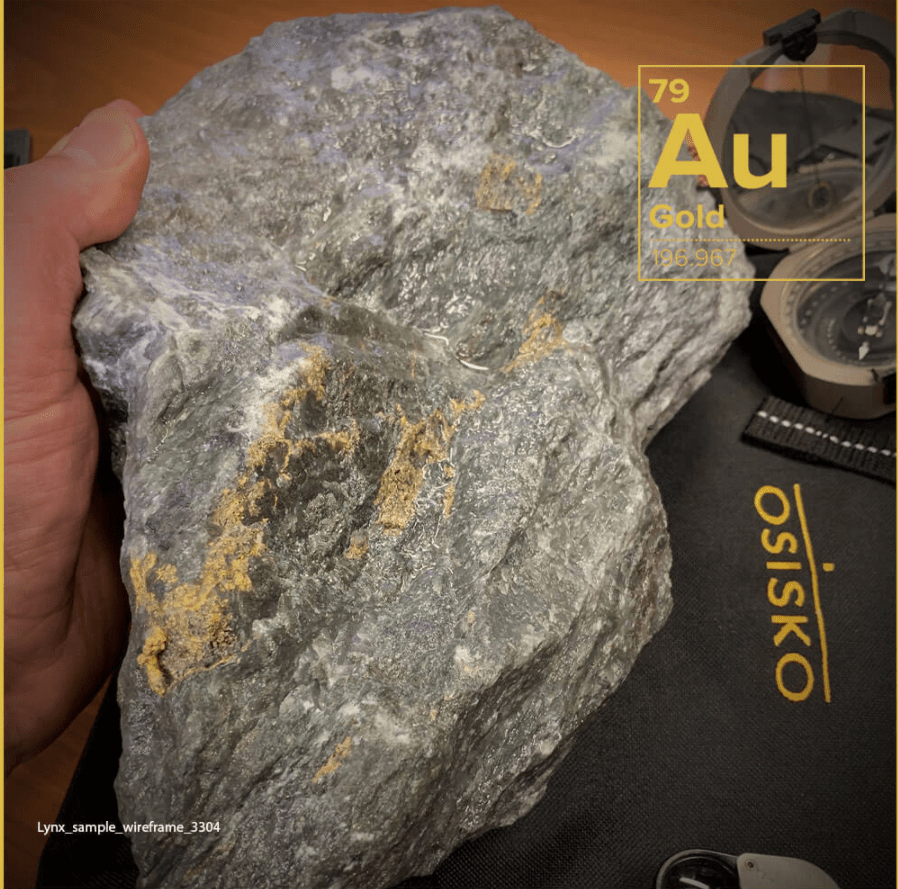
As it stands, Windfall is one of the largest and highest-grade gold deposits in a Tier-1 jurisdiction (~6.8 million ounces of gold at 9+ grams per tonne gold), which places Osisko Gold Royalties in an enviable position holding a 2-3% NSR royalty on the project. However, this resource does not like regional targets like Fox, Fox West, Thunderdog, and Golden Bear, suggesting the potential for this resource base to grow north of 10+ million ounces by 2025 and potentially support a higher production rate.
Assuming production by 2025, this will add 5,000 GEOs per annum to the Osisko Gold Royalties’ attributable production profile, with upside to ~7,000 GEOs from a higher processing rate, and or positive grade reconciliation. Some highlight drill intercepts reported since the resource update at Windfall are as follows:
- 6.2 meters at 120 grams per tonne gold
- 9.0 meters at 41.4 grams per tonne gold
- 4.7 meters at 431 grams per tonne gold
- 5.4 meters at 187 grams per tonne gold
- 6.6 meters at 103 grams per tonne gold
- 7.4 meters at 65.6 grams per tonne gold
- 2.3 meters at 449 grams per tonne gold
- 6.9 meters at 56.5 grams per tonne gold
Valuation
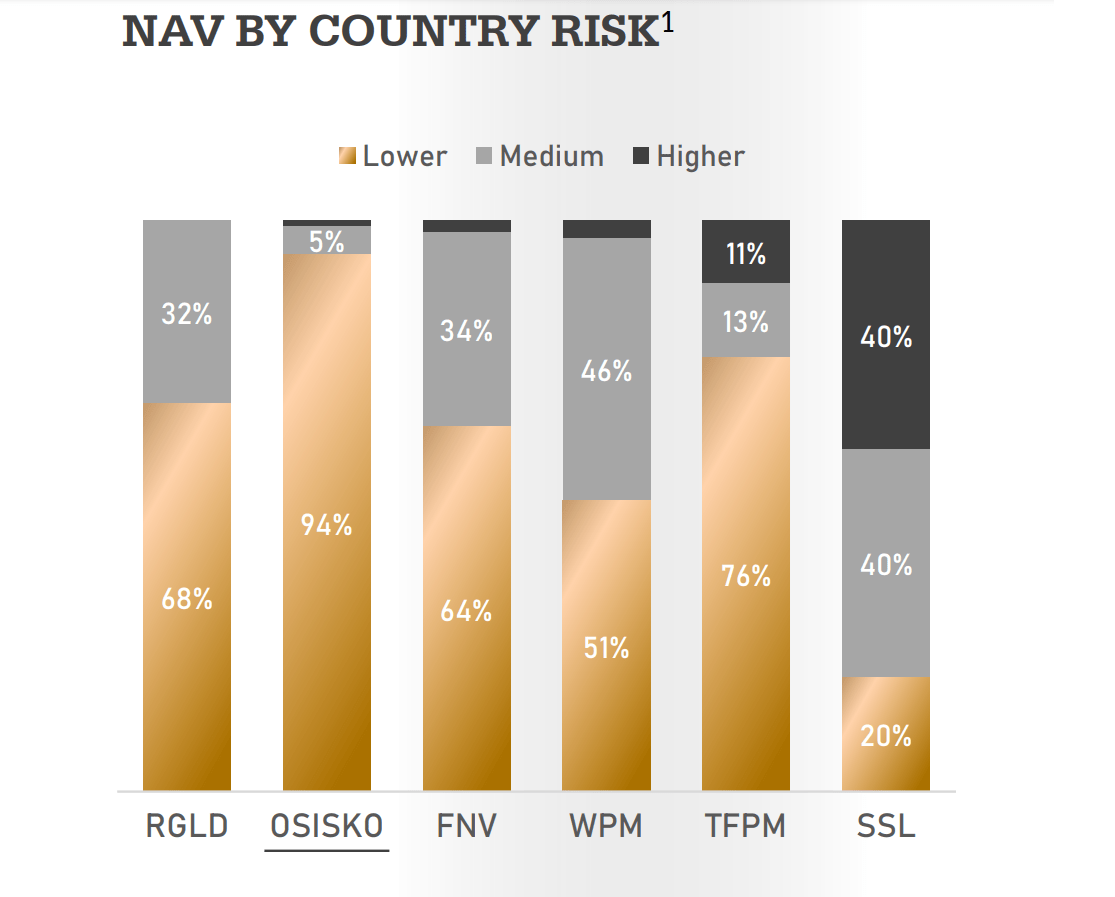
While several producers and royalty/streaming companies are extended from their recent bases and now trading closer to fair value, Osisko continues to be a massive outlier. This is based on the fact that the company currently trades at just over 1.5x P/NAV vs. peers like Sandstorm Gold (SAND) and Triple Flag (OTCPK:TRFPF) at roughly 1.50x P/NAV. Given that Osisko has a superior growth profile to these companies and a more attractive jurisdiction profile, with 94% of net asset value at a lower country risk vs. Sandstorm at 20% and Triple Flag at 76%, it should arguably trade at a similar or higher multiple.
Royalty/Streaming Companies – Long-Term Production Forecast (Sandstorm Gold Company Presentation, Author’s Charts & Drawings Added to Chart) NAV by Country Risk – Peer Group (Company Presentation)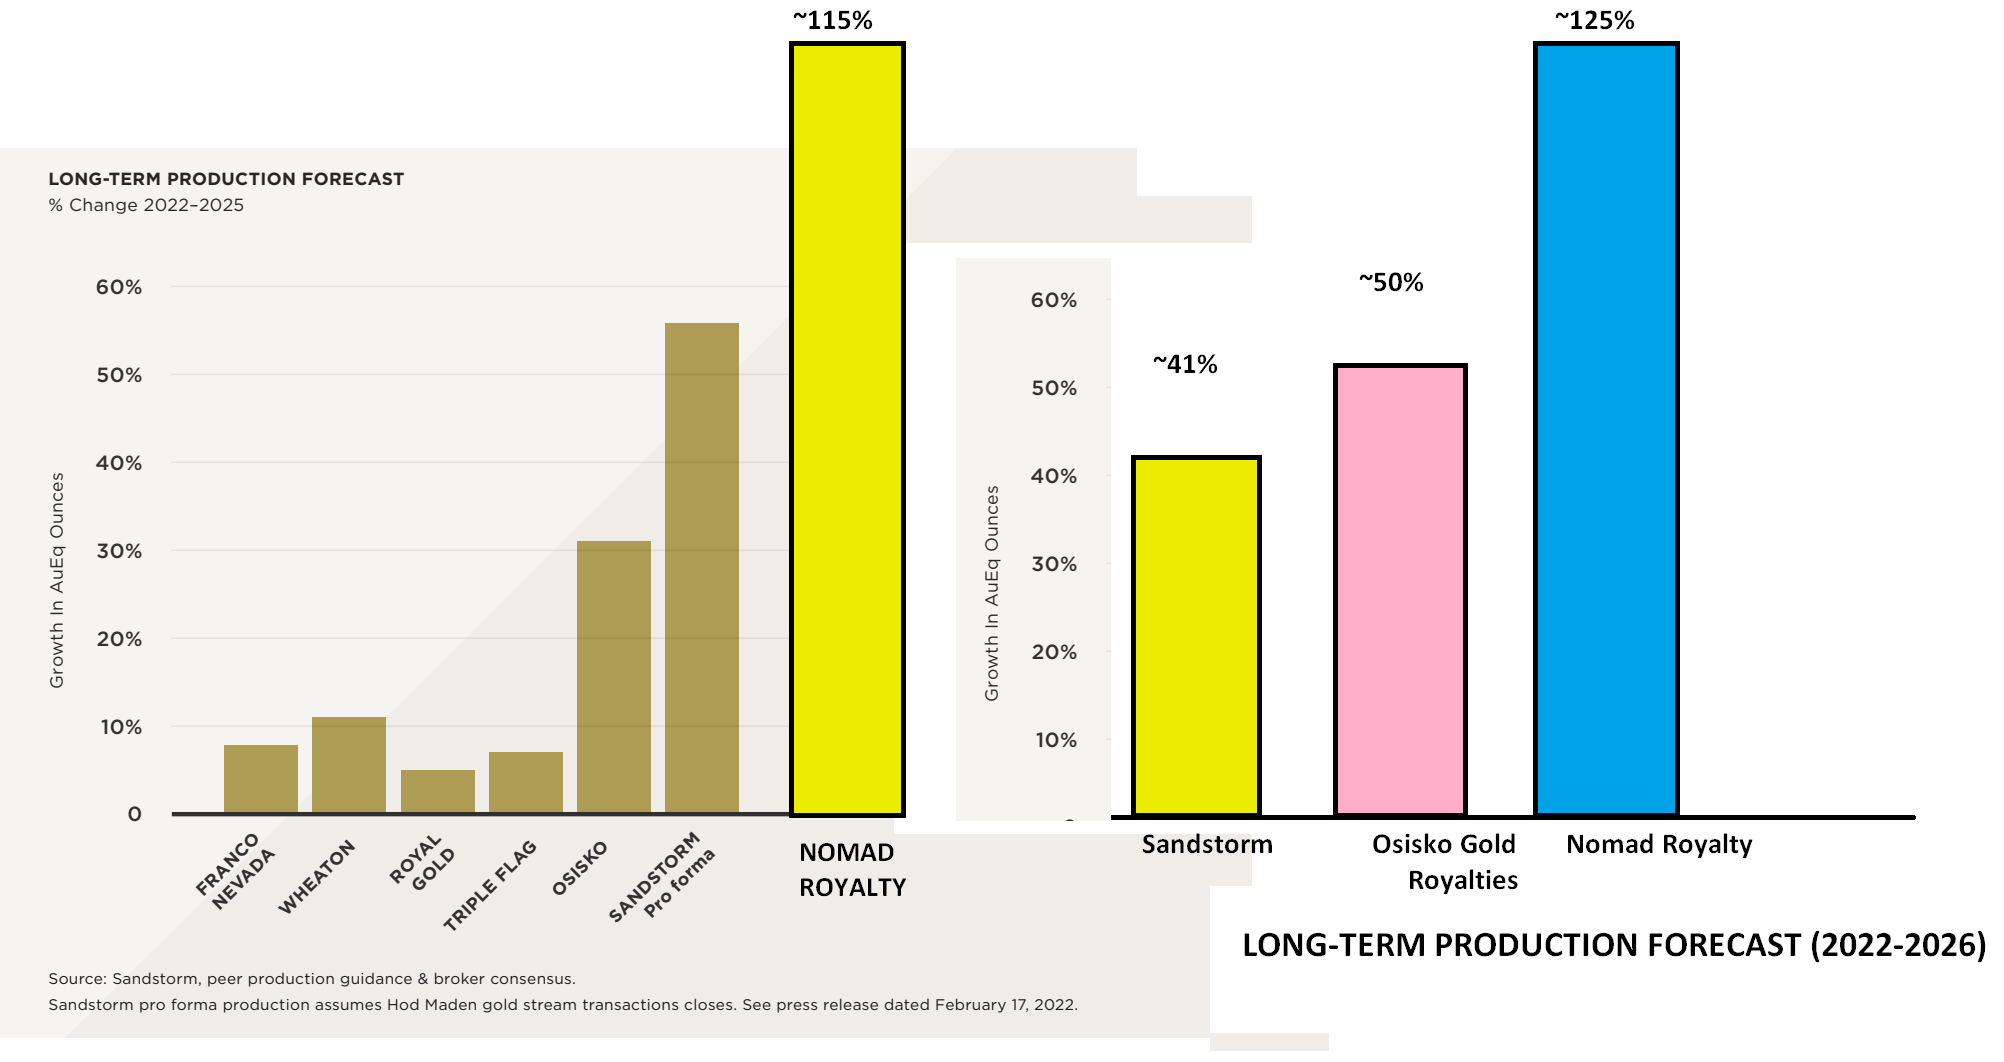
If Osisko Gold Royalties were to trade in line with Triple Flag and Sandstorm’s P/NAV multiples today, the stock would trade at ~$19.50 per share, representing a 40% upside from current levels. So, given this short-term disconnect, I continue to favor Osisko Gold Royalties over all other royalty streaming peers in the ~50,000+ GEO per annum space. The bonus is that the stock has a much more attractive dividend yield than its peer group (0.90% average), currently paying out 1.30% at current levels.
Technical Picture
From a technical standpoint, there’s also a lot to like about Osisko, with the stock poking its head up above the top of a multi-year base. Assuming the stock can close above US$13.70 in Q2, this would increase the probability of a breakout, and bases of this size typically lead to lengthy and outsized moves. In fact, we saw a similar-sized base breakout for Perseus Mining (OTCPK:PMNXF) in late 2019, and the stock has since marched higher, gaining more than 180% in just over two years from its breakout level.
OR Quarterly Chart (TC2000.com) PMNXF Quarterly Chart (TC2000.com)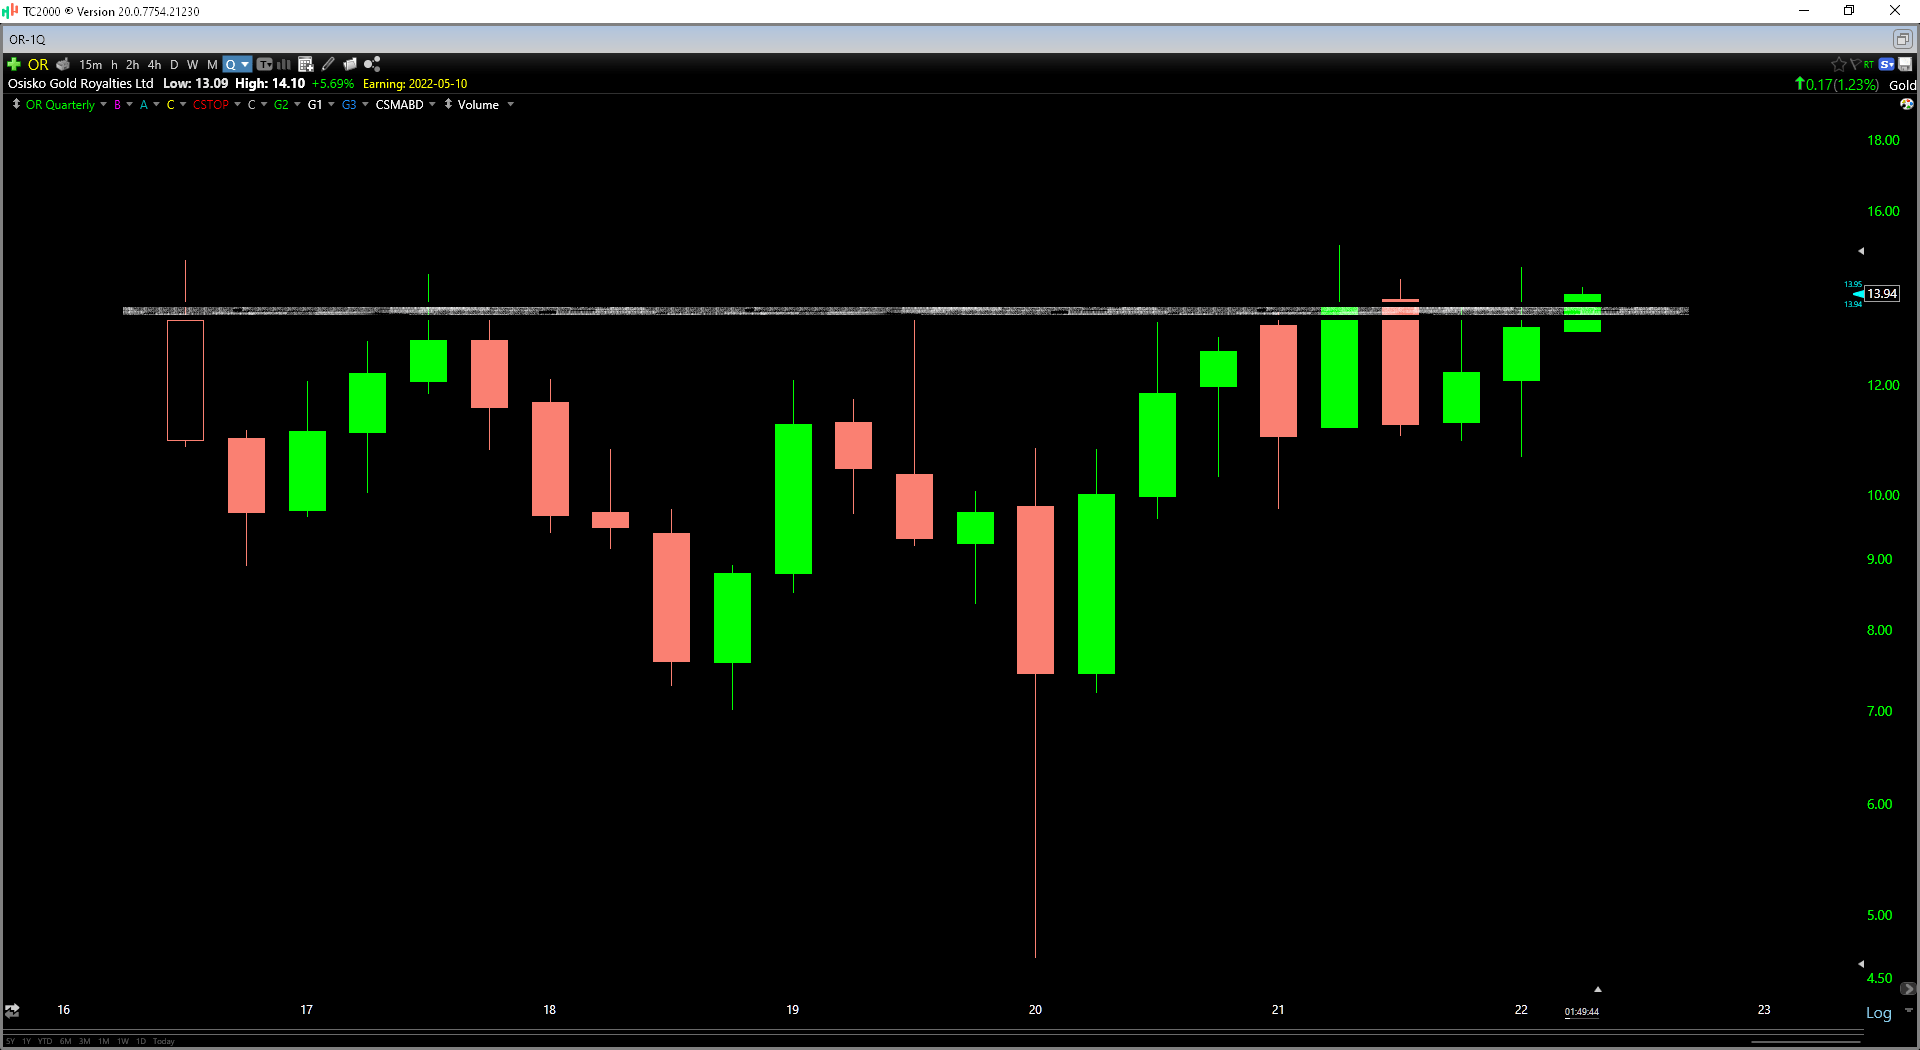
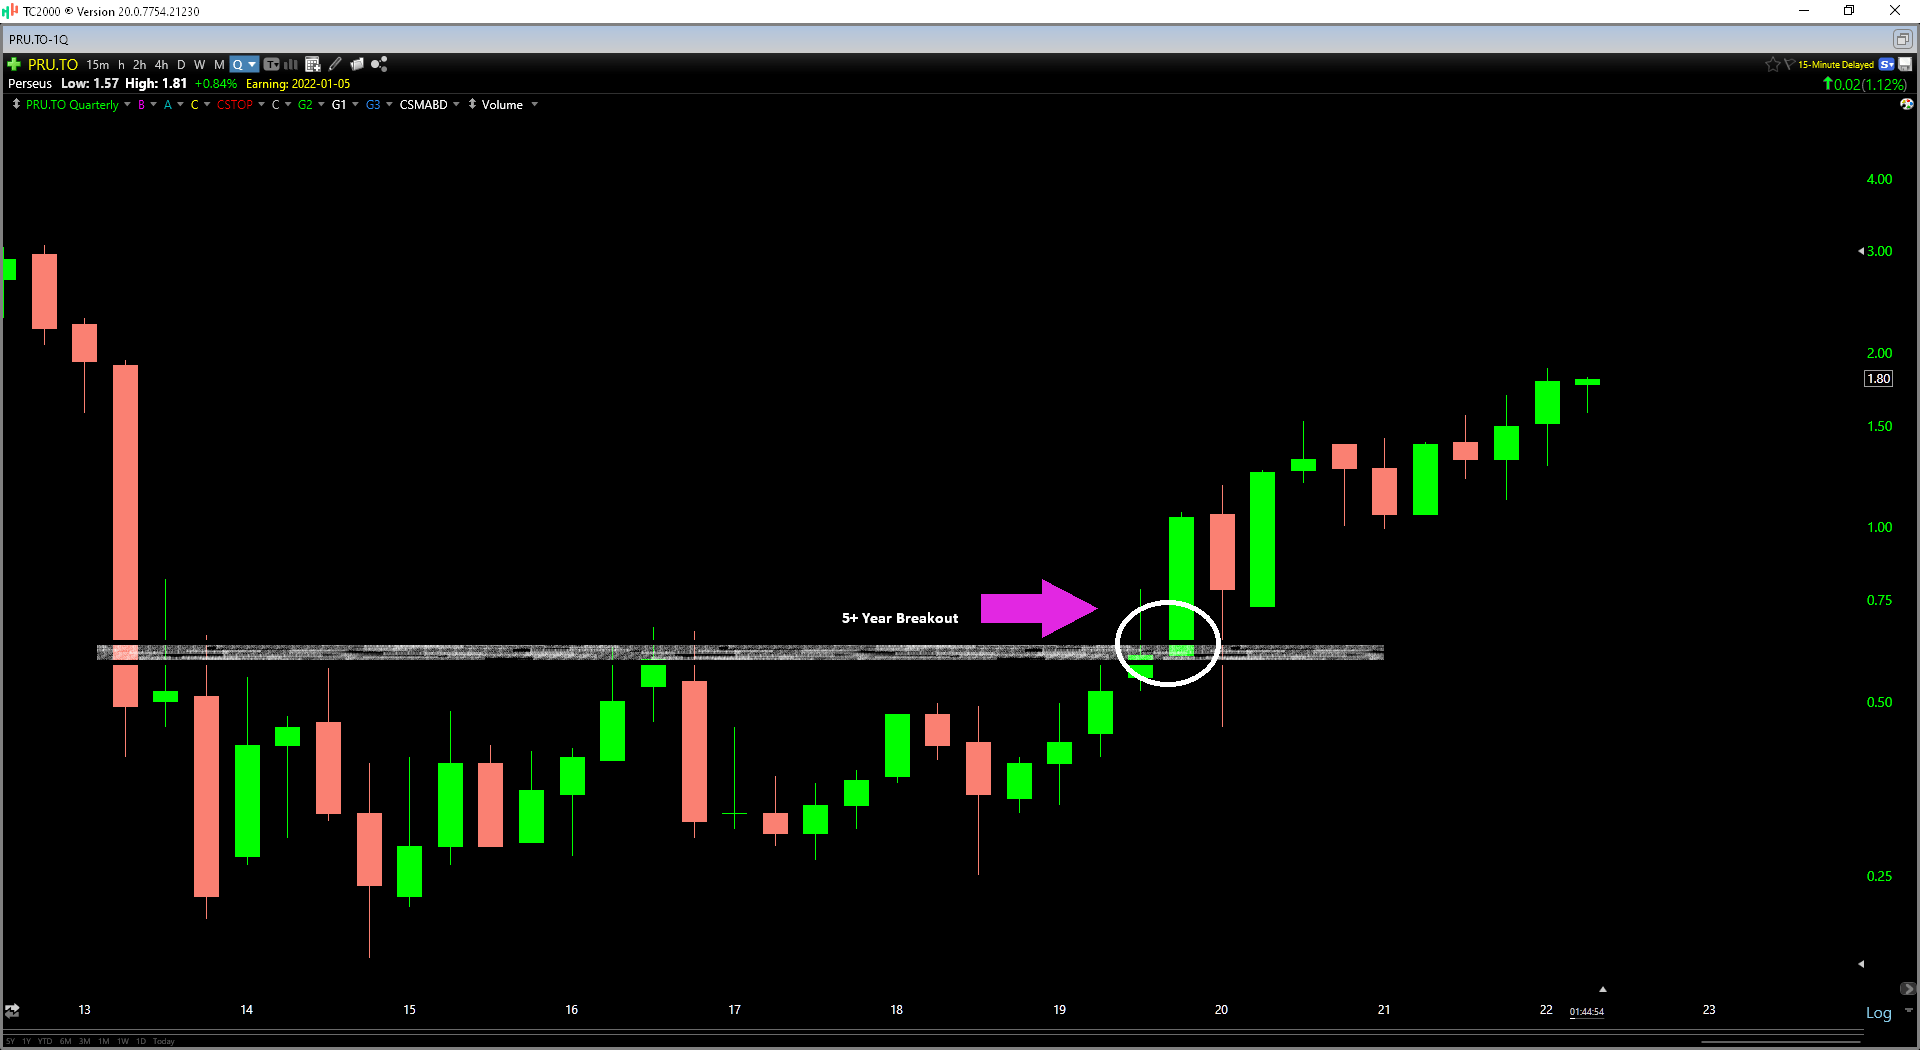
While I would not expect to see a similar move in Osisko Gold Royalties due to the difference in market caps, a breakout from this range would be a very bullish development, with the first technical target coming in near $20.00 per share. So, with Osisko being one of the few gold names that are building a 5+ year base and working on a quarterly breakout to new multi-year highs currently, the technical setup certainly corroborates the attractive fundamental outlook.
In fact, we often see stocks breakout ahead of major fundamental developments, with the market looking 12-18 months ahead at what a company might look like in the future. In Osisko’s case, the catalyst for a breakout is the company’s industry-leading growth rate among the 50,000+ ounce per year royalty/streaming companies, which will translate to significant growth in earnings and cash flow between now and 2024. To summarize, I remain bullish on Osisko, and I would not be surprised to see the stock trade much higher in the next 12 months.
Gold Producers – Cash Costs & All-in Sustaining Cost Progression (2019-2022 Estimates) (Company Filings, Author’s Chart)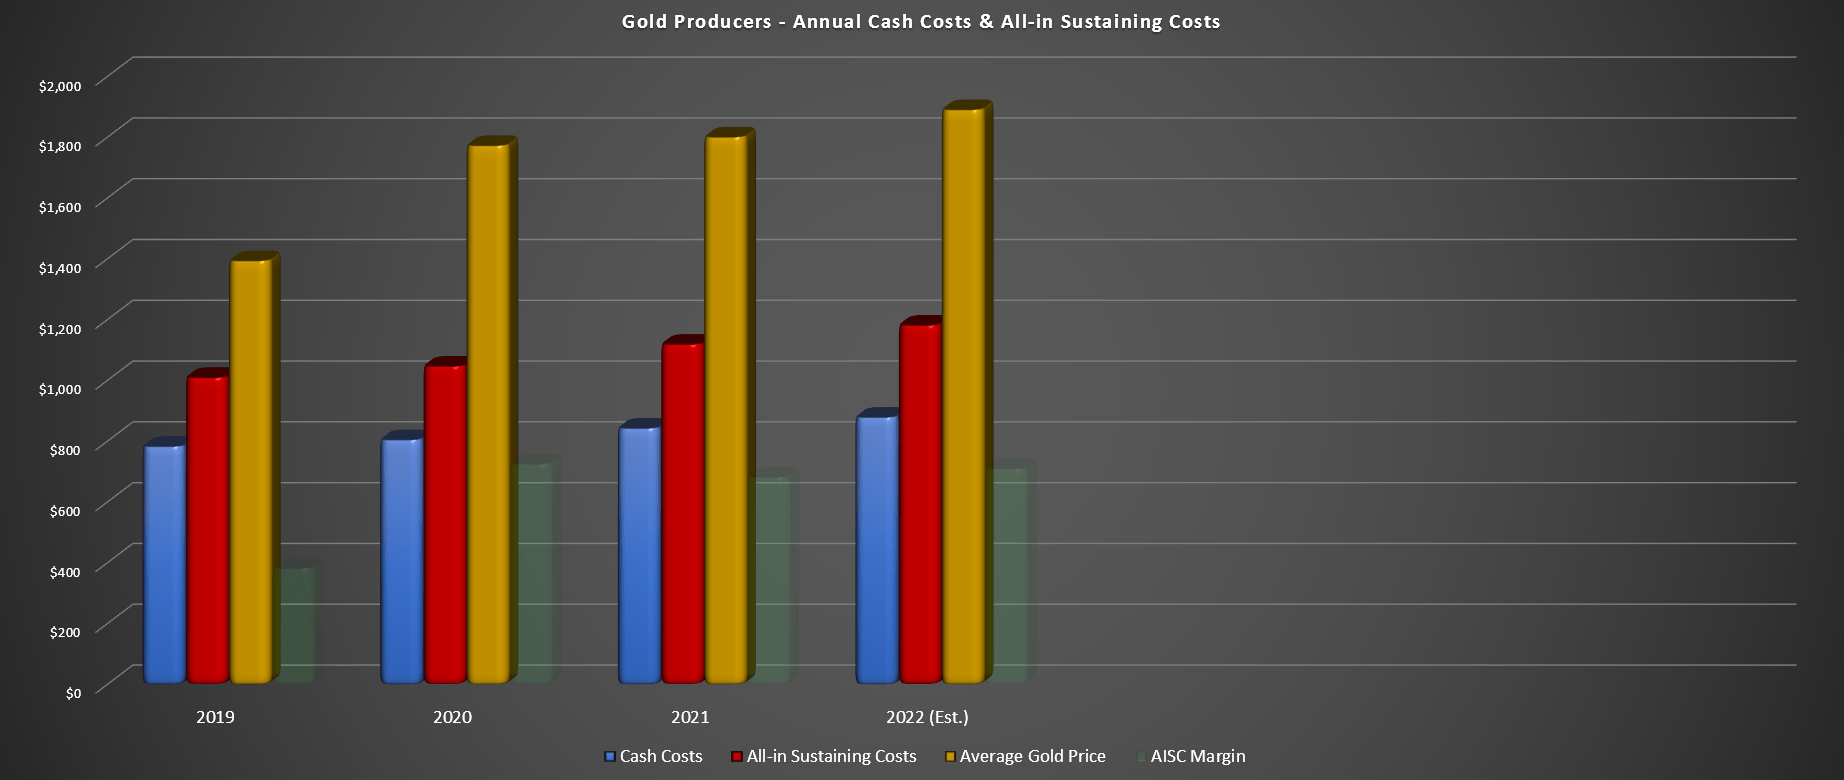
In a sector where inflationary pressures are taking a toll on many producers, royalty/streaming companies are a staple when it comes to a portion of one’s precious metals allocation. However, with many names trading at between 1.50x – 2.50x P/NAV, the benefit of the lower-risk business model (capex/operating cost insulation) is offset by the risk of paying a massive premium to NAV. However, Osisko Gold Royalties is a rare case of growth at a very reasonable price. Hence, I see this period of underperformance as a buying opportunity.
Be the first to comment