


photoman/E+ via Getty Images
Price Action Thesis
We follow up on our post-earnings update on Unity Software Inc. (NYSE:U) with a detailed price action analysis. We now have a clearer view of its near-term support and resistance levels after the steep sell-off that sent U stock to its recent bottom. We urged investors not to sell into the panic sell-off, as the stock recovered about 20% since we published.
However, we revised our rating from Buy to Hold in our previous article, as we emphasized that U stock could be in the penalty box for a while, given its ad tech challenges.
Notwithstanding, we realized that we should not have turned bullish on U stock in 2022 from our previous Hold rating. We underestimated the menace from its double top bull trap in November 2021 as the market digested its metaverse hype gains. Notably, we have not observed a double bottom bear trap that could help turn around its bearish bias.
Our valuation analysis suggests that the market is justified in slashing U stock valuations, as its free cash flow (FCF) profitability remains questionable.
Therefore, we reiterate our Hold rating on U stock. However, investors looking to rotate out of U stock can use the current opportunity to cut exposure. Otherwise, investors can wait to cut exposure if it rallies toward its near-term resistance.
Ignored The Double Top Bull Trap And Got Punished
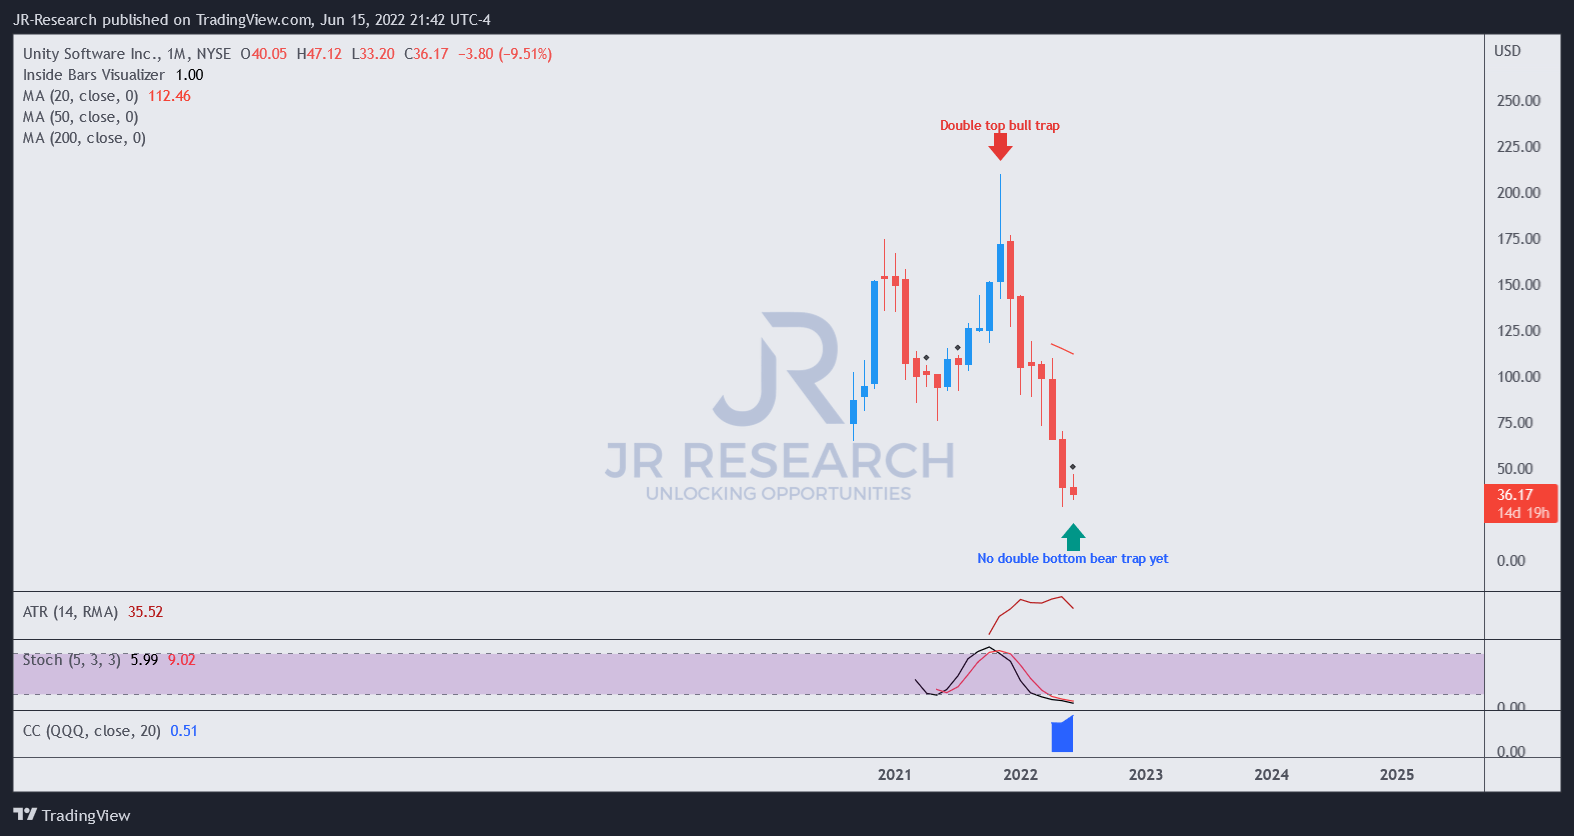
U price chart (monthly) (TradingView)
Investors are reminded to pay significant attention to double top bull traps like the one we saw in U stock in November, as seen above. We also realized such pitfalls in several metaverse-related plays such as NVIDIA (NVDA), Roblox (RBLX), and Matterport (MTTR). The market drew in the metaverse hype astutely and rapidly before setting up the bull trap for their eventual collapse.
As a result, investors should not be stunned by the calamitous fall in U stock before reaching its near-term bottom post-FQ1 earnings. But, we must emphasize that the market has already set the stage for its downfall since November 2021.

U price chart (weekly) (TradingView)
Poring deeper into its weekly chart, we can discern its double top more clearly. Those momentum spikes leading into the trap are noticeable, which is the market’s early warning sign for investors. So, we should not ignore such signals in the future.
Notably, the series of bull traps in February and April validated the market’s intentions to send U stock into negative flow (decisive bearish momentum). Moreover, such bull traps accentuated the market’s intentions to draw in dip buyers before forcing subsequent sell-offs.
Therefore, the collapse toward its post-FQ1 bottom has been brewing for six months, allowing astute U holders to bail out before the capitulation move.
Notwithstanding, U stock is at its near-term support, as it consolidated over the past four weeks. However, a recent attempt last week to retake its near-term resistance was rejected convincingly, forcing it back into its consolidation zone.
Given the dominant bearish bias, we are keen to look for a double bottom bear trap that can provide early signals of a sustained bottom, leading to a trend reversal. However, that price action signal remains elusive, as the market is aptly still tentative over U stock after the mayhem.
But Why? Look At Its Steep Valuation
| Stock | U |
| Current market cap | $10.71B |
| Hurdle rate (CAGR) | 25% |
| Projection through | FQ2’26 |
| Required FCF yield in FQ2’26 | 2.5% |
| Assumed FCF margin in FQ2’26 | 1.5% |
| Implied TTM revenue by FQ2’26 | $43.57B |
U stock reverse cash flow valuation model. Data source: S&P Cap IQ, author
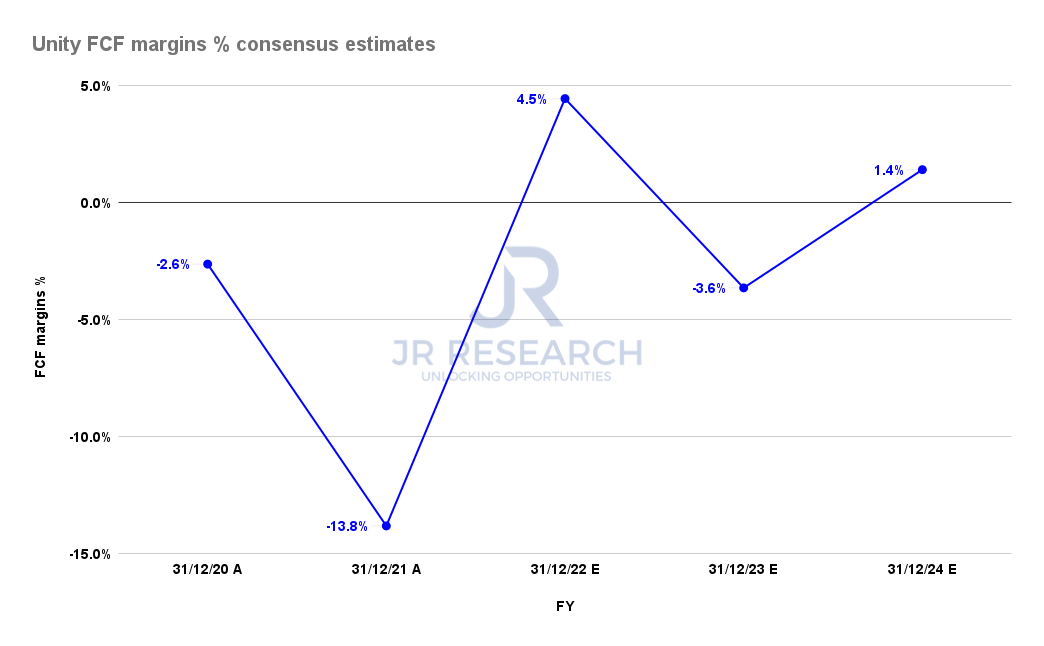
Unity FCF margins % consensus estimates (S&P Cap IQ)
Look at the consensus estimates of Unity’s FCF margins. The company is expected to struggle to stay FCF profitable, with the Street expecting further headwinds in FY23. Furthermore, the Street’s base case is generally bullish, as 14/18 analysts still have Strong Buy/Buy ratings.
Therefore, we believe Unity’s weak FCF profitability doesn’t justify its valuation. We used reasonable parameters for a typical “high-growth” play and assumptions in our reverse cash flow valuation model. Notably, our model suggests that Unity needs to post a TTM revenue of $43.57B by FQ2’26.
Consequently, we think it’s safe to say that it’s “impossible” by any standards for Unity to achieve our required revenue targets. Therefore, U stock remains well-overvalued.
Is U Stock A Buy, Sell, Or Hold?
We reiterate our Hold rating on U stock. Investors should consider U stock a speculative play given its weak fundamentals and FCF profitability.
Therefore, investors should utilize price action analysis to assess the market’s valuation of U stock, looking for clues of bull/bear traps as the market evolves its outlook and valuation on the company.
Notably, we have not observed a double bottom bear trap that could proffer an early signal of a sustained bottom, leading to a reversal of its bearish momentum.
Be the first to comment