

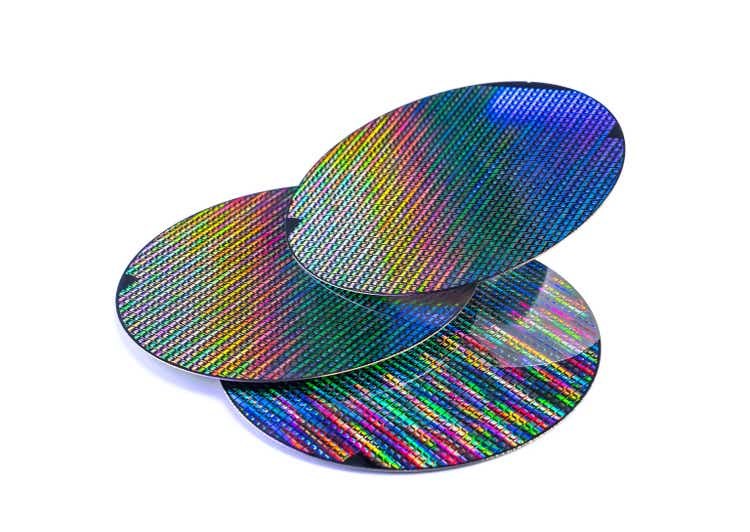
kynny
United Microelectronics (NYSE:UMC) posted some of its best quarterly numbers ever in its latest report. Revenue, margins and profits all jumped higher. However, the words “inventory correction” managed to overshadow everything else, countering all that was good in the Q2 report. UMC is literally and figuratively caught between two opposing forces. Why will be covered next.
The stock has gone sideways, but maybe not for much longer
It’s worth mentioning that quarterly earnings are not the only issue UMC has had to deal with recently. There are other issues confronting UMC. For instance, UMC is based in Taiwan and recent tensions with China are certain to weigh on investor sentiment towards UMC, which has manufacturing facilities in both. UMC is quite literally between two opposing forces.
Another relevant issue is the desire on the part of the U.S. to increase domestic manufacturing of semiconductor chips, starting with the recent passing of the CHIPS and Science Act. The bill is not aimed at UMC, but it could have negative repercussions for UMC in the long run. This could happen if the foundry business shifts towards the U.S. and away from Taiwan, where UMC has most of its fabs.
In theory, U.S.-based companies will get a leg up on their competitors in East Asia, UMC included. Initiatives like the CHIPS and Science Act are a positive development for U.S.-based manufacturers, but for companies like UMC, probably not so much. This viewpoint seems to be the prevailing one in East Asian counties as expressed in opinion pieces like this one.
Nevertheless, the fact remains that the stock has not done much since the release of the latest earnings report, even though it included some of the best numbers UMC has ever reported. The stock is currently where it was before the report, having gone sideways. UMC is still down 39% YTD. The chart below shows the price action in 2022.
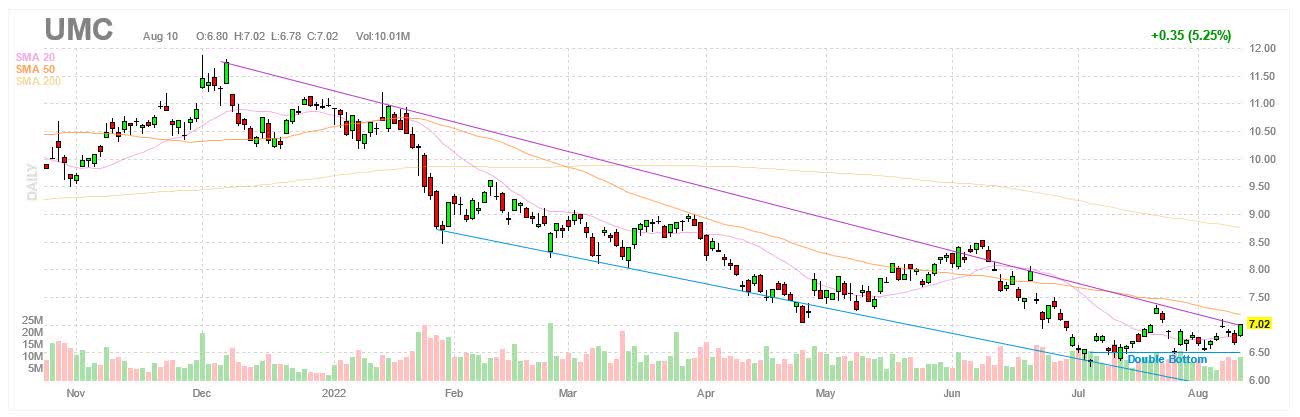
Source: finviz.com
Note how all the highs can be connected to form a descending trendline. The stock is currently bumping up against this trendline. A breakthrough would be a positive sign for the bulls, but if the existing trend holds, the stock is likely to have its march upwards cut off by the resistance imposed by the upper trendline.
In addition, the charts have painted what could be described as a descending triangle. The stock has bounced around within this triangle, which is formed by a descending upper trendline and a vertical lower trendline. The two trendlines are converging, which means the stock will have to break through either the upper or the lower trendline.
Descending triangles are considered continuation patterns, meaning the stock tends to continue in the direction of the previous trend once it breaks out of the triangle. The stock was heading lower before the recent sideways action, which suggests the stock is likely to break through the lower trendline for a move to the downside. The stock has moved sideways within the triangle, but probably not for too much longer.
UMC is still in excellent shape, but that may change in the near future
It’s true the stock has not done all that much lately, but the latest report still included some of the best numbers ever for UMC. Q2 revenue increased by 41.5% YoY to NTD72,055M, which equals $2,325M using an exchange rate of 1:29.71 for the U.S. dollar. EPS increased by 77.6% YoY to NTD1.74, which translates to $0.293 per ADS. Gross margin improved by 1520 basis points YoY to 46.5% and operating margin improved by 1690 basis points YoY to 39.1%.
Note that the 149% YoY increase in operating income was much more than the increase in net income in Q2. This was due to a non-operating loss of NTD2,586M, which was mostly the result of a NTD3,675M investment loss, partially offset by a NTD1,361M gain in foreign exchange rates. In contrast, UMC posted a non-operating gain of NTD1,881M a year ago, skewing the quarterly comparisons. In other words, earnings growth was better than the headline numbers suggest it was. The table below shows the numbers for Q2 FY2022.
|
(Unit: NTD) |
Q2 FY2022 |
Q1 FY2022 |
Q2 FY2021 |
QoQ |
YoY |
|
Revenue |
72,055M |
63,423M |
50,908M |
13.6% |
41.5% |
|
Gross margin |
46.5% |
43.4% |
31.3% |
310bps |
1520bps |
|
Operating margin |
39.1% |
35.2% |
22.2% |
390bps |
1690bps |
|
Operating income |
28,164M |
22,334M |
11,313M |
26.1% |
149.0% |
|
Net income |
21,327M |
19,808M |
11,943M |
7.7% |
78.6% |
|
EPS |
1.74 |
1.61 |
0.98 |
8.1% |
77.6% |
Source: UMC
The utilization rate remained at 100%+. Capacity at UMC did not change much in recent quarters, but it rose to 2,528K 8-inch equivalent wafers in Q2 with Fab 12A P5 coming online. Wafer shipments increased to 2,622K wafers, up 4.3% QoQ. The increase in shipments combined with higher average selling prices were the main reasons behind the strong growth in sales and earnings in Q2.
The balance sheet saw significant changes as well. The cash balance reached NTD183.7B in Q2 FY2022, up from NTD124B in Q2 FY2021. On the other hand, current liabilities increased to NTD131.8B in Q2 FY2022, up from NTD85B in Q2 FY2021. Keep in mind that UMC is currently in the midst of a major expansion with two new fabs scheduled to come online in the next two years. Debt-to-equity remained unchanged YoY at 76%.
Guidance basically calls for a repeat of Q2 in Q3. From the Q2 earnings call:
“Going into the third quarter, we expect our business to remain firm. While accruing demand for smartphones, PCs and consumer electronics may pose some short-term fluctuations, we are actively working with customers to adjust their product mix. Coming off a Supercycle over the past two years, the semiconductor industry is now in a period of inventory correction. We believe UMC’s comprehensive portfolio for differentiated leading specialty technologies and strong partnerships with leading customers will help us navigate the cyclical micro environment.
Now let’s move on to third quarter 2022 guidance. Our wafer shipments will remain flat, ASP in U.S. dollars will remain flat. Gross profit margin will be in a mid 40% range. Capacity utilization rate will be a 100%. Our 2022 cash base CapEx will be budgeted at a $3.6 billion.”
A transcript of the Q2 FY2022 earnings call can be found here.
However, while business is still in good shape overall, UMC is seeing weakening demand in certain market segments with some customers sitting on too much inventory.
“I reported our guidance in Q3 will be fully load, 100% loading. And by in Q4, we still believe that we can maintain a healthy loading while the pricing will remain firm.
And other data we will provide an update in our next quarterly conference, going into 2023, given the rising macro uncertainty continues and the higher inflationary cost pressure, we perceive the foundry industry growth in 2023 will be more moderate.”
It’s still early, but the outlook sees FY2023 as being worse than FY2022 for the foundry industry. The semiconductor industry is cyclical and there are increasingly signs the industry is heading down after flying high in the last few years.
Why UMC is still worth a look
Semis have increasingly fallen out of favor in 2022, but UMC may still be an interesting proposition to some, especially those who are leaning conservative and looking for value. For instance, UMC comes with a yield of 7.7% with an annual dividend of $0.51.
Note that UMC is projected to earn $1.22 in FY2022, giving UMC some headroom to maintain the dividend even if earnings were to decline. The dividend makes it easier to hold on to a stock even if it is not performing the way you would like it to, giving you the leeway to wait for better times and the stock to recover.
In addition, UMC still trades at low valuations. For instance, UMC has an enterprise value of $12.9B, which equals 2.7 times EBITDA on a forward basis and 3 times EBITDA on a trailing basis. The stock is valued at 1.79 times book value. The table below shows the multiples UMC trades at.
|
UMC |
|
|
Market cap |
$17.05B |
|
Enterprise value |
$12.88B |
|
Revenue (“ttm”) |
$8,422.8M |
|
EBITDA |
$4,255.2M |
|
Trailing P/E |
6.83 |
|
Forward P/E |
5.47 |
|
PEG ratio |
0.09 |
|
P/S |
1.99 |
|
P/B |
1.79 |
|
EV/sales |
1.53 |
|
Trailing EV/EBITDA |
3.03 |
|
Forward EV/EBITDA |
2.71 |
Source: Seeking Alpha
Investor takeaways
UMC continues to impress with its quarterly numbers. In Q2, revenue grew by 41.5% YoY. EPS grew by 77.6% and it could have been even higher if not for a loss on investments. Nevertheless, the numbers could not change the direction of the stock. The stock continues to go sideways. UMC might have gotten a different response if Q2 earnings were the only issue to be concerned about.
The Q2 numbers were arguably the finest yet, but they were overshadowed by geopolitical tensions and a looming industry downturn. UMC itself is doing fine and it remains optimistic about its immediate prospects, especially with certain market segments like automotive continuing to outperform, but there are lingering concerns as to how long and how deep a potential downturn could last in the semiconductor market.
I would not be a buyer of the stock at this time with everything going on. The headwinds that were mentioned before in a previous article have managed to keep a lid on the stock. UMC appears to be in a tug-of-war, stuck between two opposing forces that are pulling the stock in opposing directions. There are arguments to be made in favor of long UMC, but there are also arguments to be made against it.
UMC is available at attractive multiples and the dividend is worth having. UMC continues to execute as shown in some very good quarterly numbers. On the other hand, tensions between China and Taiwan are likely to remain for the foreseeable future and they will weigh on UMC and its stock by extension. While UMC has yet to see much of an impact from the inventory correction taking place in the industry, it’s possible that could change in the coming quarters.
The major concern with UMC is not so much how it is doing at the moment, but what might happen to it in the near future, whether it is due to an escalation in tensions or an industry downturn. The semiconductor market is likely past its peak in the current cycle. Charts are not infallible, but they seem to be leaning towards the downside. Compare the two opposing sides of the argument and staying on hold is probably best.
Be the first to comment