

cosmonaut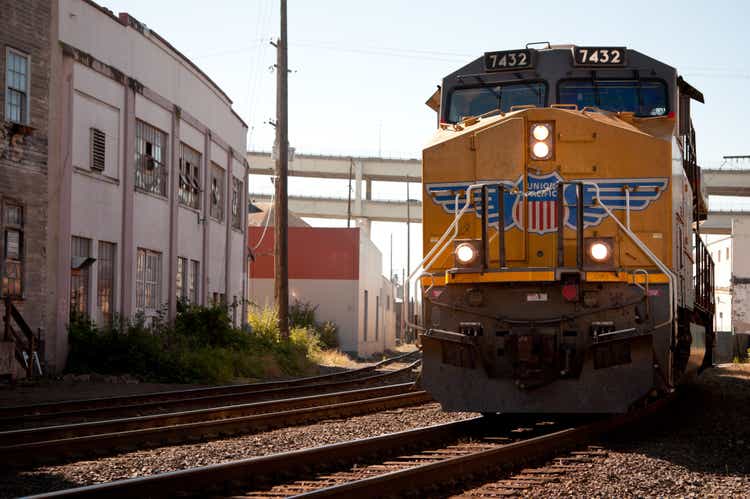
Introduction
My thesis is that investors need to pay attention to free cash flow (“FCF”) for railroad companies like Union Pacific (NYSE:UNP), especially during times of high inflation. The difference Union Pacific sees between net income and FCF tends to be more meaningful when inflation is high.
By FCF, we mean cash provided by operating activities less capital expenditures (“capex”). One of the ways management’s definition for FCF differs from this is that they also subtract dividends. Management calculates cash conversion by using a numerator of cash provided by operating activities less capex; they then divide this numerator by the denominator of net income.
The Numbers
The condensed consolidated statement of cash flows in the 2Q22 release shows that capex has gone up 38% from $1,190 million in 1H21 to $1,645 million in 1H22:
Cash Flow (2Q22 release)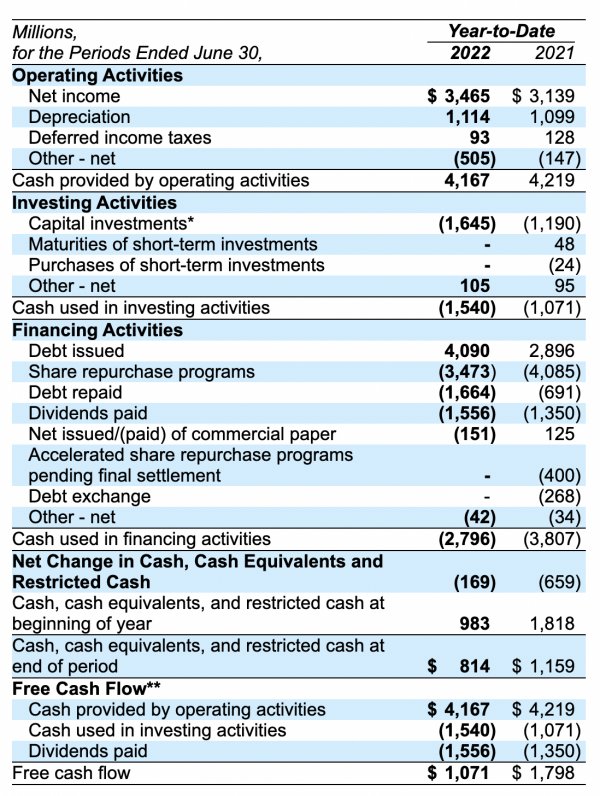
This is one of the reasons why railroads need to be evaluated from a free cash flow (“FCF”) perspective as opposed to just a net income perspective. While calculating FCF, management subtracts all of the cash used in investing activities whereas I only subtract the capex portion. Also, management subtracts dividends paid and I do not. Union Pacific saw net income rise from $3,139 million for 1H21 to $3,465 million for 1H22. However, FCF fell from $3,029 million [$4,219 million – $1,190 million] for 1H21 to $2,522 million [$4,167 million – $1,645 million] for 1H22. The FCF margin fell from nearly 29% [$3,029 million/$10,505 million] for 1H21 to under 21% [$2,522 million/$12,129 million] for 1H22.
FCF fell from over 96% of net income in 1H21 to less than 73% of net income in 1H22. This cash conversion fall from 96% to 73% is shown on slide 18 of the 2Q22 presentation:
Cash Conversion (2Q22 presentation)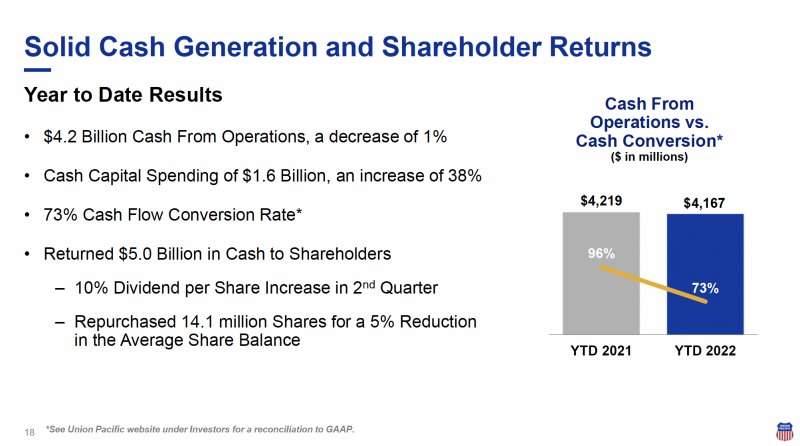
Here is the way management shows the math behind the cash conversion rate from the 2Q22 10-Q:
Cash Conversion Rate (2Q22 10-Q)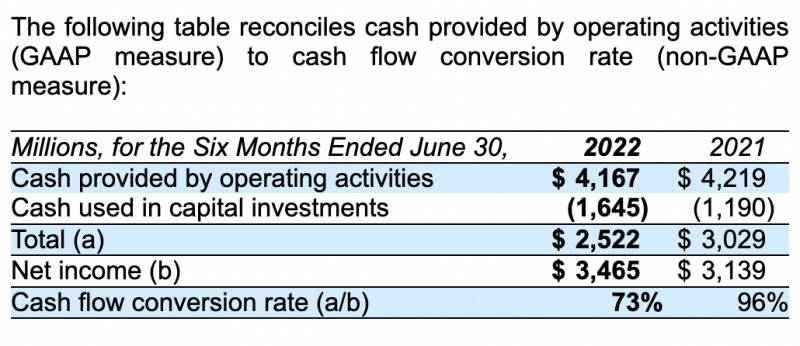
We have numbers going back decades that can be used to compute cash conversion. The years 1971 to 1980 are covered in the 1980 annual report. The 1981 to 1987 period is covered in the 1987 annual report. Note that the 1987 annual report says that capex includes exploratory expenditures and capital expenditures of unconsolidated affiliated companies. There is a gap from 1988 to 1991 but EDGAR has 10-K filings going back to 1993 and the 1993 filing has numbers going back to 1991. Using these numbers, I put together a spreadsheet that shows how well Union Pacific has done with FCF since the economic downturn of 2007 to 2009.
Before looking at the spreadsheet, we have to be mindful of inflation and deregulation. The Staggers Rail Act of 1980 was an inflection point for the railroad industry; comparisons for years before that time are apples and oranges as the industry economics improved dramatically afterwards. We also had high inflation in the 1970s which is especially bad for capital intensive industries like railroads. FRED shows annual inflation based on consumer prices from January 1st of each year:
Inflation (FRED)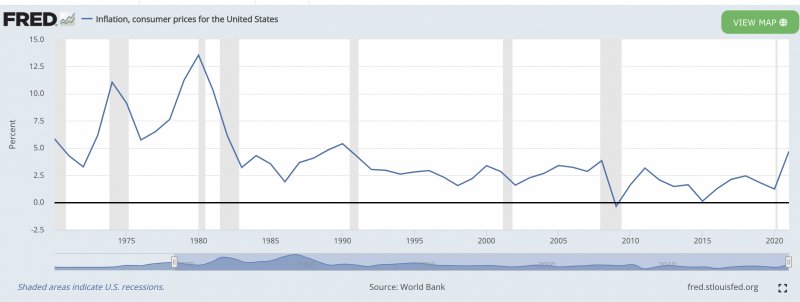
Here are the FCF and cash conversion numbers going back over the years:
|
Year |
FCF in millions |
Cash Conversion |
FCF Margin |
Net Income Margin |
|
1971 |
$42 |
168% |
4% |
3% |
|
1972 |
$98 |
94% |
9% |
9% |
|
1973 |
$95 |
75% |
8% |
10% |
|
1974 |
-$104 |
-83% |
-6% |
8% |
|
1975 |
-$140 |
-94% |
-8% |
8% |
|
1976 |
-$24 |
-12% |
-1% |
9% |
|
1977 |
$31 |
14% |
1% |
9% |
|
1978 |
-$26 |
-10% |
-1% |
9% |
|
1979 |
-$176 |
-46% |
-4% |
9% |
|
1980 |
-$324 |
-80% |
-7% |
8% |
|
1981 |
-$83 |
-19% |
-1% |
7% |
|
1982 |
$211 |
64% |
4% |
6% |
|
1983 |
$321 |
108% |
4% |
4% |
|
1984 |
$203 |
41% |
3% |
6% |
|
1985 |
$250 |
50% |
3% |
6% |
|
1986 |
$595 |
123% |
9% |
7% |
|
1987 |
$376 |
64% |
6% |
10% |
|
1988 |
||||
|
1989 |
||||
|
1990 |
||||
|
1991 |
$161 |
17% |
2% |
13% |
|
1992 |
$93 |
13% |
1% |
10% |
|
1993 |
-$11 |
-2% |
0% |
7% |
|
1994 |
$203 |
37% |
3% |
8% |
|
1995 |
$396 |
42% |
5% |
13% |
|
1996 |
$297 |
33% |
3% |
10% |
|
1997 |
-$501 |
-116% |
-5% |
4% |
|
1998 |
-$1,546 |
-15% |
-6% |
|
|
1999 |
$35 |
4% |
0% |
7% |
|
2000 |
$270 |
32% |
2% |
7% |
|
2001 |
$256 |
27% |
2% |
8% |
|
2002 |
$363 |
27% |
3% |
11% |
|
2003 |
$691 |
44% |
6% |
14% |
|
2004 |
$381 |
63% |
3% |
5% |
|
2005 |
$426 |
42% |
3% |
8% |
|
2006 |
$638 |
40% |
4% |
10% |
|
2007 |
$781 |
42% |
5% |
11% |
|
2008 |
$1,290 |
55% |
7% |
13% |
|
2009 |
$850 |
45% |
6% |
13% |
|
2010 |
$1,623 |
58% |
10% |
16% |
|
2011 |
$2,697 |
82% |
14% |
17% |
|
2012 |
$2,423 |
61% |
12% |
19% |
|
2013 |
$3,327 |
76% |
15% |
20% |
|
2014 |
$3,039 |
59% |
13% |
22% |
|
2015 |
$2,694 |
56% |
12% |
22% |
|
2016 |
$4,020 |
95% |
20% |
21% |
|
2017 |
$3,992 |
86% |
19% |
27% |
|
2018 |
$5,249 |
88% |
23% |
26% |
|
2019 |
$5,156 |
87% |
24% |
27% |
|
2020 |
$5,613 |
105% |
29% |
27% |
|
2021 |
$6,096 |
93% |
28% |
30% |
*For 2017 above, I used the cash conversion percentage of 86% as opposed to the percentage we’d see when dividing by GAAP net income. The 86% comes from page 102 of the 2020 Build America report in which it is explained that 2016 and 2017 are adjusted to include the retrospective adoption of ASU 2017-07 and that 2017 is adjusted to exclude the impact of Corporate Tax Reform. In that report they also adjusted 2020 down to 101% from 105% as they excluded the Brazos non-cash impairment change but I left 2020 alone. For 1991, I added a special charge of $870 million back to net income. I used net income of $485 million for 1986, ignoring special charges that brought GAAP net income down to negative $460 million for that year.
It is easier to visualize these numbers in a chart and the numbers are more consistent from 2000 to present. We see that FCF and the FCF margin have gone up nicely since 2009:
Historical FCF (Author’s spreadsheet)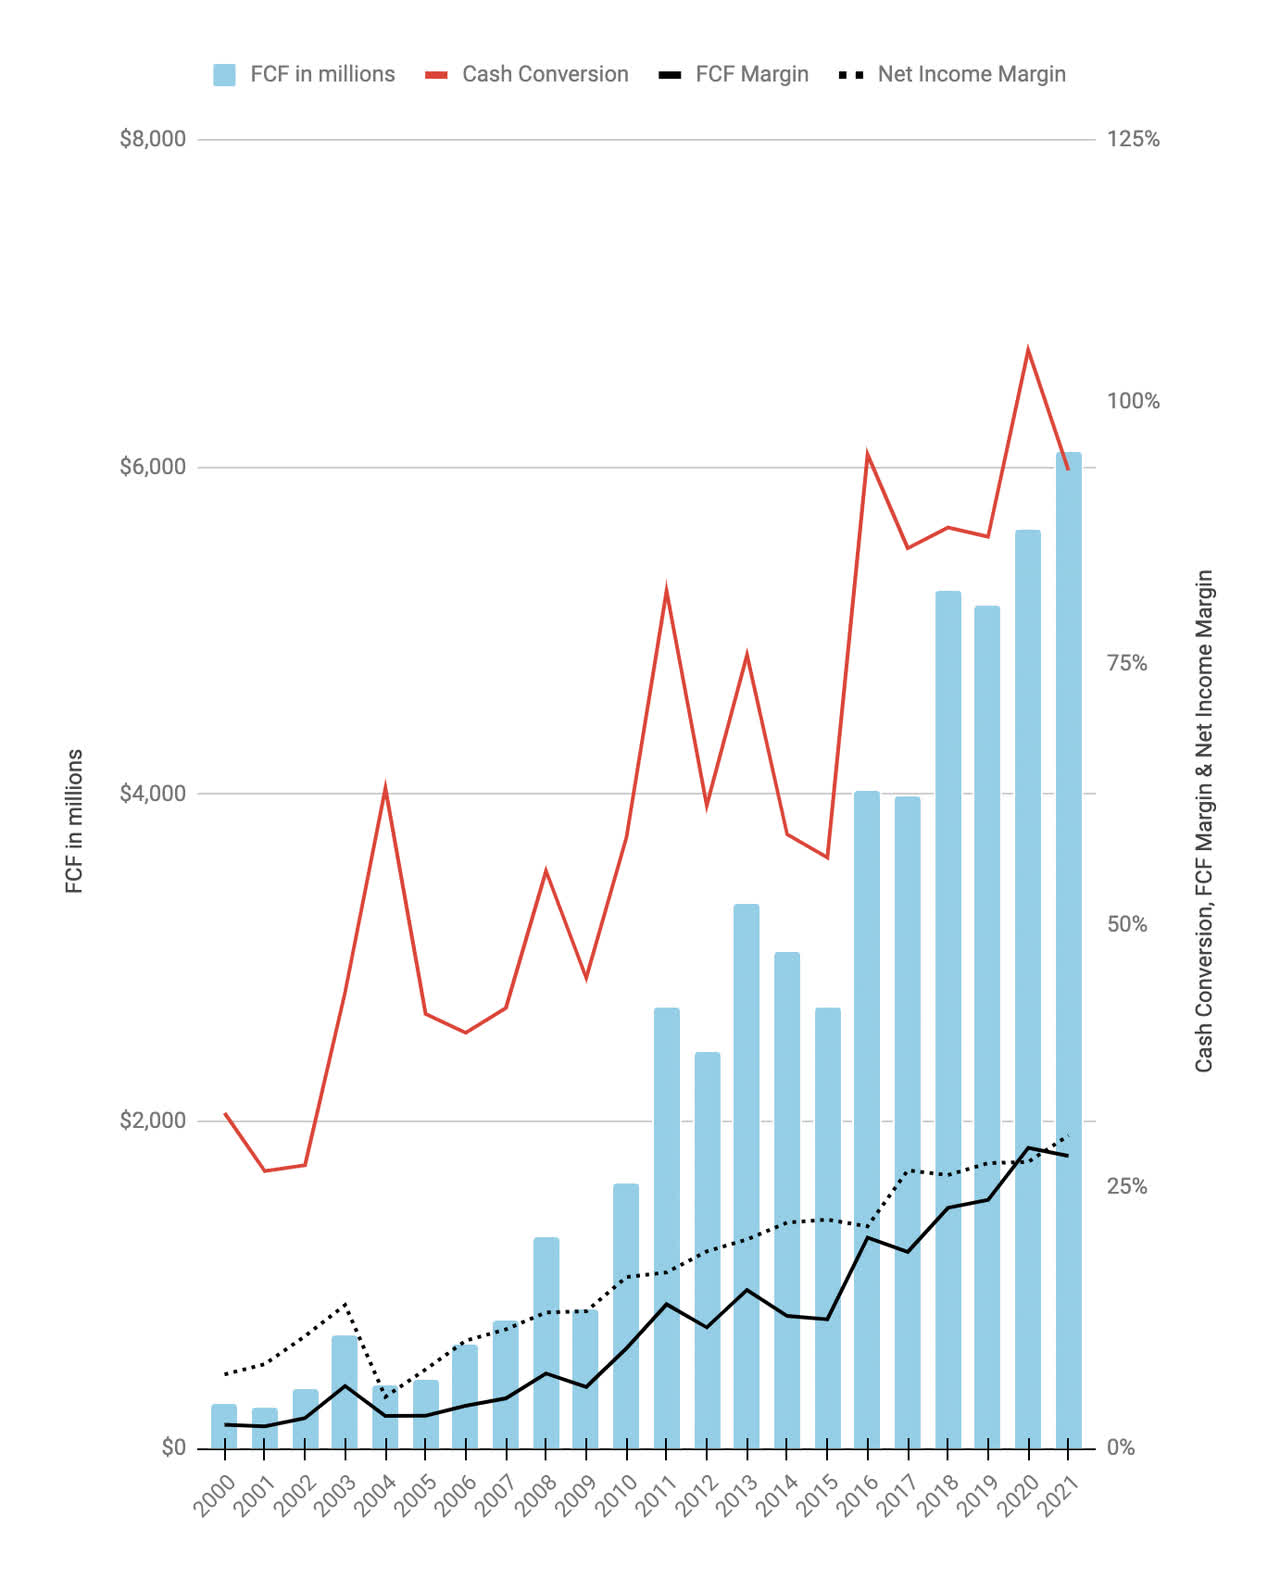
Having many similarities with Union Pacific, Burlington Northern Santa Fe was acquired by Berkshire Hathaway (BRK.A) (BRK.B) in 2009. Given factors like low cash conversion rates in the years leading up to the acquisition, I’m sure Berkshire CEO Warren Buffett was focusing more on FCF than GAAP net income when looking at the annual reports. Today’s investors need to focus closely on cash conversion now that it has gone down to 73% for 1H22.
Valuation
In October 2021 I wrote about how considerations like longer train lengths have boosted FCF margins over the years. However, we need to watch capex very closely now that inflation is on the rise. One way railroad investors can assuage themselves is by remembering that the higher fuel prices we’re seeing in this inflationary environment tend to hurt trucking competitors more than they hurt railroads. Looking at the 2Q22 10-Q and the 2021 10-K, trailing-twelve month (“TTM”) net income is $6,849 million [$3,465 million + $6,523 million – $3,139 million]. Using net income alone as a valuation metric is dappled and the more meaningful TTM FCF is $5,589 million [$2,522 million + $6,096 million – $3,029 million].
The 2Q22 10-Q shows 624,478,594 shares outstanding as of July 15th. Multiplying this by the July 22nd share price of $213.40 gives us a market cap of $133 billion. The enterprise value is $32.8 billion more than the market cap. This is due to long-term debt of $29,673 million and long-term lease liabilities of $1,295 million plus short-term debt of $2,334 million and short-term lease liabilities of $314 million; these considerations are only partially offset by cash and short-term investments of $834 million. Both net income and FCF are lowered by the interest expense line which was $623 million for 1H22 and $1,208 million for the TTM through June [$623 million + $1,157 million – $572 million]. As such, I like to use market cap instead of enterprise value when making comparisons.
Right now, Union Pacific’s market cap is about 24x TTM FCF and this might be a bit rich as interest rates keep rising. Still, betting against railroads for extended periods of time has been disastrous since 2009 and maybe Mr. Market is right about today’s share price.
Be the first to comment