

JHVEPhoto
Thesis
As a dividend investor, the goal is to invest in firms that have a high likelihood of maintaining growing dividend payments throughout the investor’s lifespan. UGI Corporation (NYSE:UGI) is a dividend Aristocrat and is likely to continue its growth in an industry that is critical for people worldwide but has potential for radical change with new technology, legislation, and energy focused capital allocations. All else being equal, analyzing the historical dividend data of UGI Corporation shows consistent dividend growth and a high probability of future success for investors through quantitative analysis. UGI also has strong valuation metrics, acceptable growth compared to its sector, and competitive profitability metrics. The current price action places UGI at a “Buy” rating with a highly probably minimum 7-8% return. This is augmented by a potential upside of approximately a 11% to 12% annualized return if they can maintain the trend of dividend growth they have demonstrated over the past two decades.
Price Action
Observing the price action of UGI over multiple periods is important to gain perspective on recent and long-term trends. The UGI price action has oscillated in a more volatile manner when compared to the S&P 500 while currently experiencing a greater downturn YTD (Figure 1).
Figure 1. UGI YTD vs S&P 500 (Seeking Alpha)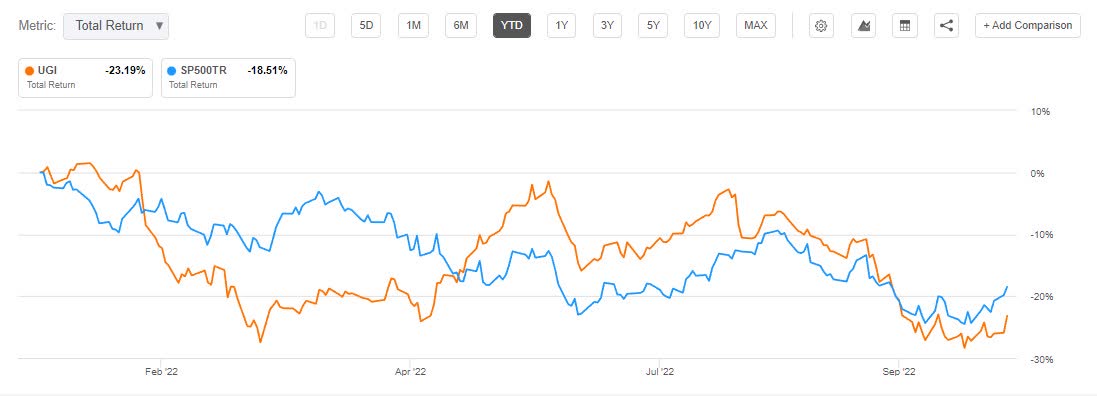
For long-term focused investors, UGI price action has outperformed the S&P 500 (which is no easy feat) though there observably seems to be a much larger variance in UGI pricing throughout this time period (Figure 2).
Figure 2. UGI total return vs. S&P 500 since 1992 (Seeking Alpha)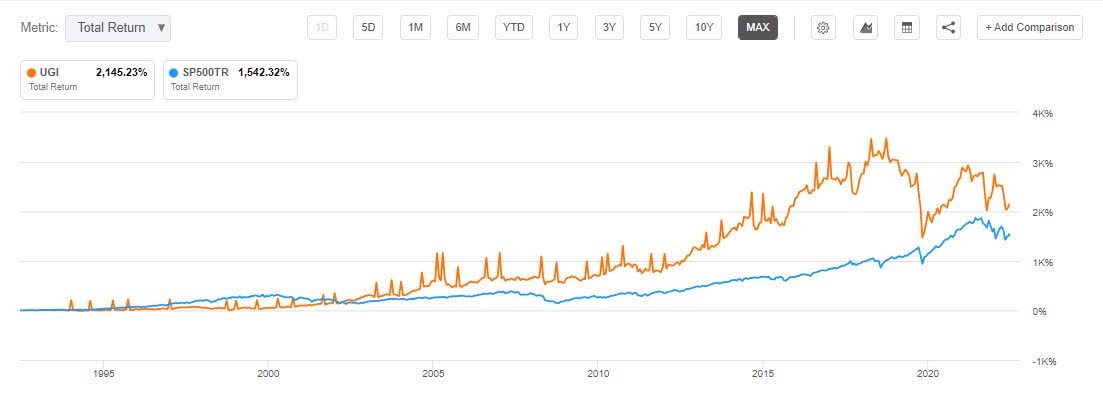
Intent
The intent of this article is to value UGI for long-term dividend focused investors. Investors can utilize quantitative methods augmented by investor expectations to determine a purchase price for firms that have a high likelihood of success which create opportunistic purchase points during downtrends.
The utilization of historical data helps investors understand how UGI has performed over a longer period of time. Combining this with a Monte Carlo simulation allows for a virtual representation of future outcomes. The Monte Carlo simulation for this analysis is performed by creating a random sample of 5,000 data points based off historical inputs and predicting what a randomized future may look like for UGI investors. When quantitative analysis is combined with individual investor analysis of UGI’s competitive landscape, management, and other financial metrics, investors can determine where they think the valuation lies for their expectations and factor in a margin of safety for their investment.
Focusing in on the Dividend
UGI has a strong dividend history, and the Seeking Alpha Dividend Grades shows a strong rating for Dividend Safety, Dividend Growth, Dividend Yield, and Dividend Consistency primarily due to the consistent growth rates, strong current yield, and acceptably covered payout ratios (Figure 3). The Dividend Yield [FWD] is currently 4.23%, which is higher than the Sector median of 3.56%. This strong historical performance signals that the company maintains a keen eye on shareholder returns and investors find value in the firm’s consistency.
Figure 3. UGI Dividend Grade (Seeking Alpha)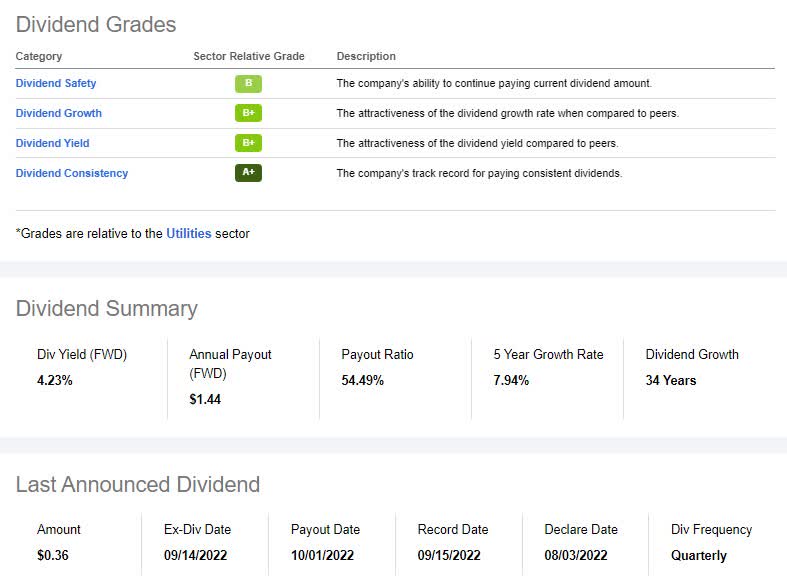
The Dividend Statistics
The first step in modeling the future dividend of UGI is to analyze their historical performance (Figure 4). The dividend data in this analysis was sourced from the UGI dividend history on the firm’s website and is an important tool for analyzing future scenarios. The historical growth rate distribution shows a moderate growth rate since 1972. The mean and median dividend growth rates are 4.72% and 4.35% respectively. The standard deviation is 3.98% with a 95% confidence interval between 3.59% and 5.85%. This means that 95% of the historical data should fall between those values and the standard deviation represents a range of outcomes as a measure of volatility.
Figure 4. UGI historical dividend frequency distribution (Author)
It’s important to note that a few large years of high growth rate create a “fat-tail” or skew to the right side and it is less probable that these right-skewing growth rates will continue into the future.
A graph of the annualized dividend (blue line), and the dividend growth rate (red line) since 1972 show a very volatile dividend growth rate that is likely tied to the firm’s annual performance and industry cyclicality (Figure 5). Regardless of the volatile rate changes, UGI has supplied shareholders with consistent dividend growth since 1988. Observe how the greatest growth rates (> 10%) have been sporadic having only occurred three times since 2010. It seems that investors value the consistency and longevity of this pattern since the growth rates historically are much more modest.
Figure 5. UGI annual dividend and dividend growth rate (Author)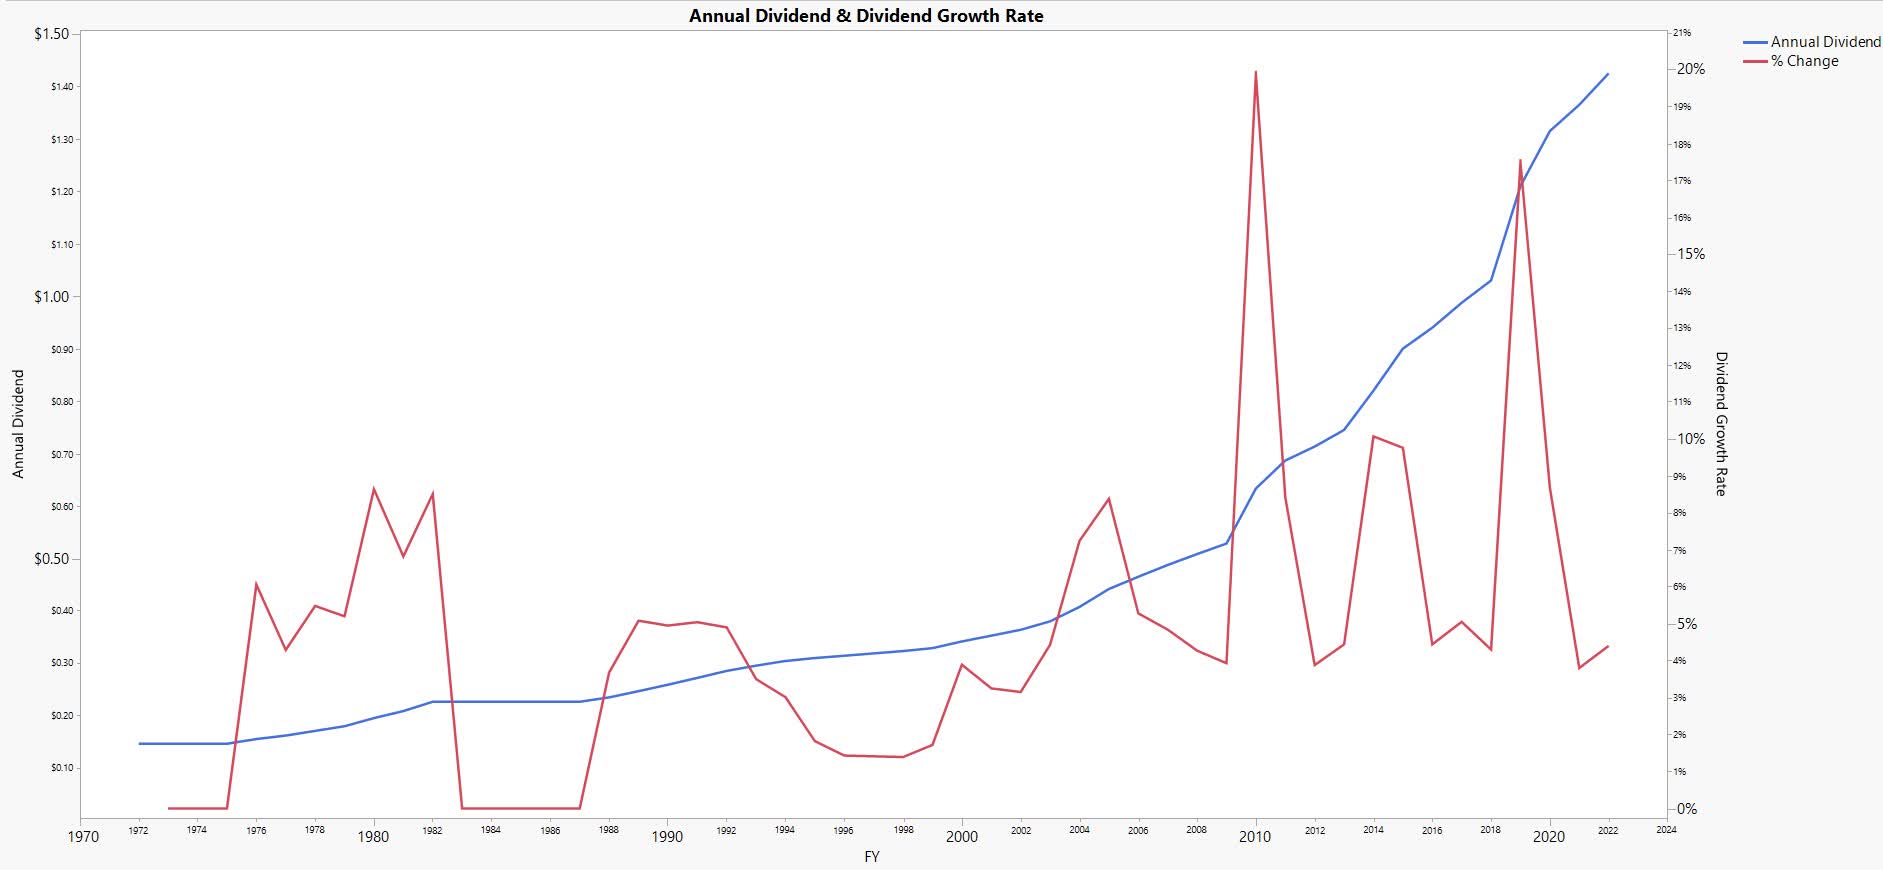
Monte Carlo Simulation
The Monte Carlo simulation attempts to create randomized future scenarios which can be used to predict future performance. The Monte Carlo simulation for UGI inputs the median and standard deviation from the historical data. The median is chosen because in distributions with skew, the median is a better representation of the truer middle. The Monte Carlo simulation was run through 5,000 iterations and the results show that a forecasted median and mean (4.42% and 4.39%) dividend growth rate can be potentially expected into the long-term future (Figure 6).
Figure 6. UGI Monte Carlo dividend growth rate summary (Author)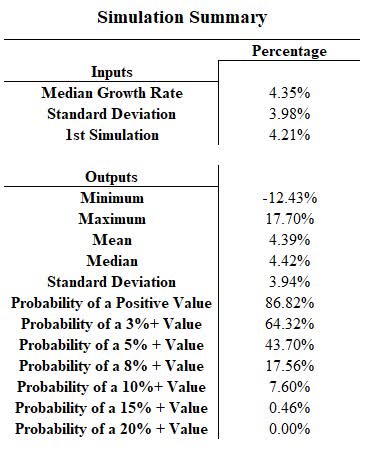
The simulation shows that during any independently given year, UGI has an 86.82% probability of increasing their dividend by a positive value. It also shows that at any given independent year, UGI has a 64.32% probability of increasing their dividend by at least 3% and a 43.70% probability of increasing their dividend by at least 5%. What this means for investors is that using the inputs from the historical data and 5,000 randomized iterations, UGI has a high probability per independent year of having a positive growth rate going into the future. UGI also has a possibility of having a dividend cut during any given year largely due to the large standard deviation in the data. It is important not to rule out the possibility of left tail (Black Swan) events that have negative outcomes for investors and investors should prepare for these by utilizing margins of safety in their inputs.
Growth Rate Summary
Figure 7 represents a summary of UGI’s dividend growth rates that investors can use to form their inputs into their investments. It represents how by utilizing different calculations, investors can determine different formulations for their cash flow perpetuity formulation. The Scenario median growth rate was calculated earlier using Monte Carlo simulations with a value of 4.42%.
Figure 7. UGI dividend growth rate summary (Author)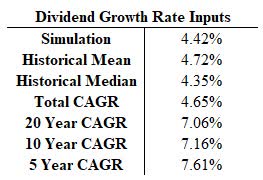
The Compounded Annual Growth Rate [CAGR] formula can also be utilized over different time periods to show potential trends (Figure 8). A CAGR formula considers the annual growth with a beginning and ending period and is a more accurate way of measuring returns when compared to arithmetic calculations. The summary above shows the results of a CAGR calculation since 1972, and the past 20, 10, and 5 years. This summary shows that UGI has done a good job maintaining their dividend growth across multiple calculations and periods, which helps build confidence for investors. It also shows that the past 20 years have outperformed the total historical period of dividend growth for UGI.
Figure 8. CAGR formula (Investopedia)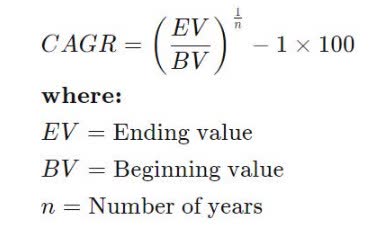
Sensitivity Analysis for Dividend Investors
The next step is to determine how investors can utilize this information for determining a purchase price based off their expectation of returns or their expectation for growth. A Gordon Growth Model can determine the intrinsic value of constantly growing payments (Figure 9). We can then utilize a Sensitivity Analysis combined with the Gordon Growth Model to determine purchase prices (Figure 10). It utilizes a constant cash flow (dividend), an expected growth rate (shown in the dividend growth rate summary, Figure 7), and the investors expected return to derive a purchase price for a position.
Figure 9. Gordon Growth Model (Investopedia)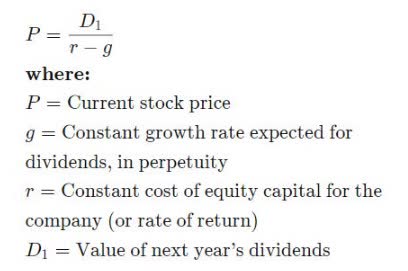
Orienting and understanding a Sensitivity Analysis is useful for investors to determine their ideal purchase price (Figure 10). The left column shows a scale of different Dividend Growth Rates ranging from 2% to 15%. The Desired Return shows a scale of different investor return expectations ranging from a 5% to 17% return. The tabulated data shows the purchase price of UGI stock needed given an expected dividend growth rate and the investors desired return. As of this writing, UGI is trading around the $34 price range and prices within 5% are highlighted in green.
Figure 10. UGI sensitivity analysis (Author)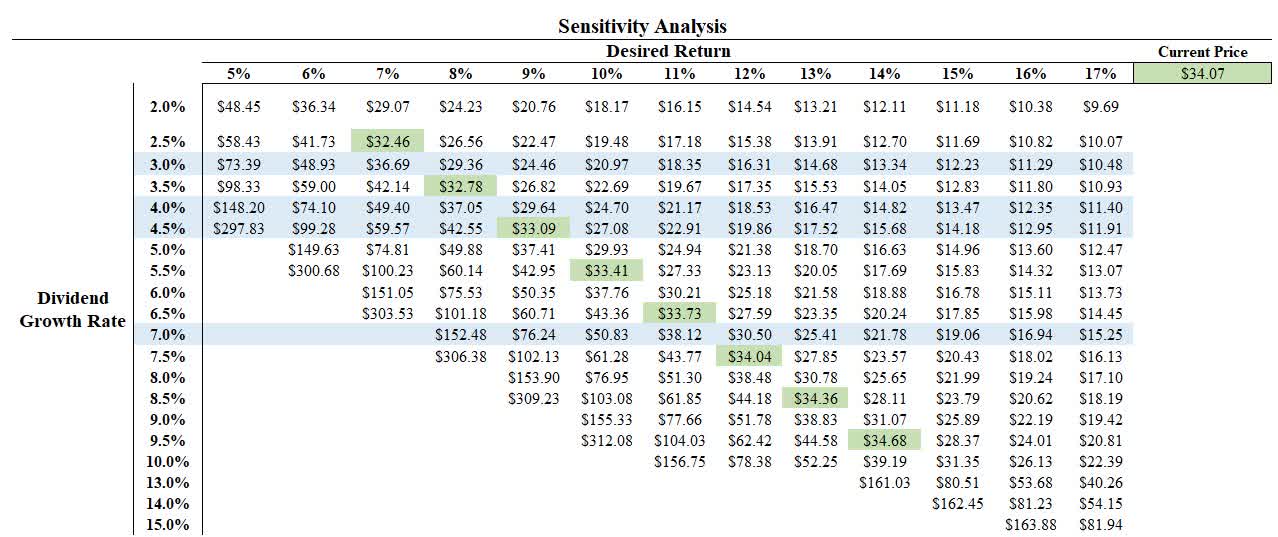
When an investor utilizes the sensitivity analysis and two of the three assumptions, they can determine their purchase price as demonstrated in Examples 1 through 3 below.
Example 1
If an investor utilizes the Monte Carlo simulation and expects a median growth rate of 4.42% and subsequently adds in a small margin of safety and rounds down to a 4% growth rate, then (at the current price) that means the investor can expect a return of approximately 8% to 9% if the 4% growth rate is actualized into the future.
Example 2
If an investor utilizes a 7% dividend growth rate based on the 5,10, and 20 year CAGR formulas (Figure 7) and desires a 12% return, then that investor would need to purchase around the $30.50 price range and may consider writing put options at $30 as a strategy for entering that position.
Example 3
If an investor theorizes that it is unlikely that UGI could grow their dividend as they have historically and forecasts a 3% dividend growth rate for perpetuity, then the current pricing of UGI would create an approximate 7% to 8% return for perpetuity. This example is conservative and creates a likely return of 7% as a base while creating opportunity for upside returns for any year that UGI grows their dividend at a higher rate. This is a conservative estimation but creates a margin of safety for investors’ expectations.
Sensitivity analysis allows for an investor to utilize their choice of the potential dividend growth outcomes and their expected return to determine their buying price and removes behavioral aspects encouraging better investment decisions.
Risk
There is currently large uncertainty and volatility in financial markets. Utilizing quantitative methods for investment decisions is intended to help mitigate risk. The Sensitivity Analysis shows that as the growth rate declines given a constant return expectation, the purchase price decreases for UGI. In times of exceptional uncertainty and risk (present economic conditions), it is beneficial to increase the return expectation or decrease the expected growth rate as a way of factoring in a margin of safety. As an example, an investor who normally expects a 10% return may expect a 15% return as a Margin of Safety and change their purchase price accordingly. Dividend investors can specifically focus on decreasing their risk by increasing their return expectation and estimating future dividend growth conservatively.
UGI specifically has had a stable dividend throughout its history even through cyclical energy pricing time-periods. Utilizing the dividend data exclusively could create scenarios that are too optimistic or pessimistic and other factors may change analysis accordingly. Investors should consider multiple scenarios before making any decision (as demonstrated in Examples 1 through 3). Investors should also consider other financial metrics, management, and the current/future competitive landscape (climate change and ESG focused pressure for energy companies) to determine for themselves whether UGI can continue to grow its dividend at their extrapolated rates.
The current downward momentum is concerning for investors that may be interested in UGI price. Current economic forecasts have increased the probabilities of an upcoming recessionary period so maintaining “dry powder” may be important for building a portfolio. Utilizing option strategies like selling cash-secured puts for UGI can provide good short-term returns for collateral cash and strengthen an investors position at different price points if the downward movement continues. Utilizing different strategies for entering positions are ways that investors can mitigate risk and hedge positions.
Summary
As a dividend investor, the goal is to invest in firms that have a high likelihood of maintaining growing dividend payments throughout the investors lifespan. UGI is a good Utilities firm delivering energy products with a growing historical dividend, strong valuation metrics, acceptable growth, and competitive profitability metrics. Analyzing the historical dividend data of UGI shows consistent dividend growth and a high probability of future success for investors through quantitative analysis. Bearish markets and cyclicality provide opportunity for long-term focused investors and UGI can be a nice addition to long-term focused portfolios.
We have been conducting a research series into dividend consistent firms for income investors by focusing on historical dividend statistics. The methodologies used in these articles can provide a useful analysis to augment investors decisions. It is important that investors gather multiple perspectives and explore other aspects of a firm before making investments decisions. If you are interested in utilizing this type of analysis for your investments, review the links to these other analyses.
- JPMorgan Chase & Co (JPM) – Article link
- Aflac (AFL) – Article link
- T. Rowe Price Group (TROW) – Article link
Be the first to comment