

The SPDR S&P 500 Trust ETF (SPY) and the SPDR Biotech ETF (XBI) are attractive investment tools for a passive investment. We believe that the US stock market will attract more investors in the medium and long term. Moreover, it can provide a better opportunity in 2020 than it did a year ago. In this article, we will try to share the reasons for our optimism about long-term prospects, as well as concerns regarding the short-term perspectives.
Also, we would like to share our optimism regarding the biotech sector in general and our belief that XBI will outperform the general market.
In order to assess the situation as objectively as possible, we need to dive deeper into understanding the features of the current recession and the immediate consequences, as well as try to assess the post-pandemic environment.
Introduction
The global economy has entered a stage of very rapid change and transformation. Technical innovations, scientific progress – all this has led to an acceleration in the pace of these transformations.
Globalization and the development of communications have made these changes a must for all countries. Today, technological advances can be used by everyone, regardless of the countries in which they are located. The only difference is the price of access and the quality of certain services or technologies.
Global changes have affected all areas of life, from political, economic and social relations to changes associated with individual patterns of behavior.
The opportunities associated with automation and digitalization completely transform traditional professions, company structures, supply chains and so on. At the same time, the demand structure of the economies is changing. All this happens with even greater speed than we could have imagined in the ’90s or early 2000s.
There are several models that describe the development of economic stages. Many of them are controversial, and perhaps here the question of personal preferences, as well as the specifics of various sociopolitical systems, matters. But in our opinion, Walt Whitman Rostow most successfully selected the names for these stages (although the descriptions of these stages may not coincide with what we observe after “the age of high mass-consumption”). We don’t want to take your time with too much detail. But anyone interested can read here.
Rostow divided the degrees of economic evolution into 5 main stages (Rostow’s Stages of Economic Growth) and the 6th subsequent stage of development:
- The traditional society
- The preconditions for take-off
- The take-off
- The drive to maturity
- The age of high mass-consumption
- Beyond consumption (search for quality)
For objective reasons, it was very difficult to predict the development of technologies and communications for years that changed behavioral patterns and transformed social relations. Therefore, the description of stage 6 may not quite fit into the reality that we are observing.
We require a dynamic theory of production which isolates not only the distribution of income between consumption, saving, and investment (and the balance of production between consumers and capital goods) but which focuses directly and in some detail on the composition of investment and on developments within particular sectors of the economy. The argument that follows is based on such a flexible, disaggregated theory of production.
When the conventional limits on the theory of production are widened, it is possible to define theoretical equilibrium positions not only for output, investment, and consumption as a whole, but for each sector of the economy.– W.W. Rostow, The Stages of Economic Growth: A Non-Communist Manifesto (Cambridge University, 1960)
Of course, business entities have become more dynamic and mobile. Today, we respond to challenges faster than ever, and it also affects the decision-making process in the financial markets.
Part 1
Globalization, which has played an undeniable positive role in transforming the global economy and society, has also created imbalances.
Trade imbalances were among the most alarming. Most developed countries have become hostages to chronic trade imbalances. Which, in itself, cannot continue indefinitely, and there is a need to reduce these imbalances.
The situation associated with COVID-19 will only accelerate these phenomena, becoming a catalyst for long-overdue changes.
The free circulation of capital, the development of communications, and the availability of technology make it possible to quickly build large industrial complexes in any regions and countries that are “convenient” for capital. Industry and even high technology are no longer “exclusive” activities.
The productive use and freedom of movement of capital allows us to have any technology and create any industry in a short time in many regions of the world. The main factors affecting the movement of capital are a set of important parameters that a specific economy and society possess:
- GDP
- Population
- GDP per capita
- Ease of Doing Business
- Corporate Tax
- Human Capital Index
- Median age
- Freedom of capital movement
- Access to the capital market
- The stability of the political system
- Separation of branches of government and development of democratic institutions
- IP protection
COVID-19: Quick Brief
As per a recent report by STAT, Gilead’s (GILD) Remdesivir shows rapid effectiveness among COVID-19 patients:
The best news is that most of our patients have already been discharged, which is great. We’ve only had two patients perish,” said Kathleen Mullane, the University of Chicago infectious disease specialist overseeing the remdesivir studies for the hospital.
Her comments were made this week during a video discussion about the trial results with other University of Chicago faculty members. The discussion was recorded and STAT obtained a copy of the video.
The outcomes offer only a snapshot of remdesivir’s effectiveness. The same trials are being run concurrently at other institutions, and it’s impossible to determine the full study results with any certainty. Still, no other clinical data from the Gilead studies have been released to date, and excitement is high.
The market perceived this as very positive news and a signal for a buy. However, reality will soon be seen when Gilead publishes the final results of the study of remdesivir for COVID-19.
We want to hope that remdesivir will show positive results, because it can save many lives. However, there are many questions, even at best:
- How will it affect the hospitalization rates? Definitely, if it reduces the hospitalization period that is a good point, but will it be able to reduce the number of hospitalizations?
- What will be the production capacity in case of success?
- How long will it take to ramp up the production? When the drug will be broadly available worldwide and at what cost?
It’s obvious that it will take some more time to clarify.
Without an effective vaccine and herd immunity, the situation with COVID-19 will remain for some time the biggest public health problem. Leading experts in this field do not expect an effective vaccine until the end of 2020.
We still do not know what the real spread of infection is in outbreak areas. The initial statistics of recorded cases and contagiousness in China misled many of us. We stated our concerns in our preliminary assessment, which was the response to apocalyptic scenarios on March 10, 2020.
In the beginning of April, Bloomberg reported that China intentionally misrepresented the information regarding COVID-19 statistics:
China has concealed the extent of the coronavirus outbreak in its country, under-reporting both total cases and deaths it’s suffered from the disease, the U.S. intelligence community concluded in a classified report to the White House, according to three U.S. officials.
Till the middle of March 2020, the outbreak of the infection in the Diamond Princess cruise ship was the only example of worst-case scenario for us, when 15% of passengers were infected in very contagious conditions.
Most passengers on the ship were people over 65 years of age, and with a highly contagious environment, mortality among infected passengers was observed in the range of 1-1.10% (all deaths occurred in the group of people over 65).
Currently declared case fatality rates (CFR) range from 0.31% in Singapore (cases of rapid response, the ability of the healthcare system and the preparedness of the population to preventive measures) to 12% in Lombardy (possibly a high figure due to the inability to identify a sufficient number of infected people at the beginning of the outbreak and the absence of the necessary capacities of the health system to provide the necessary assistance) and represent too wide a range in which countries cannot take risks.
Currently, reported mortality rates (CFR) range from 0.31% in Singapore (rapid response, the capacity of the healthcare system and the willingness of the population to take preventive measures) to 12% in Lombardy (possibly a high rate due to the inability to identify a sufficient number of infected people in time and limited ICU beds capacity) and represent too wide a range in which countries cannot take risks.
However, in the countries with the highest number of infections, studies have already begun to identify the real number of infections in the population.
So far, there is no scientific evidence that countries that have passed the peak of the pandemic earlier than others (South Korea, Italy, Spain, Belgium, Germany) received a sufficient amount of immunization of the population, which could give them the opportunity to slow down the spread of infection among the population.
But anecdotal studies already provide an interesting preliminary picture. The study led by Prof. Hendrik Streeck (from the Institut of Virology and Institute for HIV Research at the University Bonn) is interesting in terms of detection of real exposure of the virus in the population of the Gangelt municipality in Germany. However, it’s only preliminary results and we should wait for the publication of the final conclusions. The preliminary number of immunized population looks at a range of 14-15% now, while detected (PCR diagnosis) was stating only 2% of infected among the municipality population. But again, we should emphasize that these are only preliminary results, and final conclusions may differ in terms of statistical error calculations and processing the data from the rest of tested households. The preliminary results of the study are available here.
Prof. Christian Drosten (the Head of Administrative Office for Global Health and Director Institute of Virology, Charite, Berlin), who leads Germany’s efforts to combat the pandemic, recently emphasized the importance of this study:
Source: Recent tweet by Cristian Drosten
There are also many other anecdotal evidences that the real exposure of COVID-19 among the population can be much over the number of detected cases, due to large numbers of people infected with COVID-19 without symptoms. The recent cases aboard U.S. aircraft carrier Theodore Roosevelt were also interesting in terms of being asymptomatic carriers of virus. Around 60% of sailors tested positive were symptom-free.
Additional serological studies are needed to assess the actual level of infection in populations, considering the possible statistical errors of these tests. Many antibody tests show low sensitivity, and this should be noted as well. The recent study published by the journal Public Health stated that rapid antibody test sensitivity was only 36.4%:
Results
Of 49 individuals, 22 tested positive by repeated qPCR. In contrast, the rapid test detected only eight of those positive correctly (sensitivity: 36.4%). Of the 27 qPCR-negative individuals, 24 were detected correctly (specificity: 88.9%).
Another question is whether the presence of specific antibodies makes it possible to be immunized against COVID-19 for a long time (6 months, a year).
Obviously, conducting broader and more representative studies will also take weeks and several weeks to process the results (although the process has already begun in some limited regions). But we will not see the full picture earlier than in a month.
Given that the health systems of most countries are not ready to handle such a flow of patients, governments are unlikely to tolerate such a risk without accurate scientific evidence.
Among other things, the peak is not evidence of a rapid decline in new cases. And depending on the measures taken, it may drag on for several weeks. Italy and, in particular, the Lombardy region are proof of this.
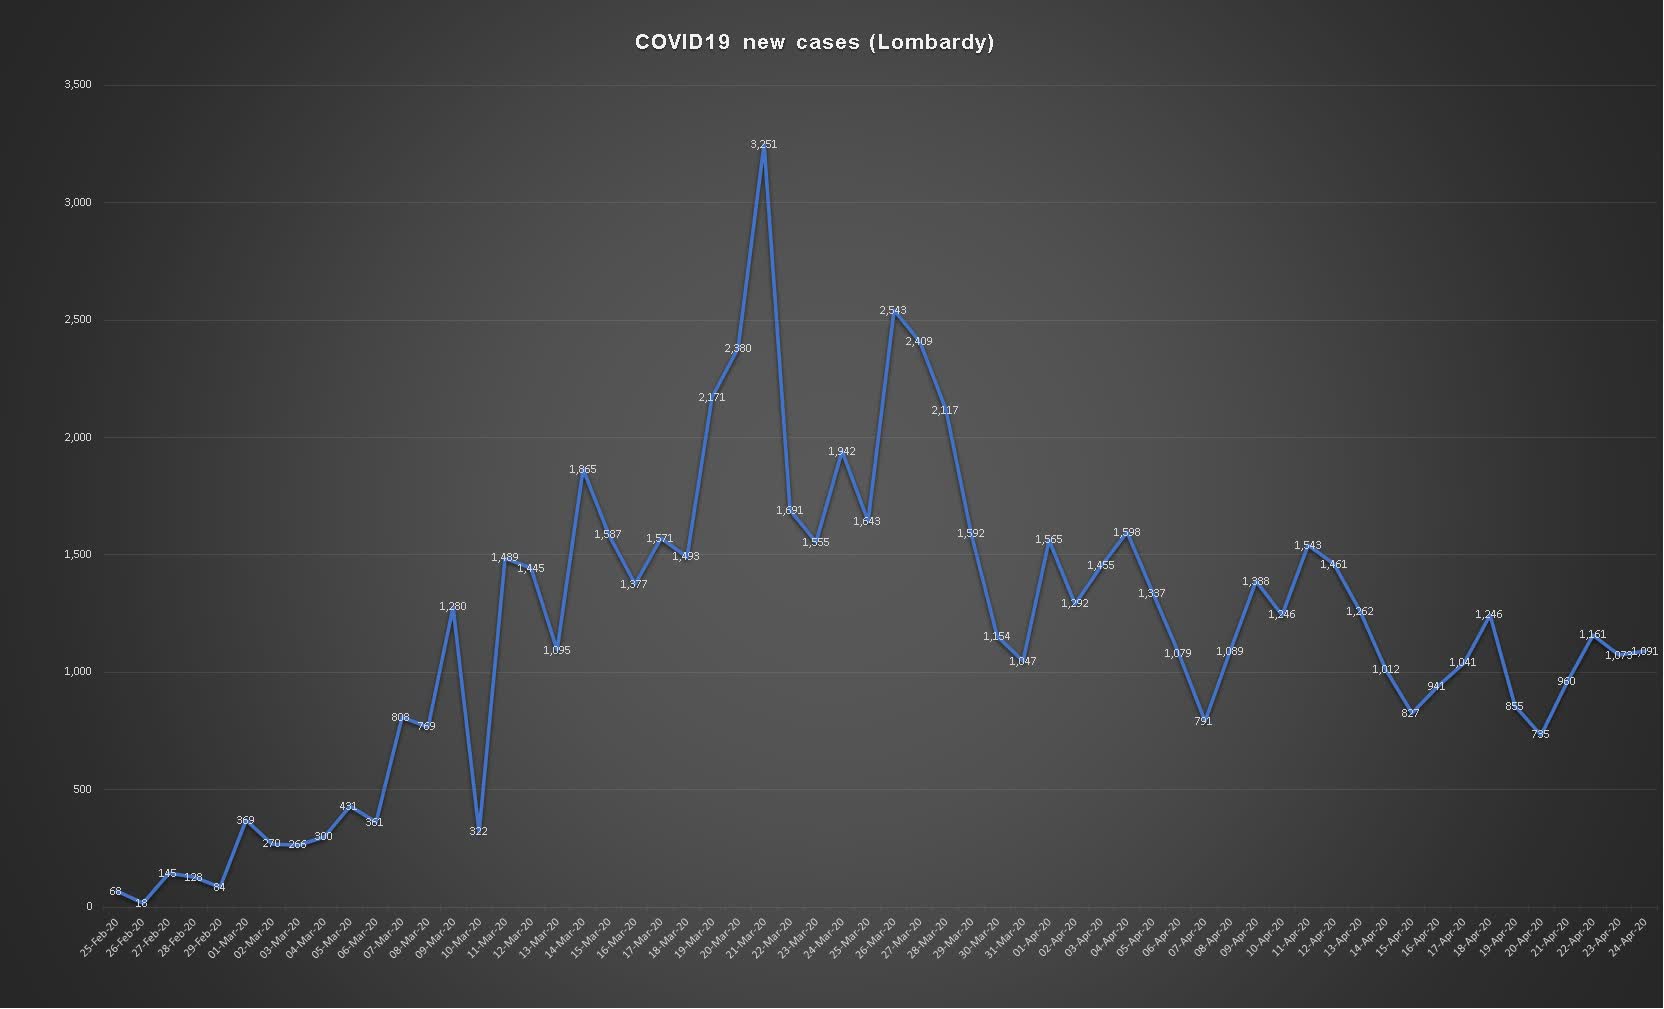
Source: Created by the author based on daily data provided by the Ministry of Health of Italy
Lombardy was the most affected region in Italy, and more than 50 days have passed since the quarantine began but daily cases are still high, despite the peak being reached.
The peak of the Lombardy pandemic was reached between March 18-28, 2020. The number of new cases is still at a fairly high level. Theoretically, it can take more than 2 weeks to reduce the number of new infections to controlled levels, which may allow the easing of quarantine measures.
However, we believe that a possible high percentage of mild symptomatic and asymptomatic cases could adversely affect quarantine measures. Asymptomatic cases are currently not detected and continue to spread the virus among small clusters (functioning important enterprises, families, etc.), although with a lower spread rate.
Thus, summarizing the above, even if we allow a partial opening of the largest world economies in May-June (when the situation with the spread of the virus can be kept under control in certain countries), this process will not be global in nature.
In addition, we still do not know the scale of future efforts needed to control the spread of infection, or perhaps controlled herd immunity will be chosen in some countries. In any case, countries will need to increase investment in their health care systems in order to prepare for possible problems.
Obviously, all these measures will have economic consequences in addition to what we have observed during February-April 2020.
Short-term consequences
Forecasts of the impact of the pandemic on the global economy vary. According to Oxford Economics, the global economy will shrink 2.8% in 2020. The World Economic Outlook report released by IMF forecasts 3% contraction of GDP in 2020 with 5.8% growth rate in 2021.
We emphasize that these two forecasts are in the middle between the most pessimistic and optimistic models.
The whole question is not in calculating losses that are currently impossible to accurately calculate. The key question is to respond these economic challenges based on available resources. Although it is clear that economic consequences will have a long-term effect, the ability to overcome this situation with less losses is a critical issue for the economy. And this is a key factor in attracting capital to the markets of different countries, in addition to the factors that we have listed earlier.
Despite the large stimulus packages in the largest economies of the world, the absence of a wide range of such instruments (for example, the emission of reserve currencies) in developing countries will certainly affect demand in the global economy and also affect developed countries.
Obviously, developing countries do not have a wide range of monetary instruments such as the United States and the EU have. The sizes of their stimulus packages will be related to the sizes of foreign exchange reserves. Otherwise, they will have to choose more painful methods, such as devaluation of national currencies due to increased liquidity or increasing foreign debts.
And let’s not forget that international trade was just rebounding before the COVID-19 pandemic. According to the UNCTAD, international trade in 2018 has not yet reached the pre-crisis levels of 2008:
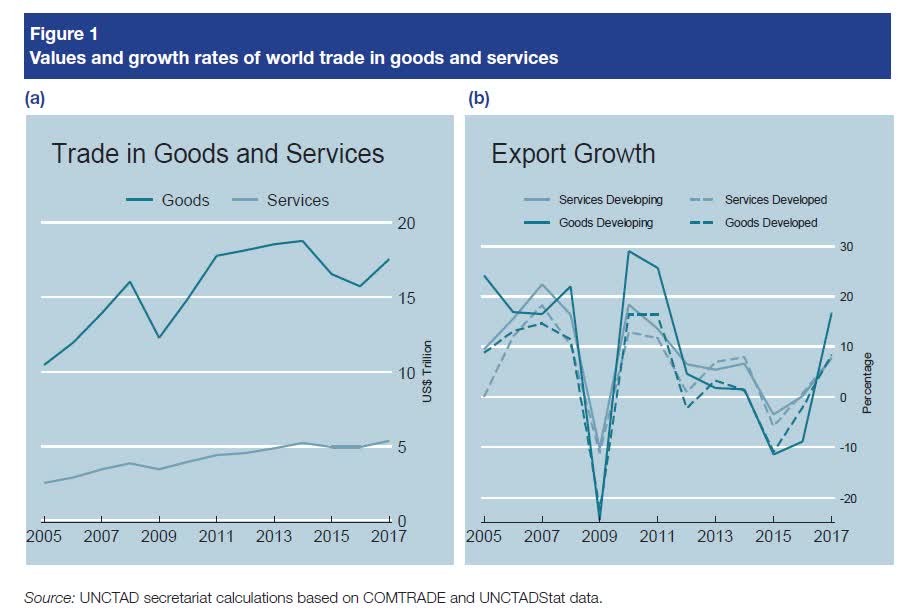
Source: Global trade trends in 2018 / UNCTAD
In the case of devaluation of national currencies, they may face tougher conditions that could lead to a more serious reduction in real GDP and, in addition, to huge losses on local stock exchanges.
Now, let’s compare the foreign exchange reserves of the largest developing economies with GDP indicators:
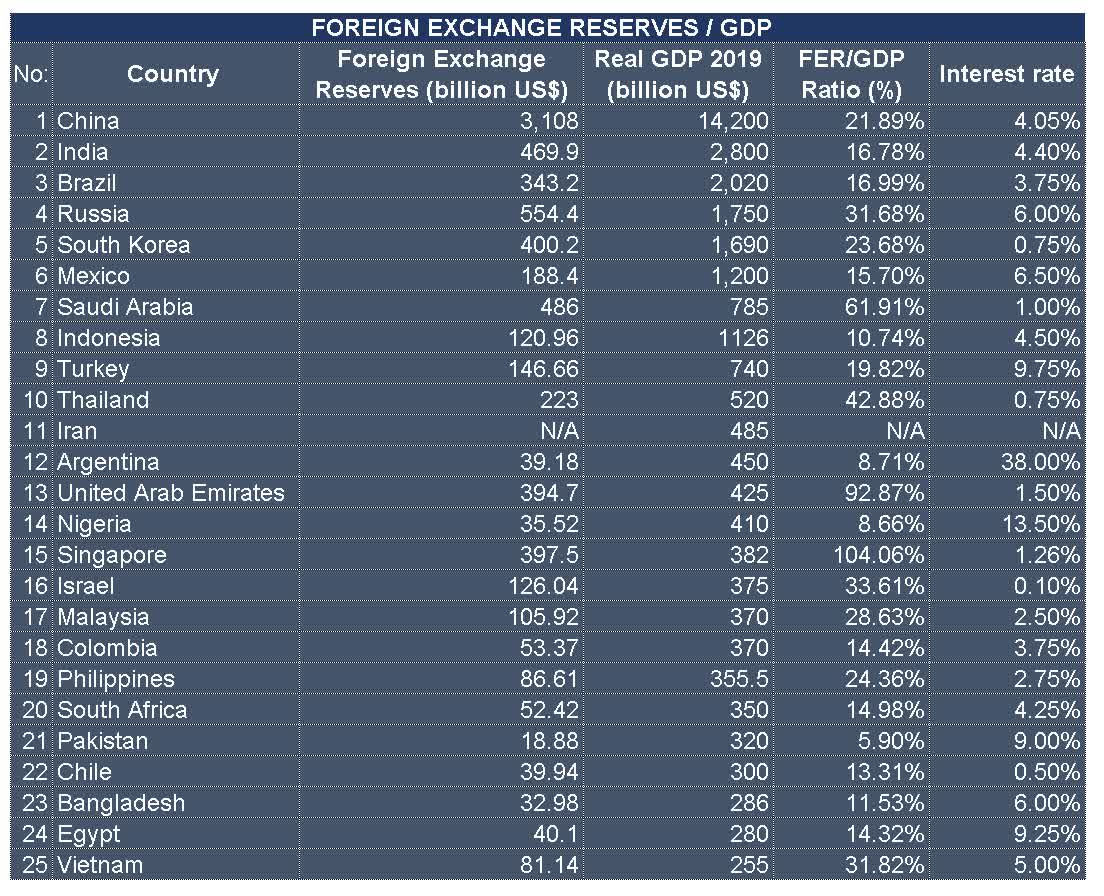
Source: Created by the author based on data provide by World Bank, Trading Economics and CEIC
It’s obvious that without foreign debts, the majority of these countries will not be able to provide adequate stimulus packages to eliminate the short- and mid-term consequences of the slowdown. Unless they chose devaluation of currencies with more negative impact on the local economies, including domestic demand contraction.
Of course, the final results will depend on a broad set of factors determined by the specifics of these economies and the effectiveness of decisions made.
In addition, long-term political and economic stability in these countries will depend on these measures, and this should be a matter of concern. But this topic requires a separate and substantial study, while our task is to assess the impact on financial markets in the short term.
Based on all above, we believe that investors interest in emerging markets will continue to decline in the near future, pushing them towards more stable markets to minimize the risks.
Why the US stock market is the best for long-term investment
Money flowing from emerging markets seeks for a safe haven. But at the same time, these behavioral models are also informed by past experiences. In addition, given the structure of this capital, most of which is subject to benchmarks or simple interest rates, they are looking for at least some opportunity to make a profit.
Let’s go back to our introduction and list the major factors as per our projection:
- GDP
- Population
- GDP per capita
- Ease of Doing Business
- Corporate Tax
- Human Capital Index
- Median age
- Freedom of capital movement
- Access to the capital market
- The stability of the political system
- Separation of branches of government and development of democratic institutions
- IP protection
Now let’s compare the Group 7 (G7) countries. We are going to use 1-7 scoring, where 1 is less attractive level, while 7 is the highest among these countries. We combined paragraphs 8-12 into one for these countries (as the differences are not meaningful), and gave a maximum 7 points value for this aggregate.
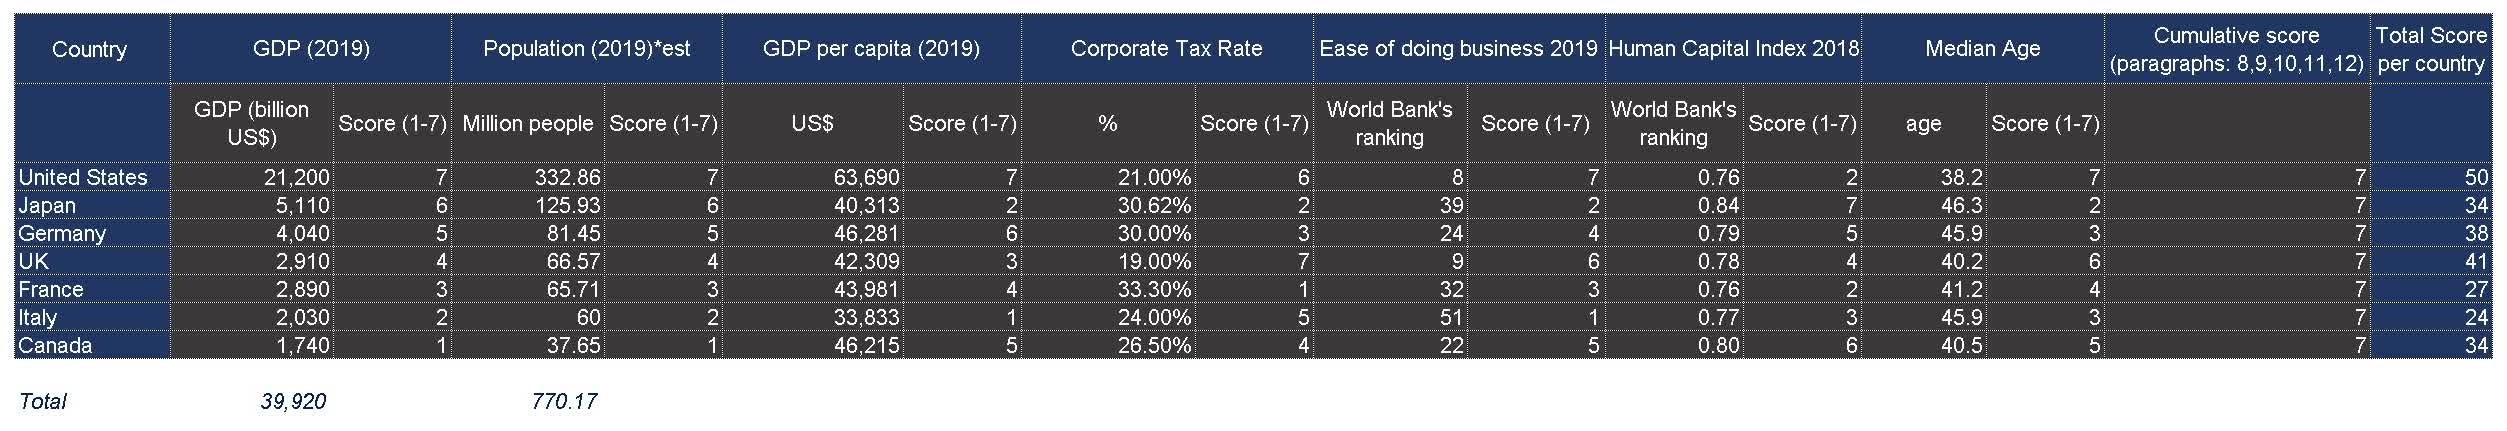
Source: Created by the author based on data provide by World Bank, CEIC, Trading Economics and Statista
As of December 2019, the US accounted for 53.10% of GDP and 43.2% of the total population of G7. It also possesses best cumulative total score in multiple indexes among these countries. Moreover, the US economy looks less fragile in terms of export dependence, shaping a positive sentiment among investors.
In addition to being a temporary safe haven for the inflow of capital, US stimulus packages and the Fed’s approach create optimism among investors about the future of the economy.
Our short-term strategy
An amazing situation is observed when essentially negative news is perceived by the market as a signal for growth, just because they are not as bad as expected.
Investors are trying not to miss a chance, and this creates a situation when the market is trying to evaluate the return to past indicators much more forward.
The chart below shows sentiment-driven actions in the market in March-April 2020:
Source: Created by the author based on YCharts data
We ourselves have opened a number of long positions between March 12 and 20, 2020. Though we have concerns regarding the short term, we believe that in a long-term perspective, the US stock market will be even more attractive than it was before.
But how adequate are our actions, and do they reflect the reality? Too optimistic expectations may contribute to further disappointment.
Moreover, does this chart reflect an inevitable slowdown and a decrease in global demand and US GDP contraction?
In our opinion, the current rapid growth, supported by the Fed’s decisions and positive sentiment, is not the beginning of long-term growth, and we can witness a rapid profit-taking at current levels. We call this phenomenon bipolar market disorder, where a period of euphoria may be changed by a depression, and this may continue until the 4th quarter of 2020.
We believe that the decline in revenue of many of the largest companies is not yet reflected in their stock prices. The data for the first quarter reflects only preliminary consequences, and quarterly reports for Q2 2020 will be more indicative in this term. Though a serious drop in the first and second quarters may be short term, the revenues may not return to the previous levels until 2H 2021.
So far, the leading indicator in this situation is unemployment data, which may become a major driver of sentiment in the near future. On April 23, 2020 initial jobless claims added 4.427 million, reaching 27 million over the last 5 weeks.
Obviously, this is the result of strict quarantine measures, and we expect serious improvement when quarantine measures are lifted. But unfortunately, not all jobs can be restored in a short time. Sectors such as tourism, aviation and services will not be able to return to the pre-crisis level for some time. Which, in turn, implies a contraction in domestic demand from several quarters.
Here is the list of industries which may not return to the pre-crisis level for some time:
- Hospitality & Leisure
- Aviation
- Arts, Entertainment, and Recreation sector
Let’s take a look at employment statistics in these industries:
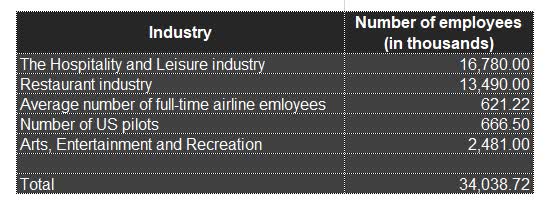
Source: Created by the author based on data provided by Hospitality industry: employees US 2019 | Statista; Restaurant industry: employees US 2019 | Statista; Employment in the U.S. aviation industry; Arts, Entertainment, and Recreation: NAICS 71
It’s obvious that it will be difficult to achieve a full recovery without substantial efforts to reorganize the structure of labor demand.
Recently, we observed an interesting correlation between Google Search trends and real unemployment data:
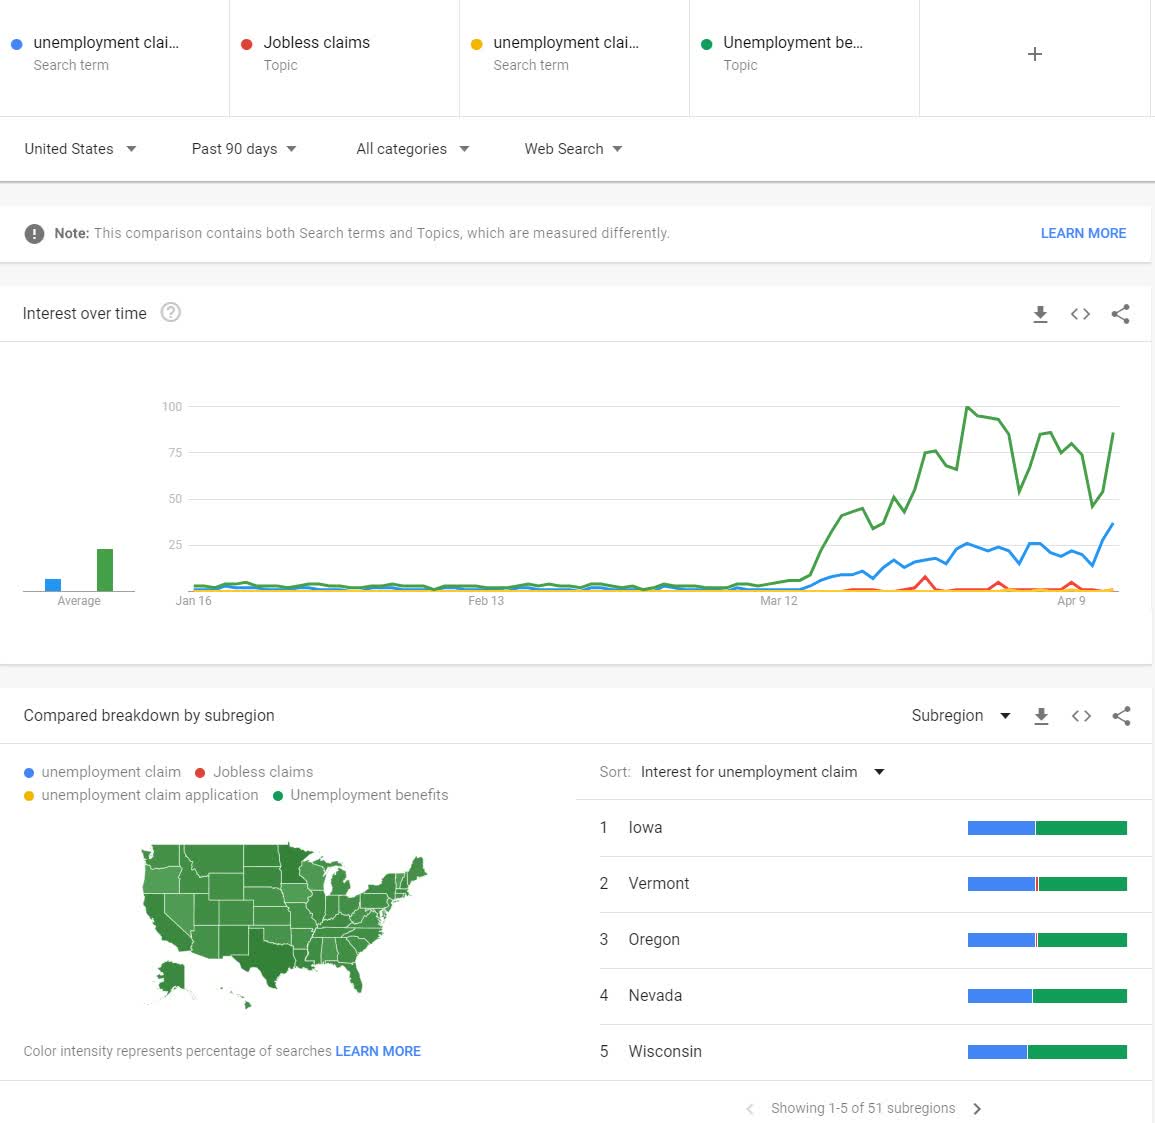
Source: 90 days’ search data by Google Trends
While “jobless claims” and “unemployment claims” correlated with data release dates, the interests in “unemployment benefits” reflected direct trends in the indicator itself.
The below chart represents the last 30 days:
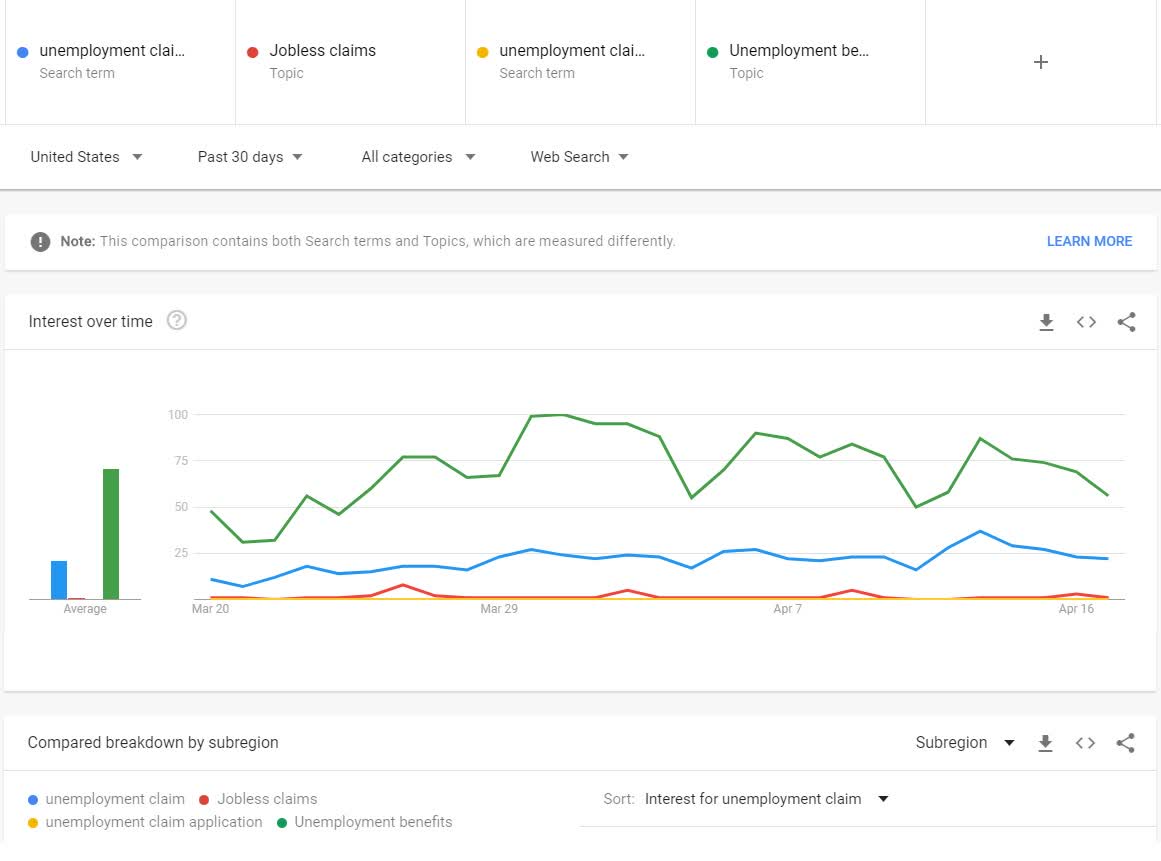
Source: 30 days’ search data by Google Trends
We think that unemployment claims may reach 30 million by the first week of May 2020 (countdown since states started shutting down).
Although overall our long-term expectations are optimistic, our short-term expectations are more pessimistic.
Very briefly about our long-term expectations
As we have already stated, the long-term trends that have developed recently will only intensify. Recent events have shown the importance of the proximity of product sources to markets. Even before the current crisis, we have witnessed an increase in protectionist sentiment in major economies. The situation with COVID-19 only exposed the fragile aspects of the previous model of trade relations. At the same time, this created a unique opportunity for the largest economies to reorganize the structure of their economies. Of course, there is no way to cancel globalization, but there is no need to. These trends will only make adjustments to improve the situation with imbalances. Imbalances are not only in the allocation of resources and trade. Imbalances in the internal models of participants of the global economy.
We are on the verge of change, when countries will have to pay attention to imbalances within domestic economies, including improving the well-being of their citizens and a more equitable distribution of resources, which can give an impetus to internal development and the creation of more durable socio-economic models, including investments in education, healthcare, infrastructure, etc. Only after that we can move on to the next stage of global integration. The measures taken by countries now will determine their long-term future.
We think it’s better to wait for the short-term correction
We are observing faster recovery of XBI compared to SPY. Obviously, this is due to optimistic expectations of investors regarding the future of the sector itself and, as we have said, the growth of health care spending and increased focus on biotechnology in general.
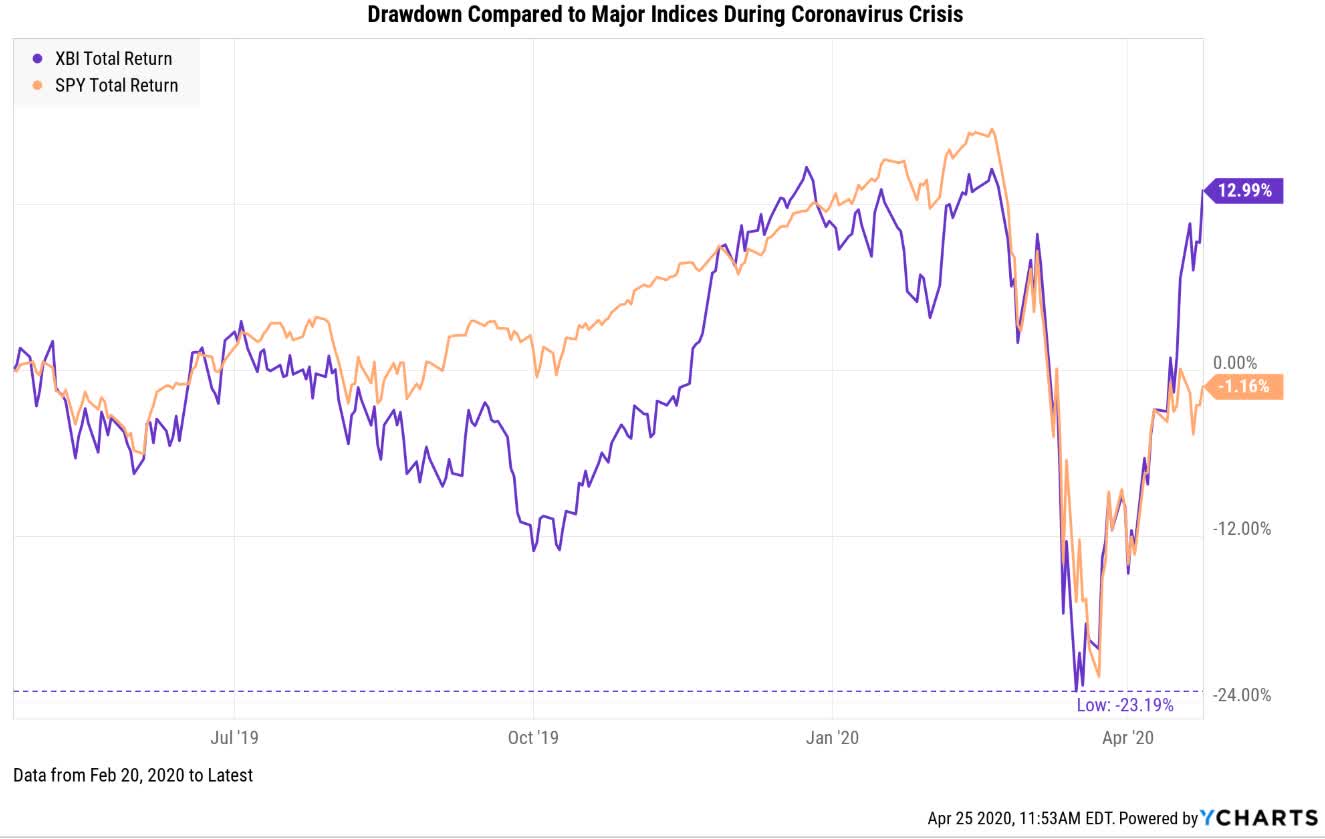
Source: XBI/SPY total return 1Y chart by YCharts
In our opinion, a strong drop was a result of panic sales caused by the prevalence of small-cap and mid-cap companies in XBI. In extreme situations, investors tend to choose less risk than the high-reward opportunity associated with the prospects of the pipelines of these companies.
Many believe that most of XBI’s holdings can be too risky assets in an uncertain environment, and this is partly true. However, even without considering the pipelines and prospects of these companies, many of them are better prepared for negative conditions than it seems.
We would like to quickly look through these companies and understand how long they can sustain without additional funding, without taking into account the expected positive catalysts and the fact that many of them are expected to multiply their revenues in the coming years.
Here are the current holdings of XBI:
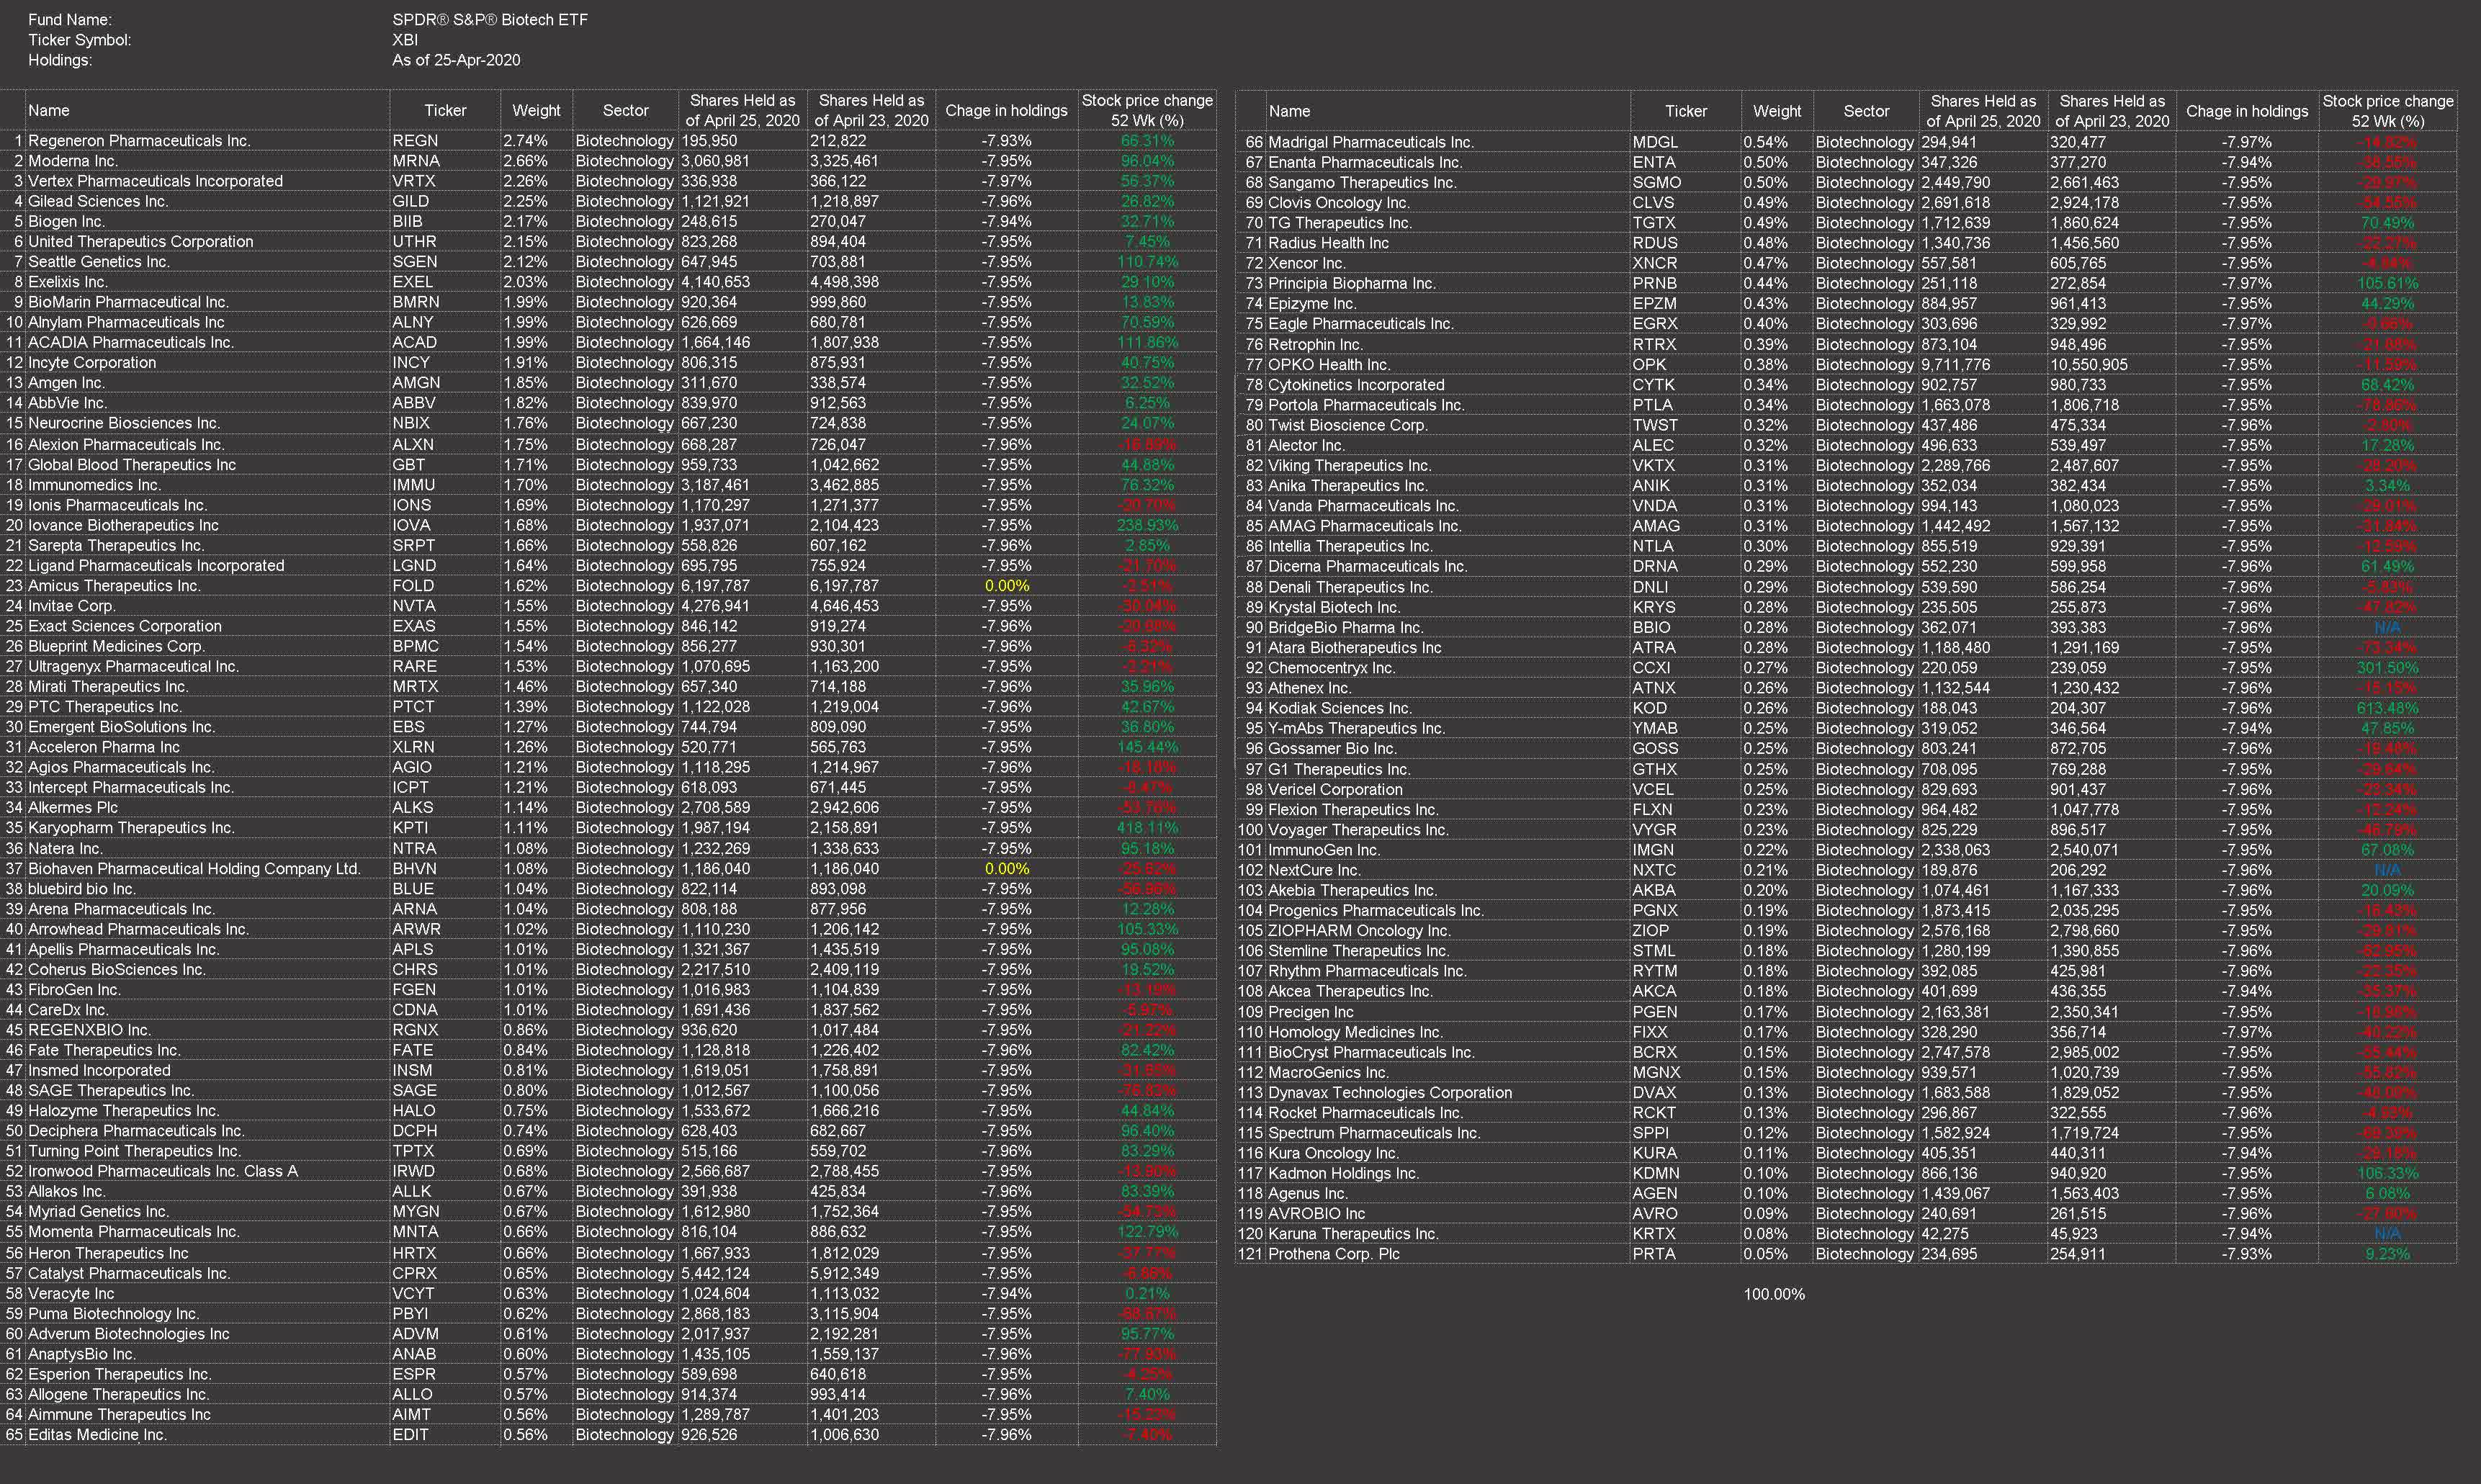
Source: Created by the author based on XBI – SPDR S&P Biotech ETF – Holdings – Zacks.com
76 companies account for about 90% of the fund’s holdings.
Let’s exclude large-cap companies generating positive cash flow (accounting for 16.75% of XBI’s holdings):
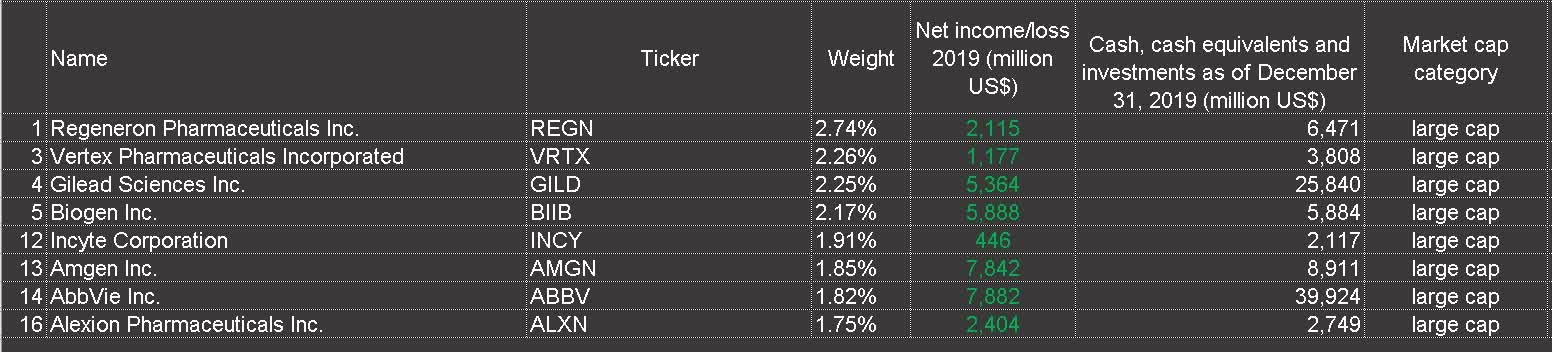
Source: Created by the author based on latest respective 10-K SEC forms
Mid- and small-cap companies with positive cash flow account for 14.83% of its holdings:
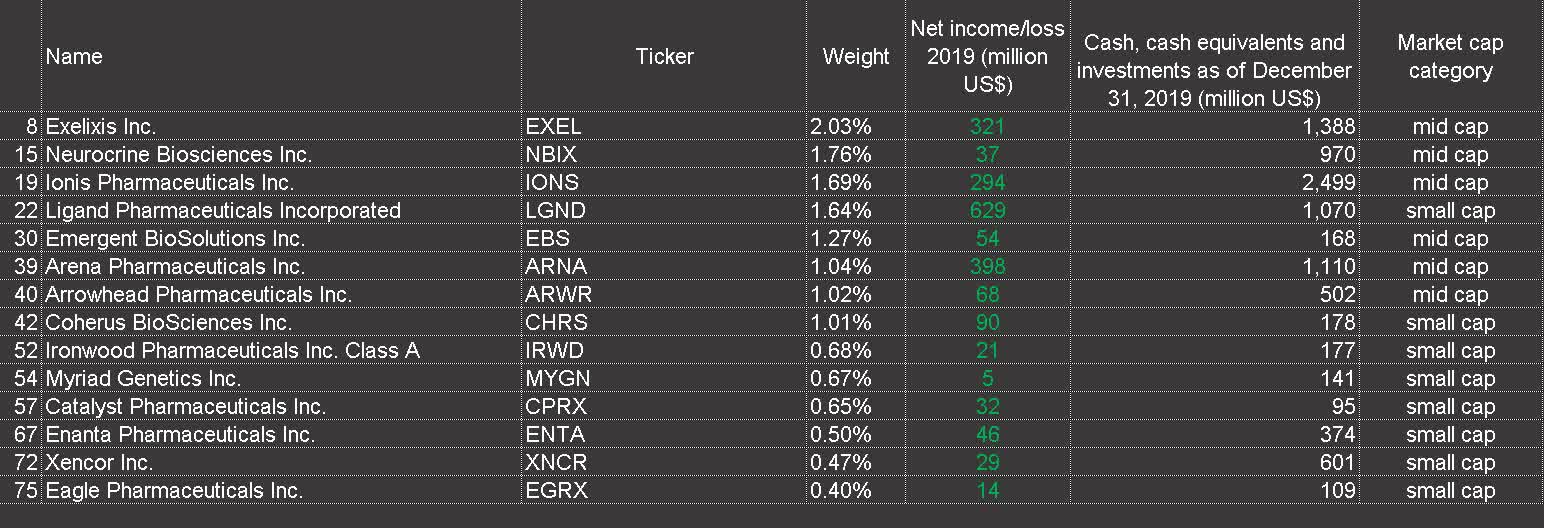
Source: Created by the author based on latest respective 10-K SEC forms
Of the remaining companies included in these 90%, only two might need additional funding within 12 months:
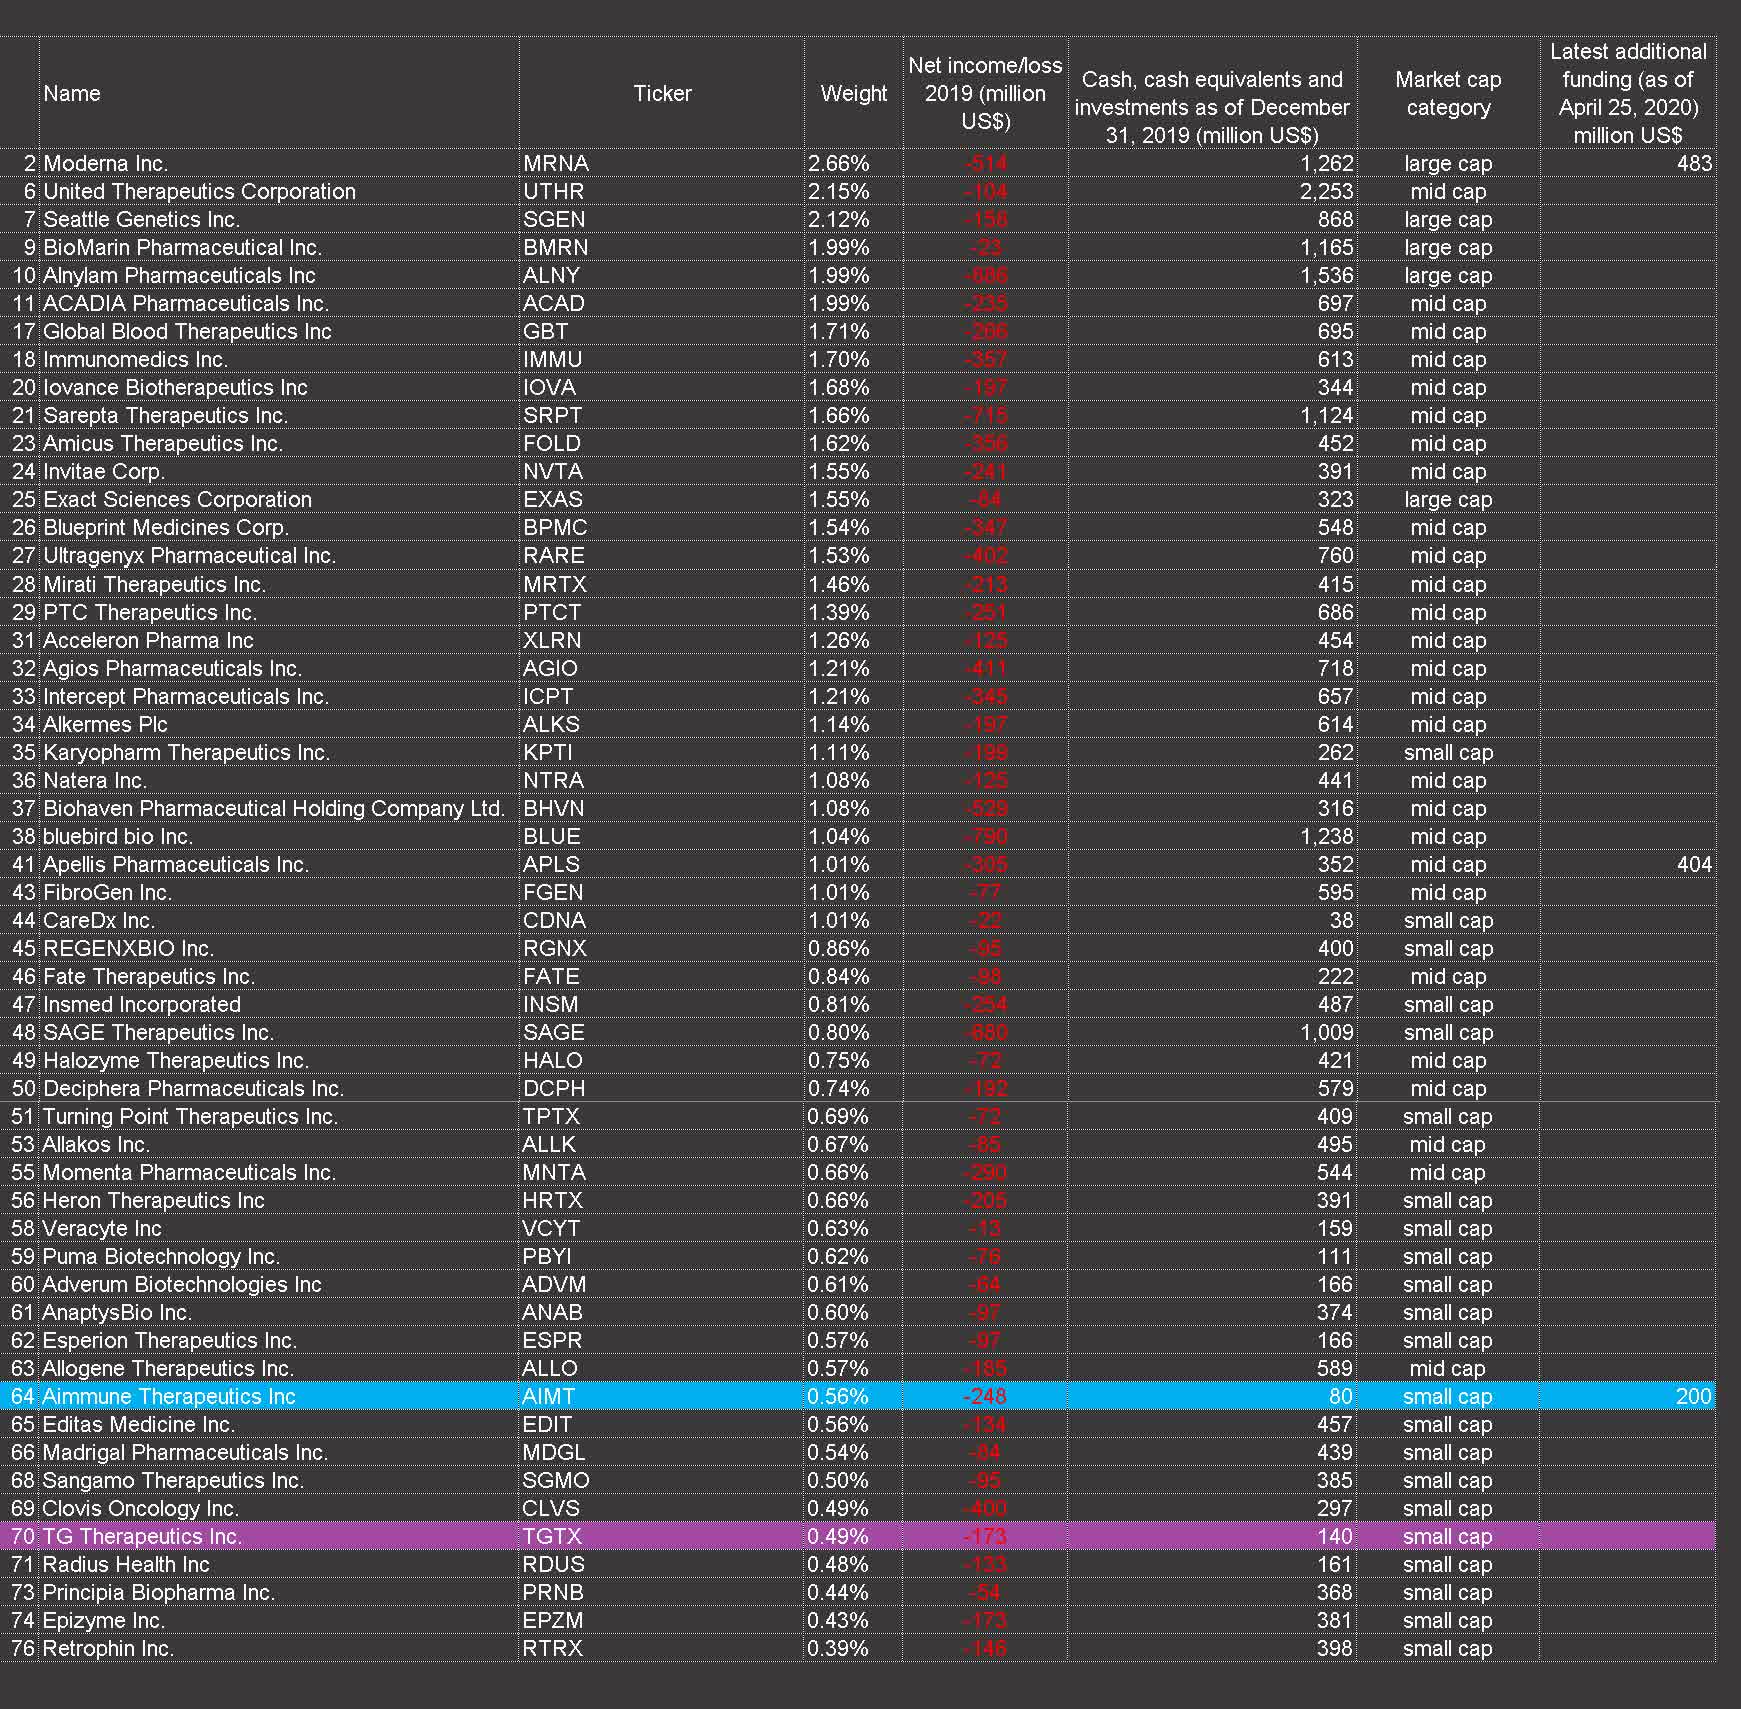
Source: Created by the author based on latest respective 10-K SEC forms
These are Aimmune Therapeutics (AIMT) and TG Therapeutics (TGTX).
However, Nestle’s (OTCPK:NSRGF) additional $200 million investment in Aimmune Therapeutics improved the company’s cash balance and allowed it to continue commercialization activities after its peanut allergy drug was approved by the FDA.
TG Therapeutics accounts for 0.49% of XBI’s holdings. The company initiated rolling submission of an NDA for Marginal Zone Lymphoma (MZL) and Follicular Lymphoma indications to the FDA, expecting a number of catalysts in the short-term period.
Thus, summarizing the above, although mid- and small-cap companies prevail among XBI’s holdings, they look prepared to continue the development of the respective drug pipelines in 2020. Again, we should emphasize that this quick check does not include the assessment of drug pipelines of companies, which, of course, are of greater importance.
We believe that one of the consequences of current situation will be a change in behavioral patterns. This will increase the focus on the new treatment options for chronic diseases, including but not limited to cardiovascular diseases, diabetes, obesity, NAFLD, NASH, pulmonary diseases etc. In this regard, we expect an increase in investor interest in the biotechnology industry as a whole.
In this context, XBI can be an attractive asset for passive investment.
A long-term buy signal and conclusions
A more detailed discussion of possible transformations, including the change in behavioral patterns, is part of a separate article, and here, we want to only briefly share our own steps.
In our opinion, US stock market possesses the best prospects among the worldwide investment opportunities. The question of the quality and capabilities of the healthcare system in the medium term will be the most important aspect for ensuring the vital functions and strength of the economy and the society as a whole – an aspect of equal importance to national security issues.
We believe that XBI will outperform SPY in a short-term perspective. Though we expect some correction in the short term, we will consider this correction as a good entry point.
According to the Centers for Medicare & Medicaid Services (CMS) U.S. health care spending reached $3.6 trillion or $11,172 per person, in 2018 (17.7% of GDP). We expect substantial growth in healthcare spending this year. This will support further growth in the biotechnology sector as well.
Regarding SPY, we think that more broad actions should be taken to ensure the sustainable recovery and respond in a timely manner to the challenges of the new situation. These actions may substantially decrease the impact of the crisis on the US economy and reshape the workforce market.
In our opinion, the possible adoption of the new infrastructure bill could be a such solid Buy signal for SPY in the long term.
To be continued…
Disclosure: I/we have no positions in any stocks mentioned, but may initiate a long position in XBI over the next 72 hours. I wrote this article myself, and it expresses my own opinions. I am not receiving compensation for it (other than from Seeking Alpha). I have no business relationship with any company whose stock is mentioned in this article.
Be the first to comment