

Phynart Studio
Investment Thesis
United States Steel Corporation (NYSE:X) (“the Group”) can be considered as comprising 3 divisions – the U.S., Tubular, and Europe. The U.S. division covers the company’s U.S. flats and the mini-mill segments. The Tubular and Europe divisions are the U.S. tubular and USSE segments.
From 2013 to 2021, the main contributor has been the U.S. division. The Tubular division has not generated any cumulative returns. Europe, while profitable, currently faces market and supply risks due to the Ukraine invasion.
The market price of USD 23 per share (as of 2 Aug 2022) has already priced in the downside from Europe. I reached this conclusion based on a sum-of-parts valuation of X.
There has been recent news about a political settlement for Ukraine. When there is peace, the Europe division’s risk would be significantly reduced and would be a catalyst for re-rating.
The EPV of X was estimated to be USD 32 per share. This was based on a sum-of-parts valuation including contribution from Europe. As such, there is a sufficient margin of safety to invest in X.
Division Profile
In its 2021 Form 10 k, X broke down its business into 4 segments. However, from an end customer-product perspective, I would reclassify X into the following 3 divisions:
- U.S. – this comprises the reported U.S. flats and mini mill segments.
- Tubular – this is the reported Tubular segment.
- Europe – this is the reported USSE division.
The U.S. division is the biggest revenue contributor. Not surprisingly it is also the largest division in terms of tonnage shipped.
You can see from Chart 1 that since starting its restructuring plan in 2013, the revenue of X in 2022 is significantly higher than that in 2013. This was despite the reduction in overall tonnage shipped. Refer to Chart 2.
The main reason for this is the increase in the selling prices in 2022. Refer to Chart 3.
Chart 1: Revenue by Divisions (Author)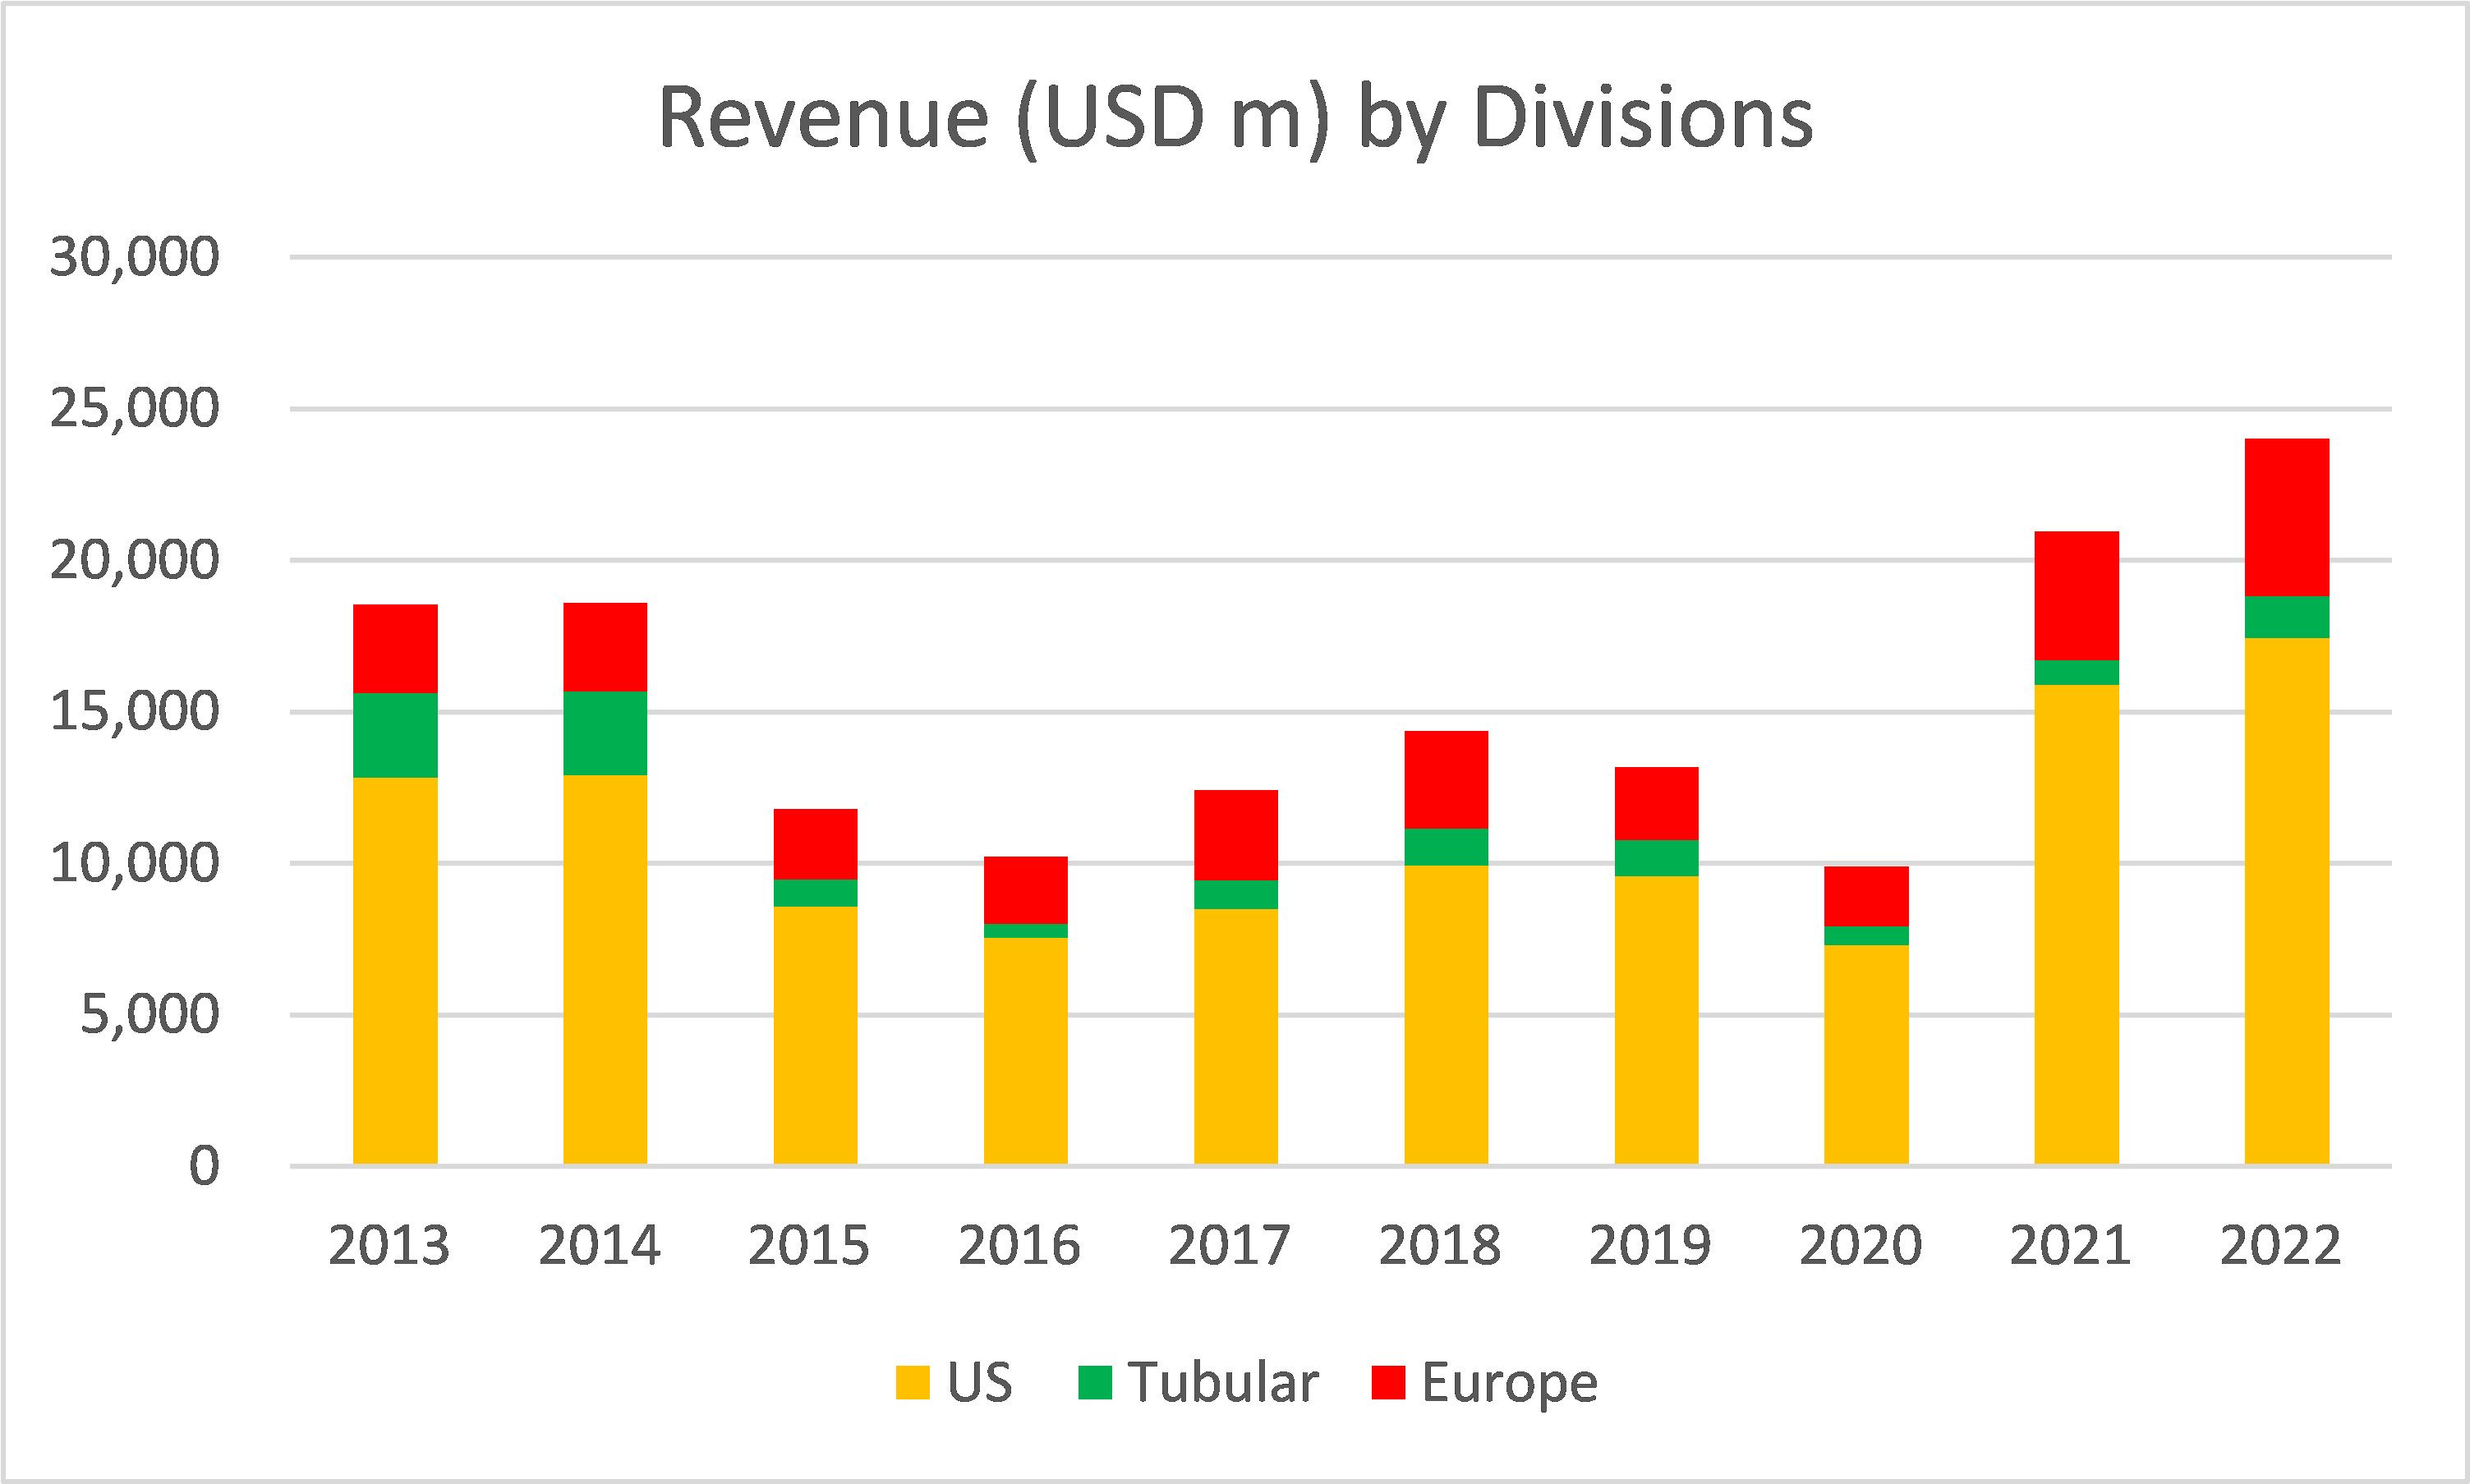
Notes to Chart 1:
1) The 2022 values were based on doubling the 1H 2022 values. These are probably optimistic projections given the company’s comments on the Q3 2022 performance.
2) I have not included the revenue from “Others”.
Chart 2: Shipment by Divisions (Author)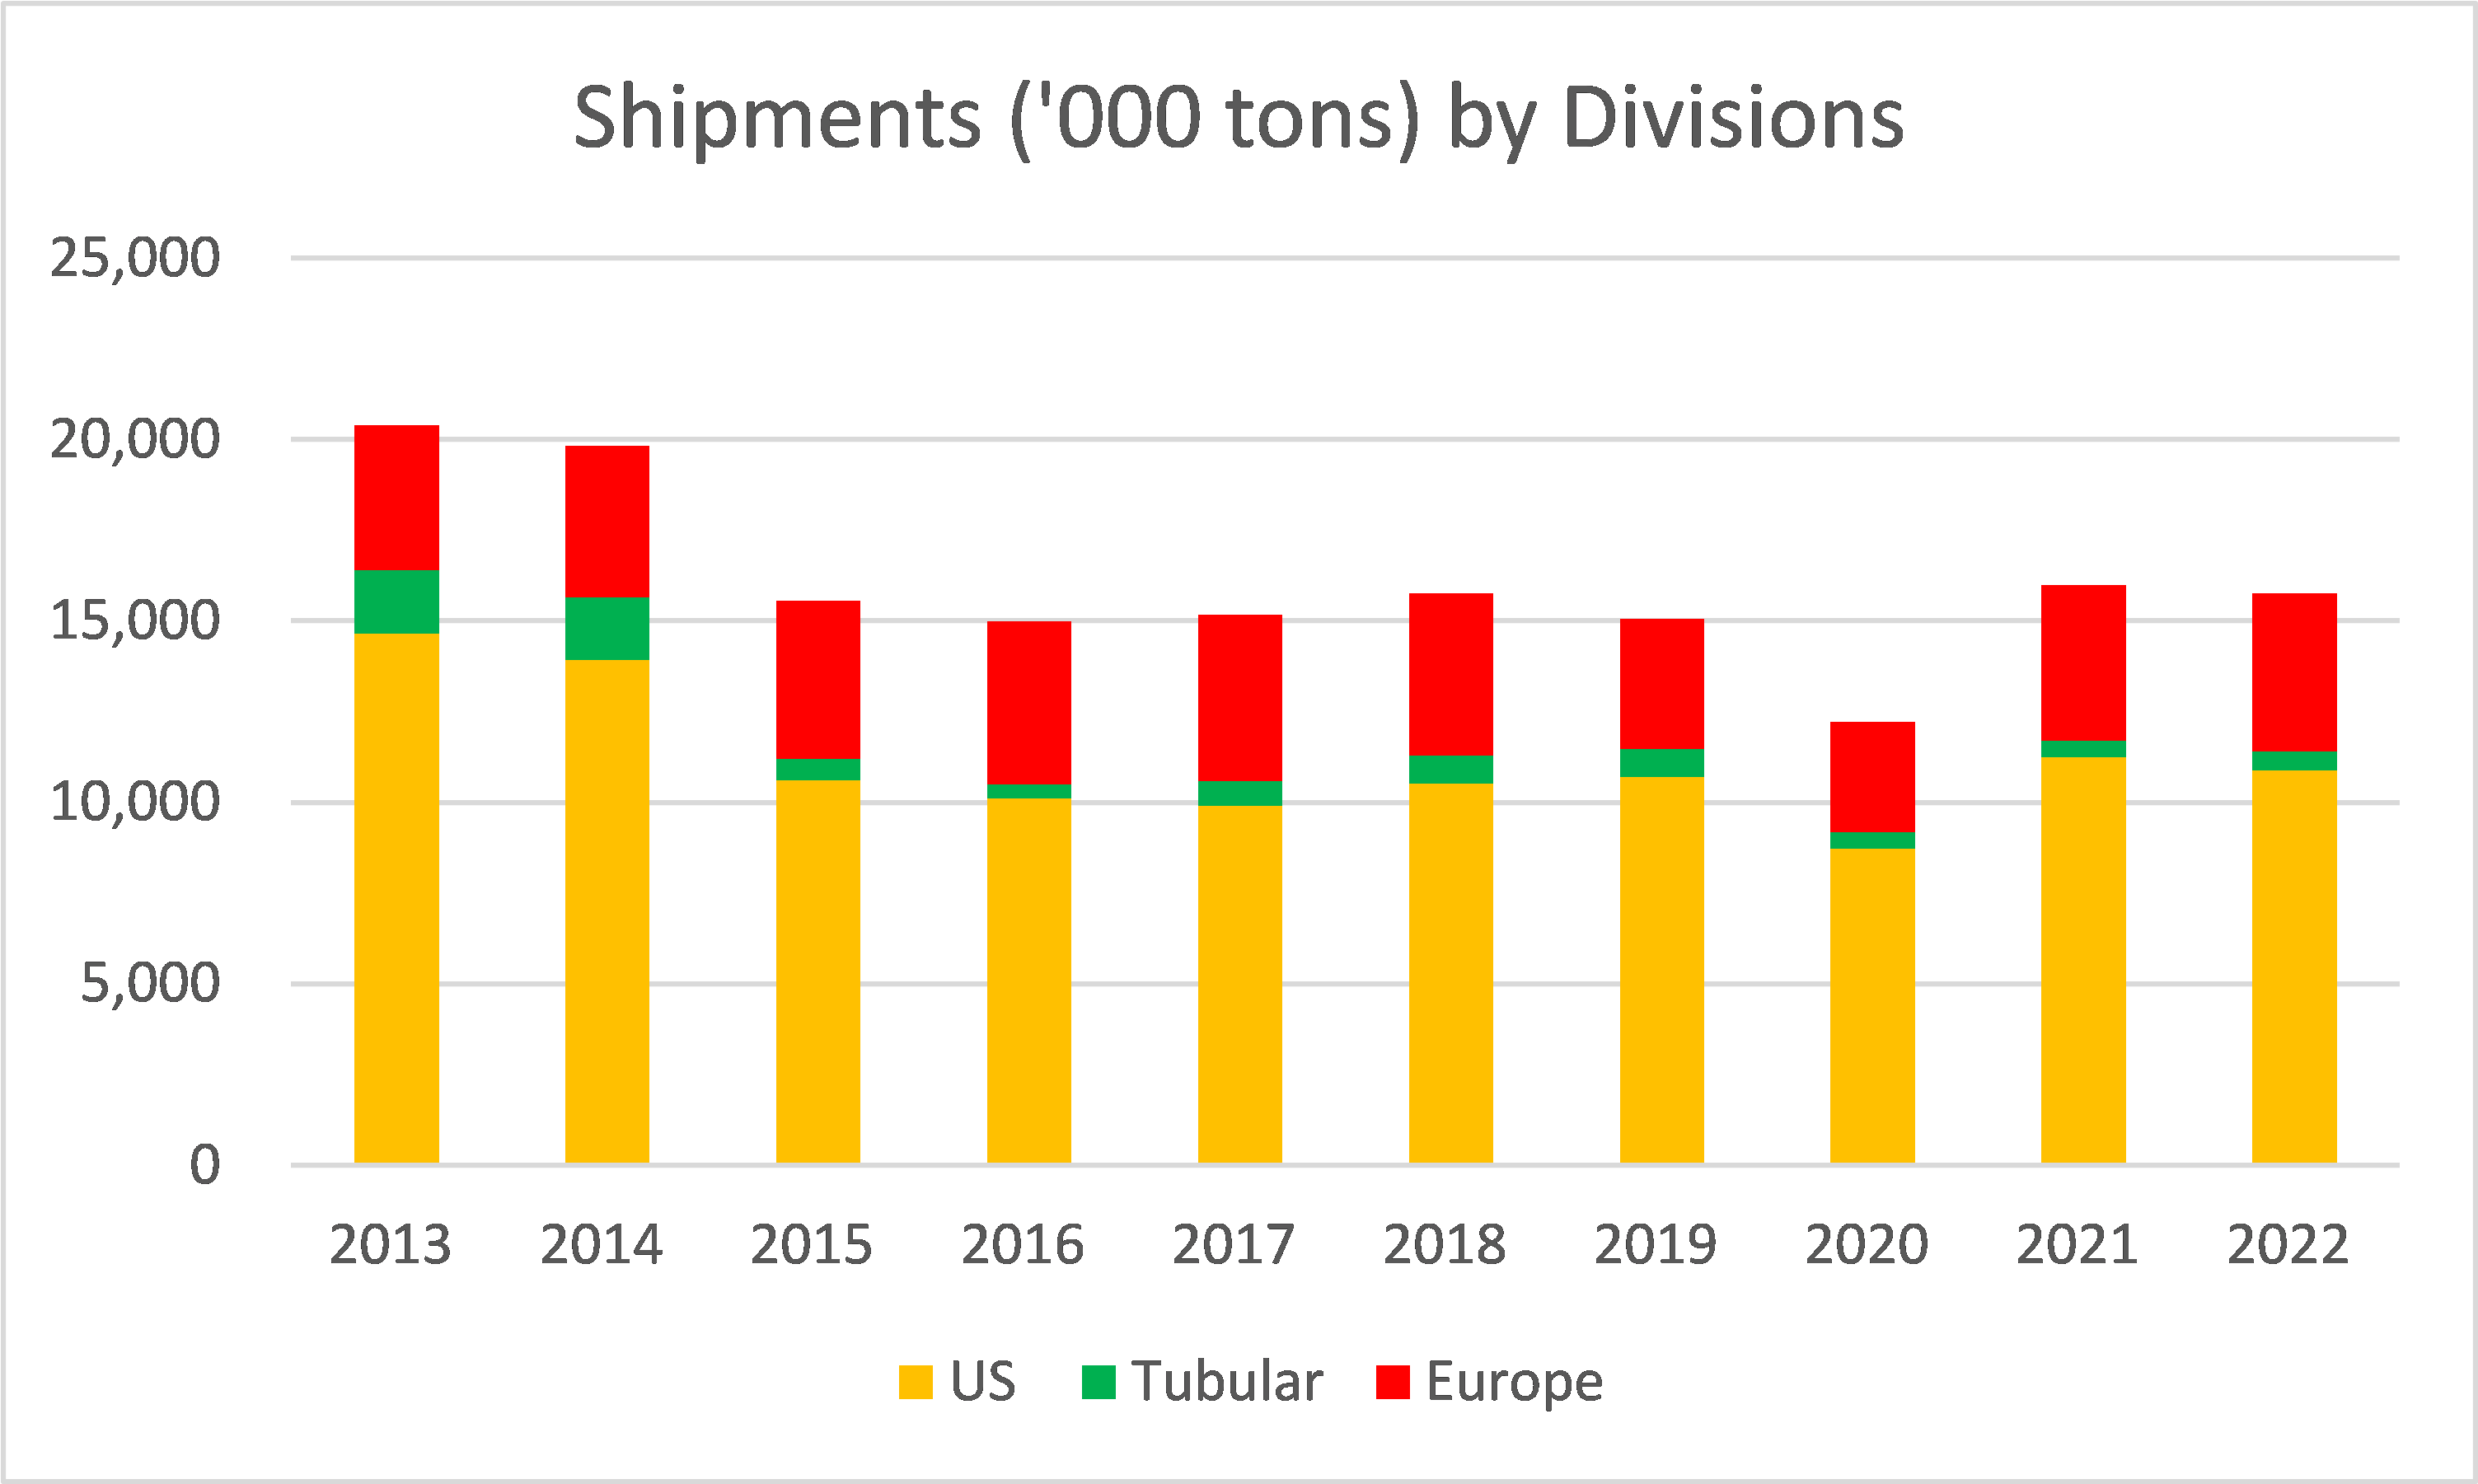
Note to Chart 2:
1) The 2022 values were based on doubling the 1H 2022 values. These are probably optimistic projections given the company’s comments on the Q3 2022 performance.
Steel is a commodity and prices, while cyclical, do vary by product category and region. The average selling prices for these 3 divisions as per Chart 3 illustrate this.
You can see that the Tubular division has the highest average selling price per ton. At the same time, while there are differences in the U.S. and Europe’s average selling prices, they move in the same cyclical pattern.
Chart 3: Average selling prices by Divisions (Author)
Note to Chart 3:
1) The 2022 values were based on the 1H 2022 values. These are probably optimistic projections given the company’s comments on the Q3 2022 performance. Nevertheless, I expect them to be higher than 2021.
The Total Assets of the Group increased from USD 13.1 b in 2013 to 17.8 b in 2021. X did not provide a breakdown of the Total Assets by segment in 2013. The oldest available information was for 2016. As can be seen from Chart 4, the bulk of the increase came from the U.S. division (from the investments in the mini-mill).
Chart 4: Total Assets by Divisions (Author)
Division Returns
The 3 divisions have different contributions to X.
- The U.S. division is the biggest contributor in terms of EBIT, Total Assets as well as average return. I measured the return = Average 2016 to 2021 EBIT/2021 Total Assets. Refer to Chart 5 and Table 1.
- Over the past 10 years, the Tubular division generates positive EBIT only 40% of the time. On average, the EBIT and returns were negative.
Chart 5: EBIT by Divisions (Author) Table 1: Returns by Division (Author)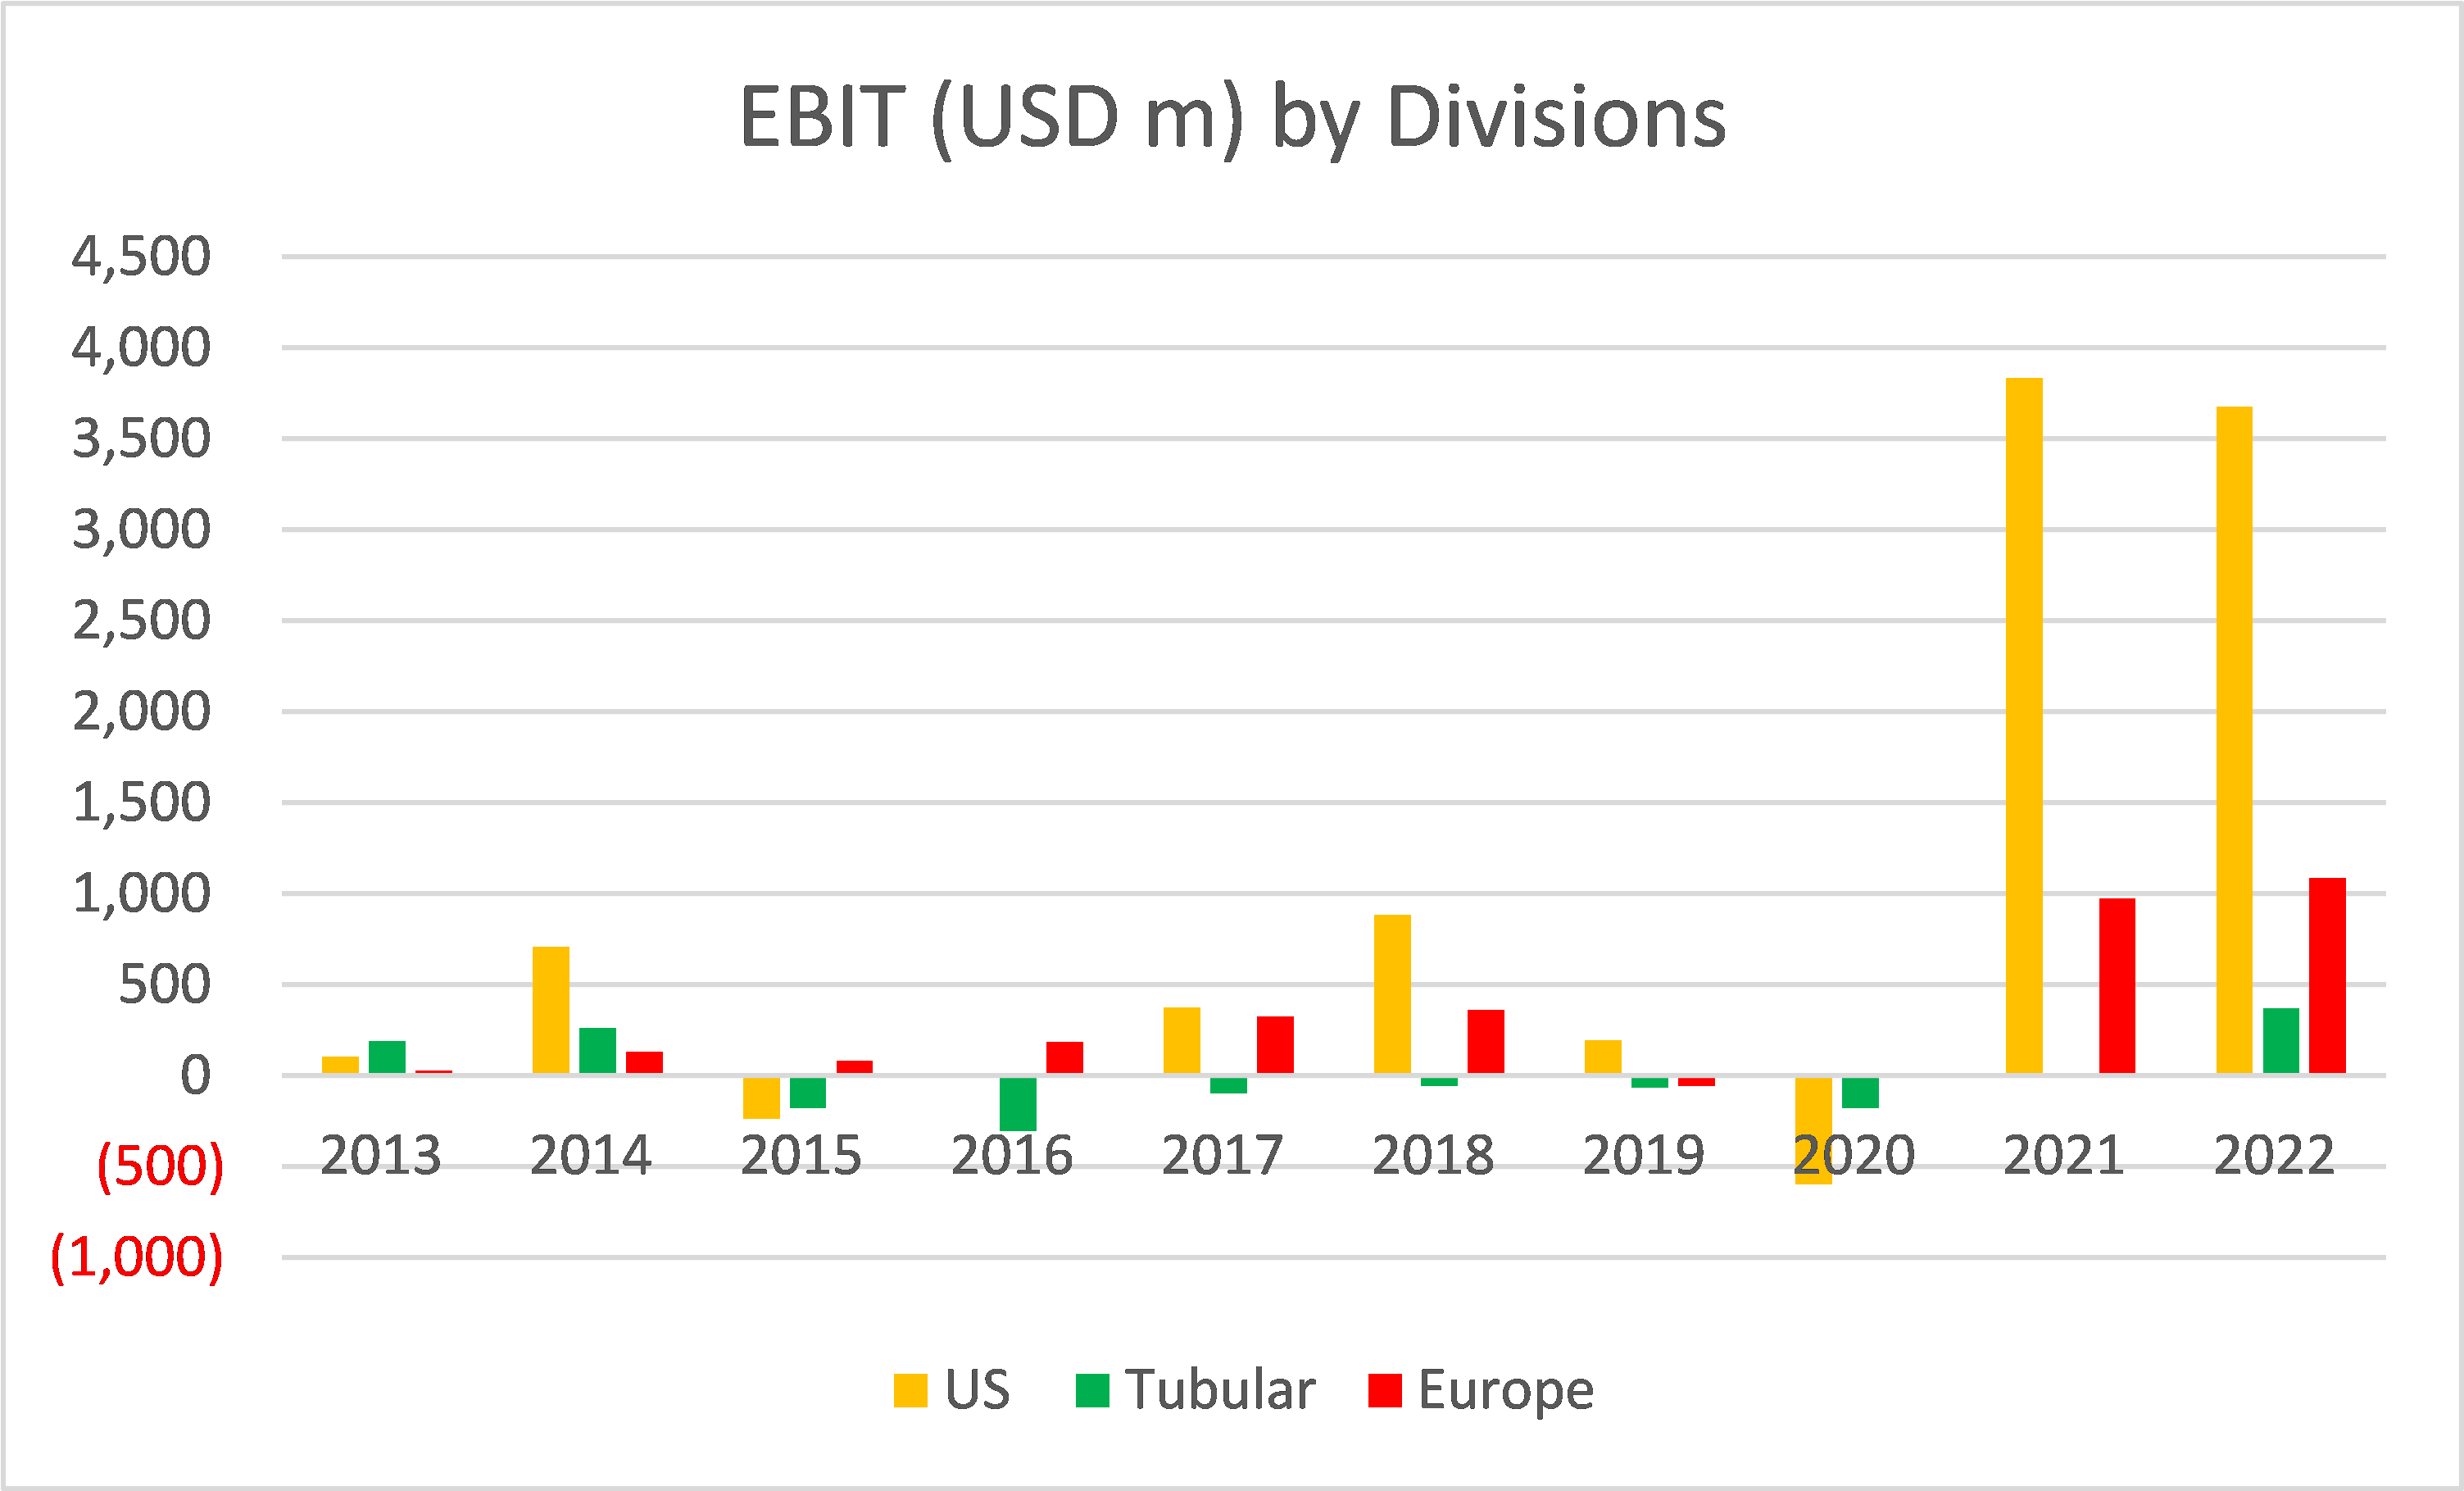
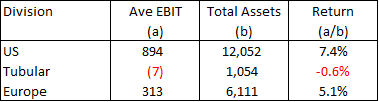
Note that the Total Assets of the U.S. division had increased substantially as per Chart 4. As such the return for this division as shown in Table 1 is probably understated. This is unlike the Tubular and Europe divisions where the changes in the Total Assets were less significant.
Valuation
In my June 2022 Seeking Alpha article, “U.S. Steel: A Different Group Than 9 Years Ago” I valued X as a group. For this article, I valued X based on the sum of the 3 individual division’s values.
I have chosen this sum-of-parts approach because the challenges and risks in the U.S. are different from those in Europe. At the same time, the customers for the Tubular division are affected by different economic forces than those for the flat products.
I valued the EPV of each of the 3 divisions based on a single-stage discounted free cash flow to the firm (FCFF) model. Note that the parameters for each of the divisions have different values.
EPV of the respective division = FCFF/r.
FCFF = EBIT (1 – tax rate). Note that I have assumed that there is no reinvestment under the EPV scenario.
EBIT = Gross profit – SGA.
r = WACC.
Gross profit = Revenue X Gross profit margin.
SGA = Revenue X SGA margin.
The value of equity = Value of firm – Debt + Cash & Securities.
The key assumptions used in the valuation are as per Table 2. The valuation was carried out as follows:
- I first determined the EPV of each of the divisions based on the respective parameters and assumptions – Step 1.
- I then sum up the value of the 3 divisions together with any non-operating assets to arrive at the total value of the firm. I next deducted the total Debt and Minority Interests to arrive at the sum-of-parts Equity value – Step 2.
Step 1
X did not provide a detailed breakdown of several of the parameters required for such a valuation. As such, I had to make certain assumptions as presented in the various notes accompanying the various tables.
Table 2: Sum-of-parts valuation assumptions (Author)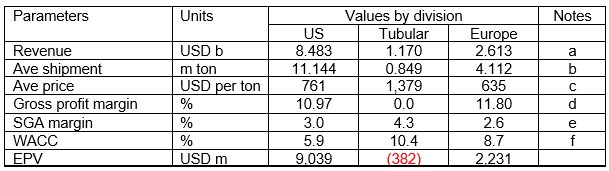
Notes to Table 2.
a) Ave shipment X Ave price.
b) 2013 to 2021 average.
c) 2013 to 2021 average at 2013 prices factorized as per Table 3.
Table 3. Note that the Hot Roll Steel prices were extracted from Worthington Industries Form 10 (Author)
d) Derived as shown in Table 4.
Table 4 (Author)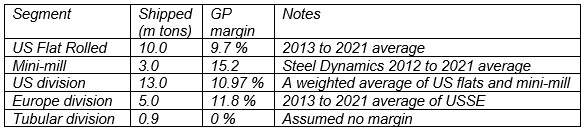
e) Respective 2013 to 2021 average. I estimate that the nominal SGA of each division = gross profit – EBIT. This was then used to proportion the actual SGA for each year for the respective division. The proportioned SGA was then divided by the division revenue to get the division SGA margin.
f) As per Damodaran’s CAPM approach based on the Table 5 assumptions.
Table 5 (Author)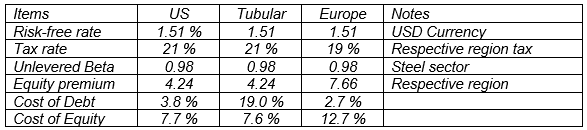
Note to Table 5.
The Cost of Debt was based on a synthetic rating. This in turn was based on the interest coverage ratio. The interest coverage ratio was based on the respective 2013 to 2021 average EBIT divided by the proportion of interest. The proportion of interest was the 2021 interest apportioned based on the 2013 to 2021 CAPEX as shown in Table 6. Note that the Debt Equity ratio for X was assumed to apply equally to all the 3 divisions.
Table 6 (Author)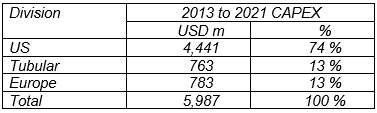
Step 2
The values of the various divisions are shown in Table 7.
Table 7: Sum-of-parts valuation (Author)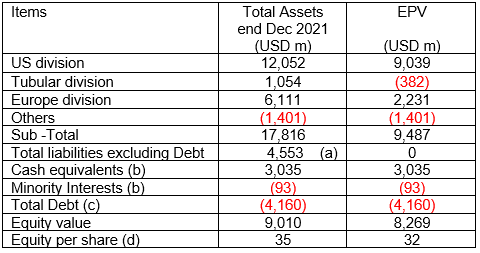
Notes to Table 7.
(a) Total liabilities as per end Dec 2021 Balance Sheet of USD 8,713 m less Total Debt.
(b) Based on Q2 2022.
(c) Based on Q2 2022. I assumed Book value = market value.
(d) Based on 259.3 million shares.
The values of X based on a sum-of-parts valuation are:
Asset Value = USD 35 per share.
EPV = USD 32 per share.
The key takeaways from this sum-of-parts valuation are:
- The EPV for the Tubular division is negative. This is because I have assumed zero gross profit margins based on the historical performance. Given that the historical margins are based on values over the cycle, you should question whether this is a division that X can manage.
- The EPV for the Europe division is lower than the Asset Value. The EPV reflects the higher risk as indicated by the high cost of equity. It suggests that the assets are not generating sufficient returns to cover the additional risks.
- The majority of the EPV for X came from the US division.
We know the risks of the Europe division. I do not know how bad this situation will become. But the strong U.S. division value implies that there is limited downside to the current market price for the following reasons.
- If we assumed that the Europe division contributes zero, the EPV of the Group comes to USD 23 per share. This is about the market price.
- Take the scenario where the Group divests the Tubular and Europe divisions at 50% of the Asset Value. The sum-of-parts value is then a combination of EPV for the US and the salvaged Asset Values for the Tubular and Europe divisions. This results in a value of X of USD 39 per share.
The scenarios suggest that any closure of the Europe division is manageable from an investment perspective.
Impact of 2022 Results
I am a long-term value investor with an average holding period of 8 years. As such I am not concerned about quarterly results. The exception is if it suggests that the Group is facing some unforeseen issues that would impact the long-term performance.
X is in a cyclical sector. From a long-term perspective, the performance over the cycle is more important than the quarterly results.
For Q2 2022, the Group is still benefiting from the high product prices. But as management had indicated, this seems to have peaked. This is not unexpected and it does not change my analysis and valuation as they were based on the performance over the cycle.
The main challenge facing the Group is not the coming downtrend in prices. It is the impact of the Ukraine invasion on the Europe segment. According to management, there should not be any impact for the third quarter.
“The Company has built up sufficient inventory on-site or in-transit to meet current customer demand. Efforts to secure alternate sources of supply are underway to continue meeting demand.” Form 10-Q, Jun 2022.
But there are risks thereafter.
“Additionally, in response to sanctions, Russia has limited supply of natural gas to certain countries…While not expected, if a natural gas crisis is declared in Slovakia, operations at our USSE division could be materially adversely impacted.” Form 10Q, Jun 2022
I have shown that the impact of this risk seems to have been factored into the current market price.
While I do not focus on the earnings, what is striking about the Q2 result is the free cash flow generated by the division. I used a simple measure of this as = cash flow from operations minus cash used in investing activities.
- For Q1 2022, the Group generated USD 419 million of free cash flow.
- For Q2 2022, the Group generated USD 655 million of free cash flow.
For the first half of 2022, the Group generated an equivalent of USD 1.07 billion of free cash flow. This is equivalent to about USD 4 per share that is available for dividends or share buybacks. Think of this as a margin of safety when compared to the market price of USD 23.
Historically from 2013 to 2020 (excluding 2021 due to the price hike), the average was a negative free cash flow of USD 84 million per year. You can see why I think the current free cash flow generation is extraordinary.
Catalyst
Look at the results of the divisional analysis and valuation. You can see that any additional contribution from the Tubular and Europe divisions can make a significant difference to the intrinsic value.
The Tubular division’s performance is tied to the performance of the oil & gas and petrochemical sector. The Europe division’s performance is tied to the Ukraine invasion.
Peace in Ukraine will likely impact the oil & gas and petrochemical sector. I expect higher demand but lower prices. In any event, I have assumed a negative contribution from this division in my sum-of-parts valuation. Any additional profits will be an improvement.
But peace in Ukraine will make a significant difference to the market for the Europe division’s products. It will also reduce the supply risks. In other words, expect a positive contribution so that the EVP of X will be USD 32 per share.
When will there be peace in Ukraine? Your guess is as good as mine. I am a long-term value investor holding stocks for 8 years. I cannot imagine a situation where the fighting lasts for so long. I expect peace within the next 8 years.
Conclusion
My analysis and valuation were based on the performance over the cycle. For example, I took the average U.S. division price as USD 761 per ton compared to the first half of 2022 price of USD 1352 per ton.
On such a basis and using a sum-of-parts valuation, I estimate X’s EPV to be USD 32 per share. Given the market price of USD 23 (as of 2 Aug 2022), the EPV provides a 40% margin of safety.
At the same time, taking the worst-case scenario where the Europe division has zero contribution, the EPV reduces to USD 23 per share. The analysis suggests that the market is pricing X as if the Europe division has zero contribution. I don’t think this is realistic. Even if the Europe division is discontinued, there would be some salvage value for the assets.
The valuation also assumes that the Tubular division does not have any significant contribution to X’s value. Again, I believe that there is some salvage value for the assets even if this division is shut down.
Furthermore, the Group has currently generated lots of free cash flow that can be used to pay dividends or buy back shares. This can be considered another margin of safety.
The downside for X in terms of the downturn in product prices and zero contribution from Europe has been factored into the market price. Also, my intrinsic value is also based on the performance of X over the price cycle. A political settlement and/or peace in Ukraine will be a catalyst for a re-rating of X.
Given the above, X is a safe bet at the current market price. But you need to have a long-term investment horizon.
Be the first to comment