


ArtRachen01/iStock via Getty Images
Introduction
Despite triple-digit oil prices earlier in 2022 as the world found itself short on supply, U.S. Silica (NYSE:SLCA) was still not out of the woods, proverbially speaking, as my previous article warned. Whilst the third quarter subsequently saw green shoots emerging for a tentative recovery, it would be prudent that investors do not get too excited as it remains far from certain whether these will continue growing bigger and stronger, metaphorically speaking, as discussed within this follow-up analysis.
Coverage Summary & Ratings
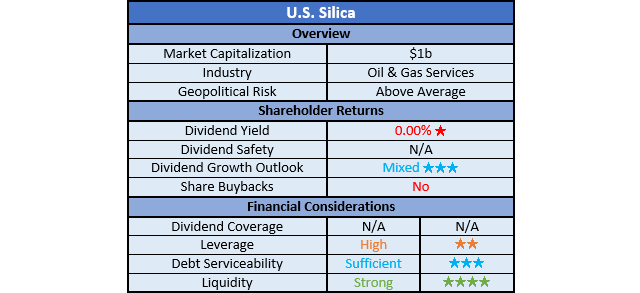
Since many readers are likely short on time, the table below provides a brief summary and ratings for the primary criteria assessed. If interested, this Google Document provides information regarding my rating system and importantly, links to my library of equivalent analyses that share a comparable approach to enhance cross-investment comparability.
Author
Detailed Analysis
Author
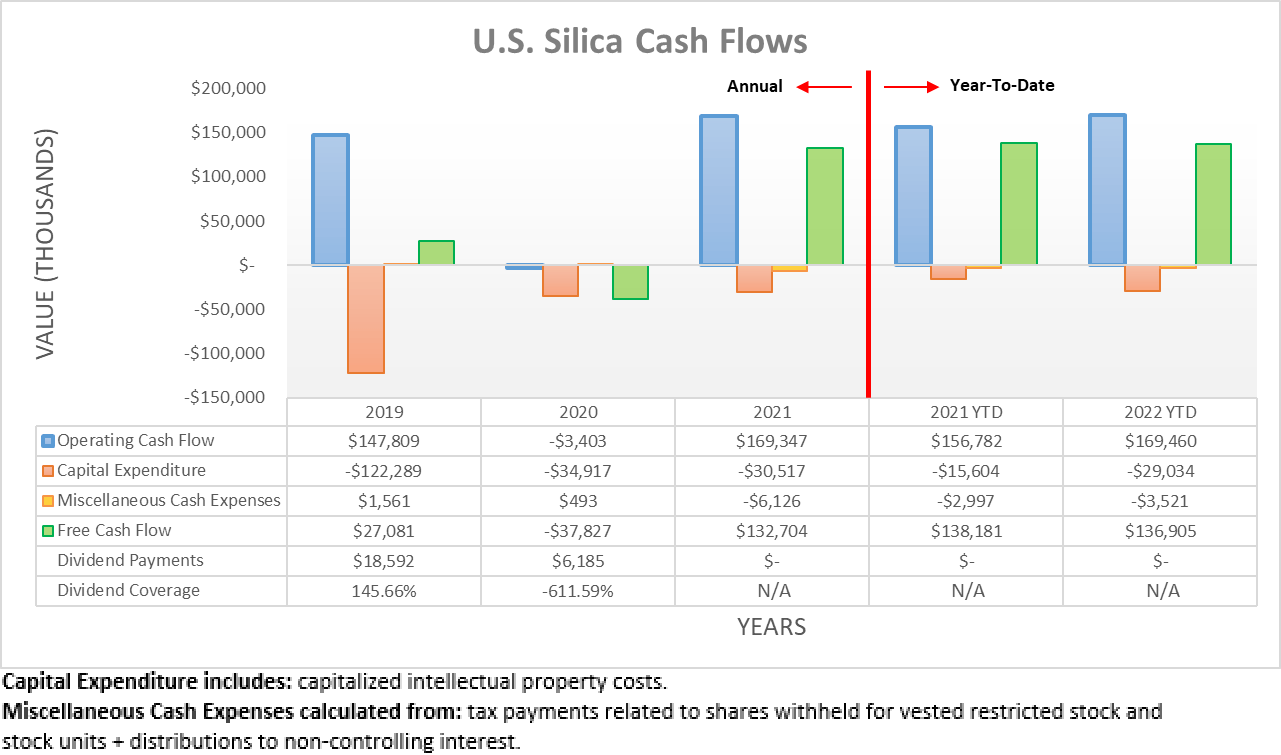
When previously reviewing their cash flow performance for the first half of 2022, it was disappointing to see neither the first nor second quarters producing year-on-year improvements versus 2021, when excluding their working capital movements. On the surface, their operating cash flow following the first nine months of 2022 seems promising with their results landing at $169.5m and thus a decent circa 8% higher year-on-year versus their previous result of $156.8m during the first nine months of 2021.
Author
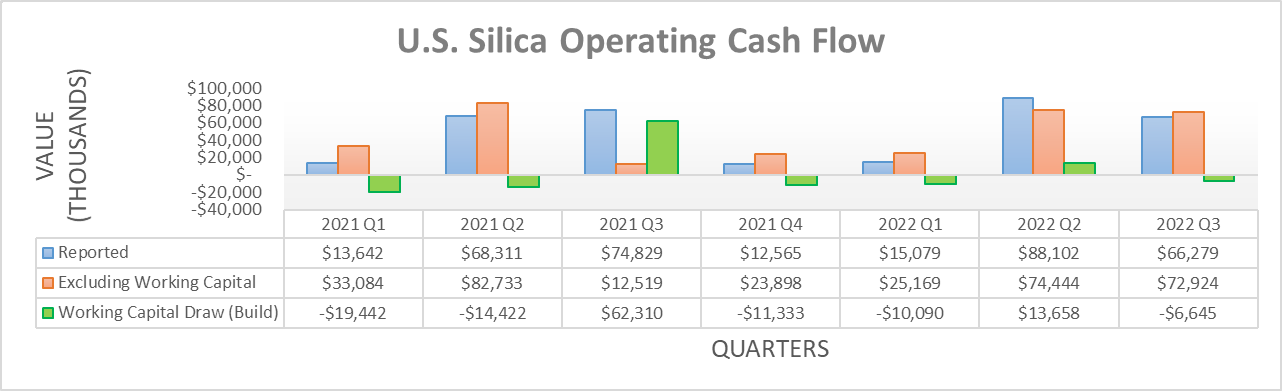
Unlike during the first half of 2022, thankfully these improvements were not simply due to working capital movements but rather, they saw fundamental improvements during the third quarter. When viewing their operating cash flow on a quarterly basis, it easily becomes apparent their underlying result of $72.9m that excludes working capital movements was many magnitudes higher year-on-year versus their previous equivalent result of only a mere $12.5m. Whilst it was broadly unchanged sequentially versus the second quarter of 2022 that saw an equivalent result of $74.4m, this still marks first time in years whereby they saw two quarters in a row with decent financial performance. This shows green shoots of a tentative recovery emerging, especially as these improvements were driven by both of their business segments, as per the commentary from management included below.
“These tremendous results were driven by continued robust customer demand in both business segments and outstanding execution by our talented team. We enjoyed a full quarter of price increases to fight inflationary impacts in our industrial segment, realized greater contract coverage and improved prices in sand proppant, and delivered further margin expansion in SandBox last-mile-logistics.”
-U.S. Silica Q3 2022 Conference Call.
I would not personally say their results were “tremendous”, although it was nevertheless positive to see their oil and gas proppants business segment performing well in conjunction with their industrial and specialty products business segment. Even though this is undoubtedly positive as things stand at the moment, it would be prudent for investors not to get too excited until this tentative recovery shows signs of being cemented into place, especially given the outlook heading into 2023.
Overall, their oil and gas proppants business segment, whereby they supply frac sand, comprises their biggest contributor to their financial performance, as it formed $82.3m of their total $131.8m segment margin during the third quarter of 2022. This near two-thirds weighting means the future of oil and gas drilling sees a sizeable influence on their future financial performance. Disappointingly, oil and gas drilling in the United States almost stagnated since the beginning of the third quarter with the total rig count barely increasing during the subsequent months, which sees no material improvements since my previous analysis. Meanwhile, the United States Energy Information Agency recently slashed their forecast for domestic oil production in 2023 by 21%, thereby pouring more cold water on hopes for a significantly stronger year ahead.
Elsewhere, their industrial and specialty products business segment sees risks heading into 2023 on the back of the gloomy economic outlook. Since many investors and economists are expecting a recession during 2023 as central banks rapidly tighten monetary policy to combat high inflation, it seems operating conditions for this business segment are more likely to deteriorate than anything else. When wrapped together, their recovery still remains a wait-and-see situation but at least if nothing else, the cash infusion during the third quarter of 2022 was still a welcomed surprise.
Author
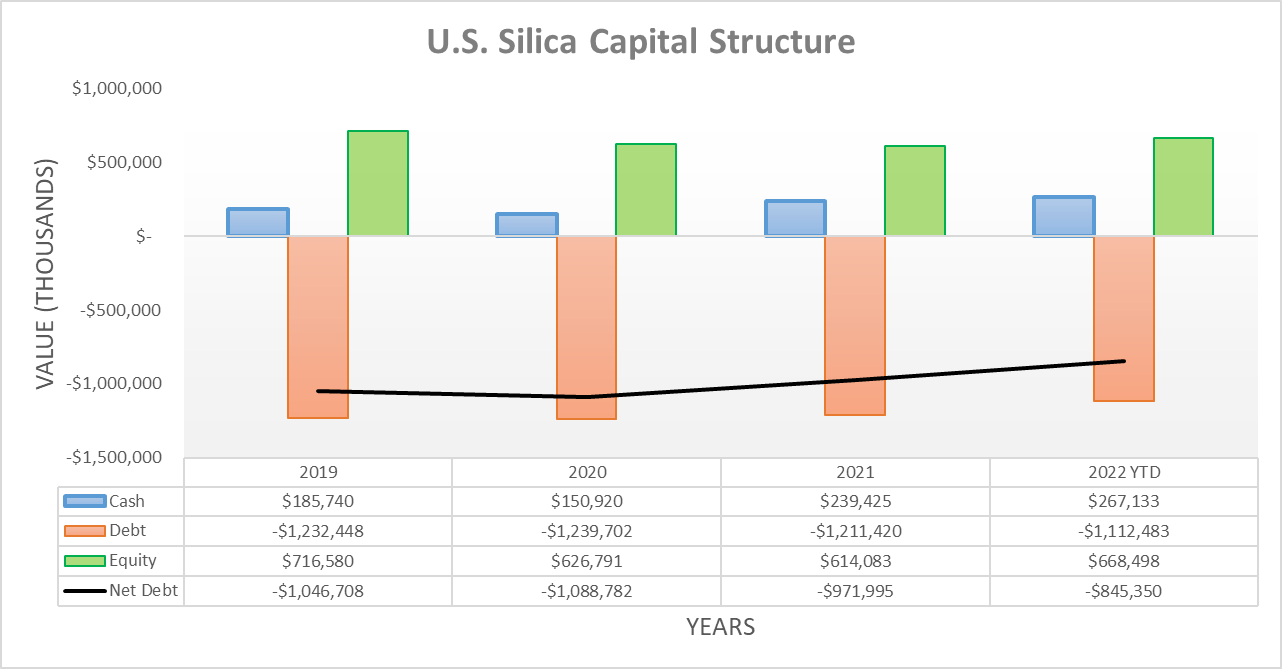
Thanks to their improving cash flow performance, they were able to push their net debt lower once again during the third quarter of 2022. After dropping to $892.2m following the second quarter, it now sits at $845.4m and thus a solid circa 5% lower after one quarter. Whilst obviously positive, there is still plenty more work remaining to shake the debt burden and if looking ahead, their ability to continue slicing away at their debt remains uncertain given the outlook heading into 2023.
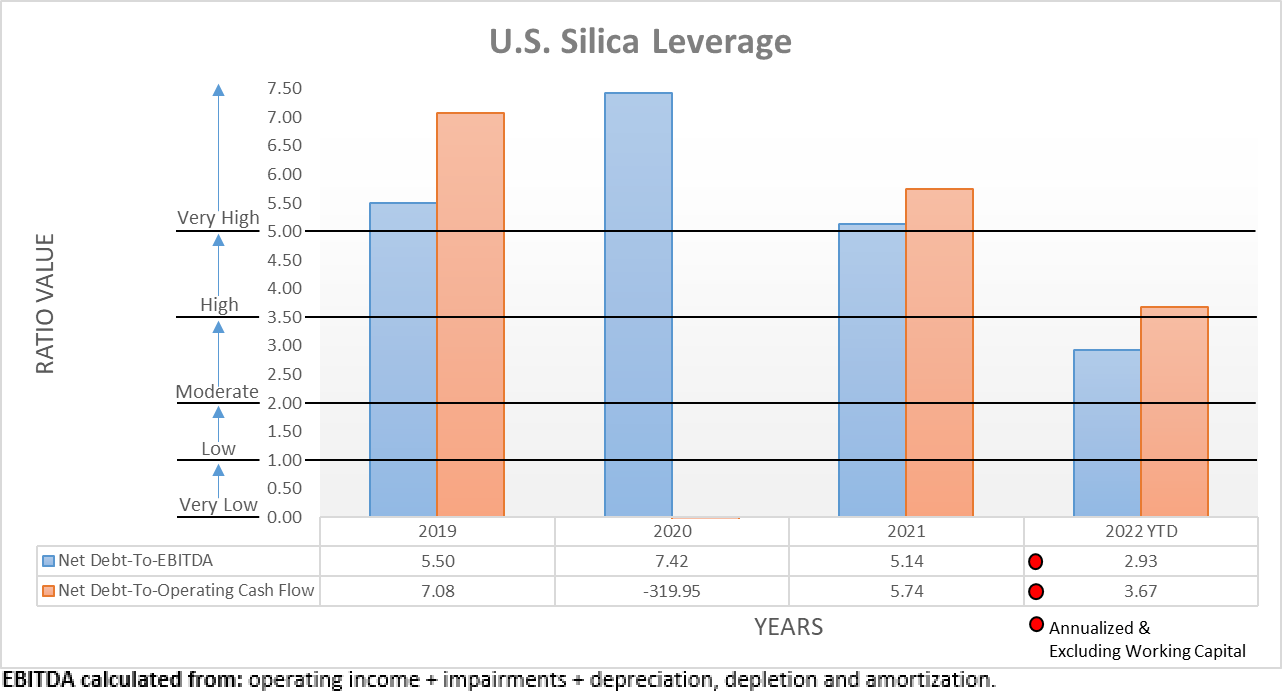
Author
Their lower net debt following the third quarter of 2022 was unsurprisingly accompanied by lower leverage with their net debt-to-EBITDA and net debt-to-operating cash flow now landing at 2.93 and 3.67. This sees a sizeable improvement versus their previous respective results of 3.64 and 4.48 following the second quarter. Although their latest result of 3.67 for their net debt-to-operating cash flow is still sitting within the high territory of between 3.51 and 5.00. Whilst lower leverage is undoubtedly positive, it nevertheless remains high and thus not only highlights the need for net debt to be reduced further but also highlights the risk of problematic very high leverage returning if their financial performance suffers during 2023.
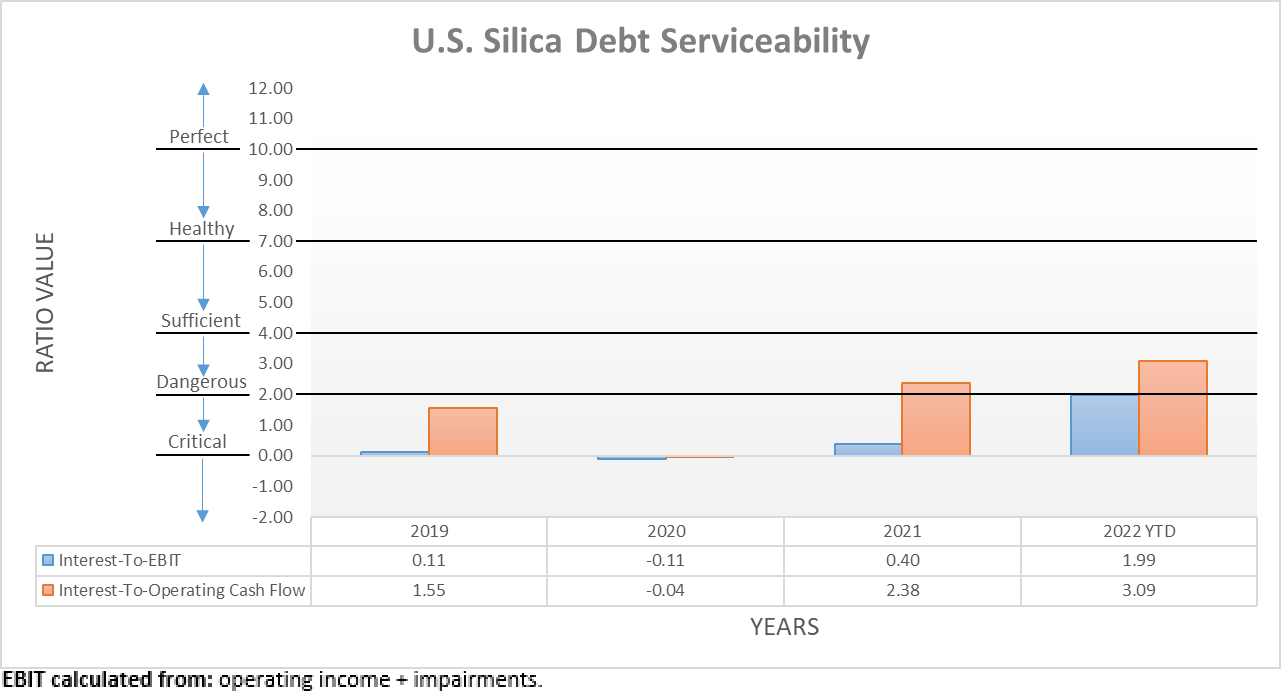
Author
Apart from their subsequently discussed massive debt maturity hurdle, shedding debt is also important to help ease the pain of higher interest rates, which is becoming increasingly important to consider as interest rates climb rapidly. As it stands right now, their interest coverage is only just sufficient when utilizing their accrual-based EBIT that sees a result of 1.99 and whilst this improves modestly to 3.09 if utilizing their cash-based operating cash flow, it remains lower than would be preferred. More importantly, going forwards they are materially exposed to higher interest rates given the variable rate of their entire debt, as per the quote included below.
“As of September 30, 2022, we had $1.112 billion of debt outstanding under the Credit Agreement. Assuming LIBOR is greater than the 1.0% minimum base rate on the Term Loan, a hypothetical increase in interest rates by 1.0% would have changed our interest expense by $11.1 million per year.”
-U.S. Silica Q3 2022 10-Q.
In this day and age, it seems that a 1% interest rate movement is no longer anything uncommon and as such, they are materially exposed to rapidly tightening monetary policy. To this point, the $11.1m per annum cost they flag is approximately equal to circa 6.60% of their operating cash flow during 2021 and thus can easily pile up into a material double-digit headwind, especially with the Federal Reserve already delivering a 75bps hike in October 2022, just after the third quarter ended. This raises the stakes heading into 2023 because if their cash flow performance does not cement its tentative recovery, they will find it increasingly difficult.
Author
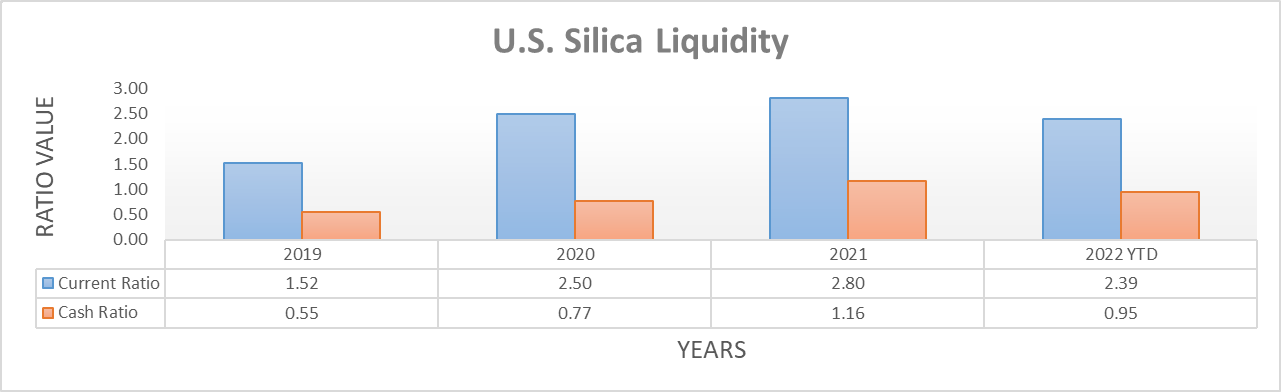
When turning to their liquidity, the third quarter of 2022 was uneventful on the surface with their respective current and cash ratios of 2.39 and 0.95 fluctuating within their usual range versus their previous respective results of 2.76 and 1.26 following the second quarter. Elsewhere beneath the surface, the leverage ratio as defined under their credit facility plunged to only 3.81 versus its previous level of 5.26 across these same two points in time, thereby now sitting right near its covenant limit of 3.75 that is presently restricting their ability to draw more than $30m from their credit facility.
Whilst not necessarily required right now, the prospects of unlocking additional liquidity soon in the future is still a positive development because it means they can afford to safely run a lower cash balance, thereby allowing for more of their debt to be repaid to soften the burden of higher interest rates. Hopefully, this might even help facilitate greater debt market access so they can refinance their massive debt maturity hurdle laying ahead in 2025 that sees almost the entirety of their debt come due.

U.S. Silica Q3 2022 10-Q
Conclusion
It was surprisingly nice to see green shoots emerging during the third quarter of 2022, although at the same time, these tentative signs of a recovery face a test heading into 2023 with a gloomy economic outlook posing a headwind. Not to mention they are materially exposed to higher interest rates, plus have not resolved their massive debt maturity hurdle in 2025 and thus I believe that maintaining my hold rating is still appropriate.
Notes: Unless specified otherwise, all figures in this article were taken from U.S. Silica’s SEC Filings, all calculated figures were performed by the author.
Be the first to comment