

Torsten Asmus
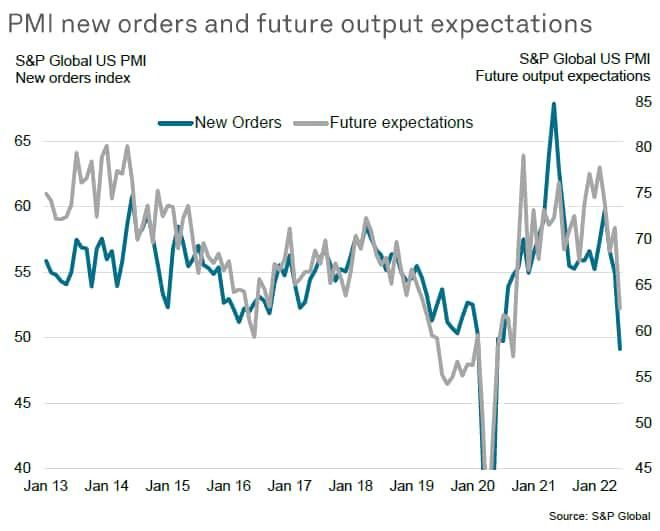
June saw signs of an increasingly broad-based weakening of the US economy with demand now falling in both the manufacturing and service sectors. While the survey data point to a stalling of GDP at the end of the second quarter, a downshifting in the forward-looking new orders index and drop in companies’ future output expectations hints at falling economic activity as we head through the summer.
Meanwhile there was welcome news in terms of a marked easing in upward price pressures, widely associated with deteriorating demand conditions, but it’s clear that price growth remains elevated despite coming off recent peaks, all of which points to a bout of stagflation in the near term.
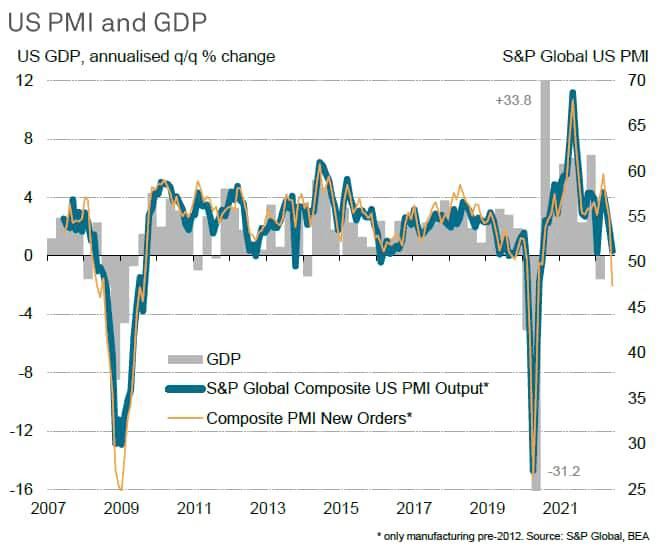
The S&P Global US Composite PMI Output Index, which measures the combined output of the manufacturing and service sectors, fell to 52.3 in June from 53.6 in May. The latest reading was the softest since January and the second-lowest in the pandemic recovery to date.
The drop in the index brings it down to a level which historical comparisons suggest is broadly consistent with GDP growth almost stalling at the end of the second quarter.
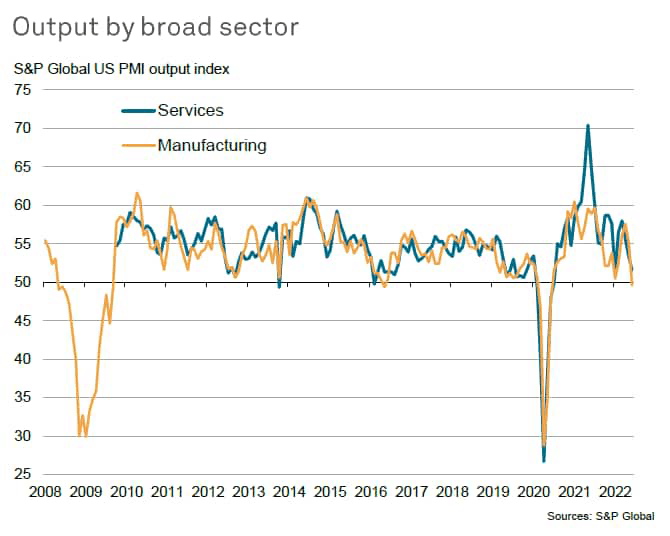
The slowdown in growth was broad based, with both manufacturing and services seeing weaker increases in output at the end of the second quarter.
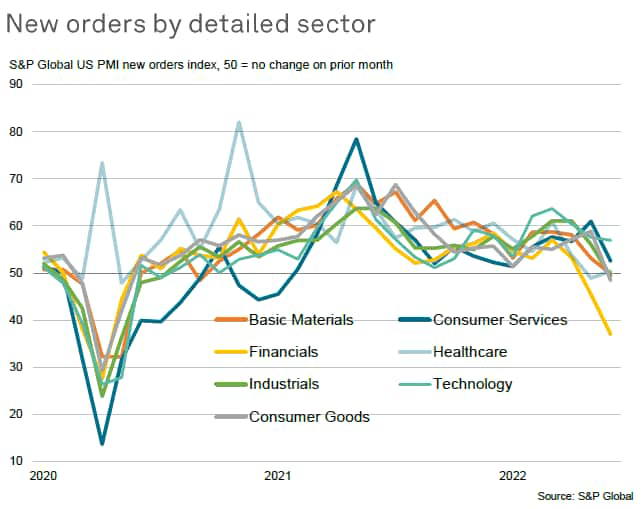
The weaker expansions of output in turn reflected a renewed contraction in new orders, the first in almost two years. New business was lower across both manufacturing and services, commonly linked to household demand having been subdued by the rising costs of living. Tighter financial conditions were also reported to have hit demand, especially in financial services (where the steepest drop in demand of all major sectors was recorded in June), linked to the recent hikes in interest rates by the Federal Reserve. Companies also reported rising uncertainty and pessimism about the outlook as having dampened customer demand.
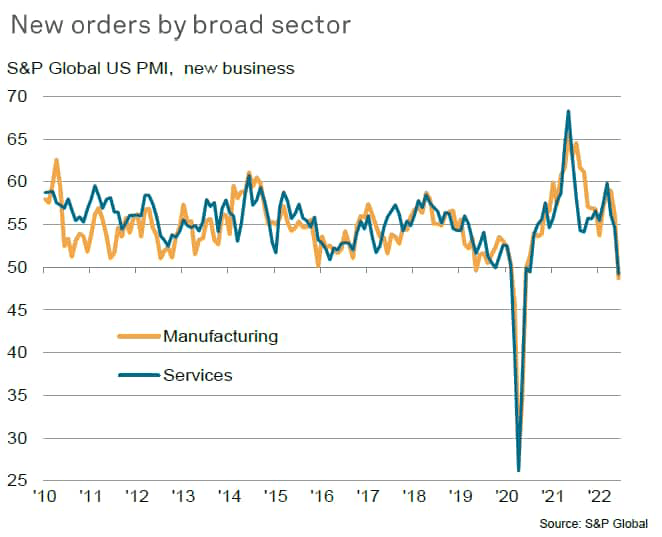
Looking in more detail, in addition to the decline in orders for financial services, demand also fell for consumer goods, industrial goods & services, and basic materials. However, there was also a notable downshifting in growth of demand for consumer services, contrasting with the surging expansion of demand seen in recent months, to suggest that the growth stimulus from the reopening of the economy is showing signs of fading.
Inflation peak
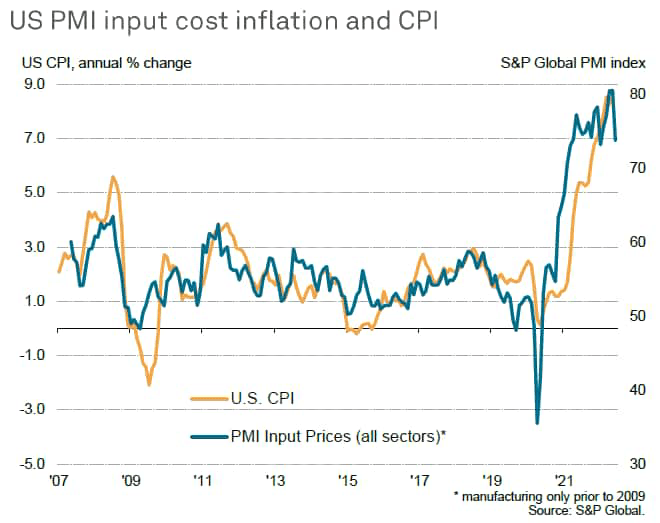
Meanwhile, rates of input cost and output price inflation remained sharp in June but eased considerably amid softer demand conditions. The overall rise in manufacturing and service sector costs in June was the weakest recorded since February and sharply lower than May’s all-time high, cooling substantially in both major sectors. The reduced rate of input cost inflation bodes well for CPI to have also peaked, given the close historical correlation between the two series.
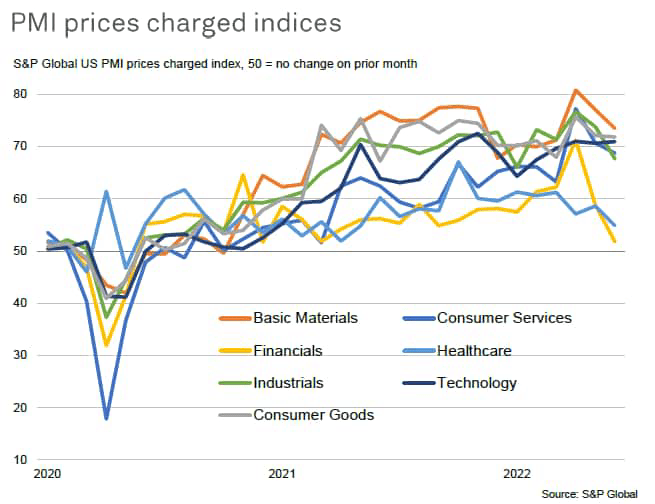
The slower growth of costs fed through to weaker selling price inflation in all sectors bar technology. The steepest slowdown in the rate of inflation was seen in financial services, linked to greater discounting amid the recent slowing of demand amid rising interest rates. The most elevated rates of inflation were meanwhile seen for basic materials and consumer goods, the latter in part reflecting higher food prices.
The June PMI survey therefore illustrates how recent rate hikes are already playing a role in cooling demand growth and helping bring down some price pressures.
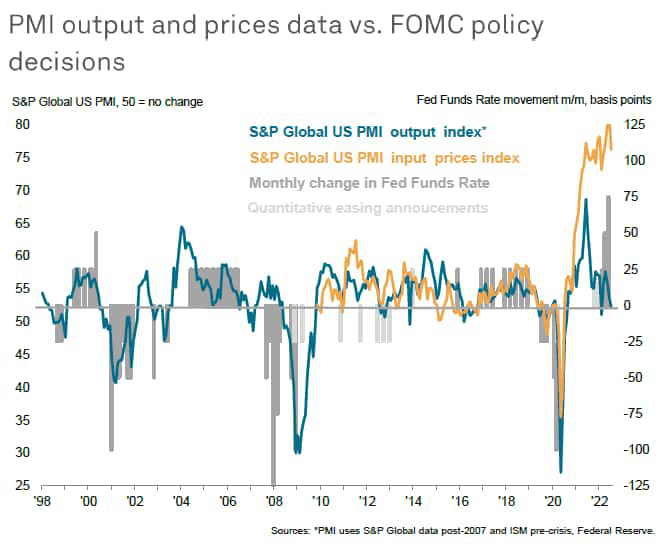
The concern is, however, that with the economy already stalled according to the June survey, an imminent economic contraction seems plausible, especially given the weakness of forward-looking indicators such as survey’s new orders and business expectations indices. The former is already signalling a downturn in demand and the latter has dropped to the lowest since September 2020.
Outlook
Official GDP data have meanwhile already been pulled lower so far this year, with a decline in the first quarter linked to international trade and inventory weaknesses potentially followed by marginal growth at best in the second quarter, according to our nowcasting model based on official statistics. What the PMI tells us is that the breadth of the weakness in the US economy is widening, which adds to the risks of a steepening underlying rate of economic contraction as we head through the third quarter.
At the same time, inflationary pressures are showing signs of moderating, though clearly remain elevated. This points to a spell of rising stagflation risks.
Latest press releases
S&P Global US Manufacturing PMI
Editor’s Note: The summary bullets for this article were chosen by Seeking Alpha editors.
Be the first to comment