

William_Potter/iStock via Getty Images
Over the past 10 years the SPX has outperformed 10-year US Treasuries by an annualized rate of over 13%, marking the best period of outperformance since the 1960s. After such a strong period of equity gains it is difficult to adopt a contrarian stance, but this is exactly what the historical data suggests we should do. 10-year bonds now offer positive return expectations relative to stocks over the next 10 years, with the added benefit of significantly lower volatility, and a track record of outperformance during periods of economic weakness.
Robert Shiller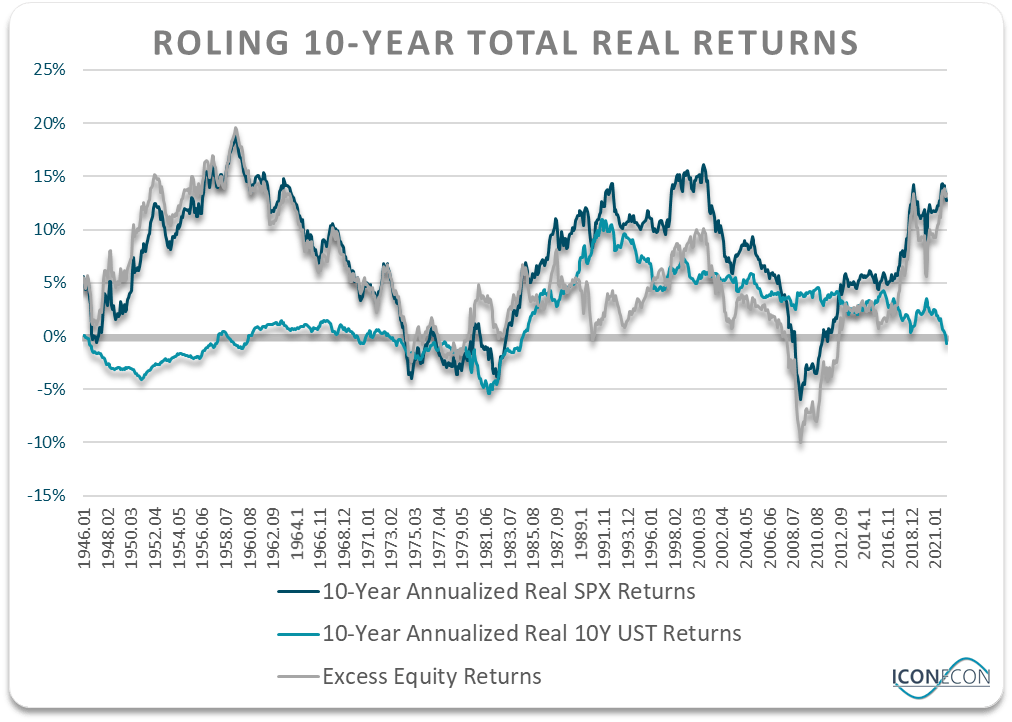
The Past 10 Years Have Been A Dream For Risk-Seeking Investors
The SPX has returned an impressive 12.7% returns over the past 10 years in real terms when reinvested dividends are taken into account, versus -0.7% on 10-year USTs. This 13.4% equity risk premium compares to a long-term post-WWII average of 4.9%. We can break down this outperformance into three factors. Firstly, low initial yields on USTs which locked in nominal returns of just over 2.0% annual returns in 2012. Secondly, SPX valuations have risen from slightly overvalued levels in 2012 to extremely overvalued levels today. These two factors highlight the importance of starting and ending valuations when it comes to long-term returns.
The third driving force behind the SPX’ outperformance has been the surge in profit margins. While nominal sales per share have expanded by 4.2%, roughly the same pace as nominal GDP growth, as tends to be the case, earnings have grown by 8.2%. This 4% annual increase in profit margins has been the single biggest driver of excess returns in the SPX over the past decade.
SPX Profit Margins (Bloomberg)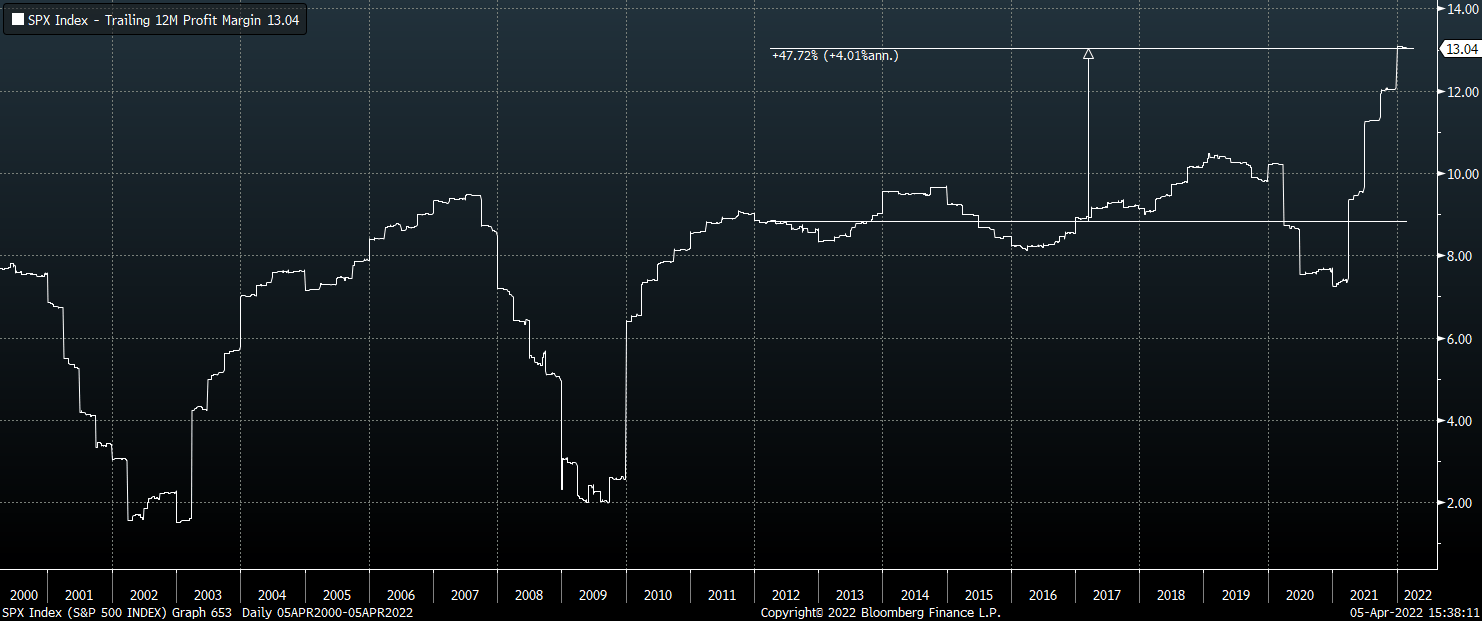
The Future Will Not Look Like The Past
It is tempting to believe that with the SPX earnings yield currently at 4.2% and the 10-year UST at 2.4%, equities should outperform by an annual rate of 1.8%. However, this rests on the assumption that the SPX will provide returns commensurate with its earnings yield over the long term. The problem with this assumption is that the SPX earnings yield has been a poor predicter of equity returns in the past for three reasons: Firstly, companies do not pay out earnings to shareholders, but rather they pay dividends. Secondly, profit margins fluctuate significantly over time meaning that the current earnings yield may not be a reflection of the true return prospects returns if profit margins fall from current record highs. Thirdly, PE ratios also fluctuate significantly over time. If the PE ratio falls current elevated levels between now and 2032, investors will see their returns undermined by this fall in valuations.
One way to address the above concerns is to use the cyclically adjusted earnings yield rather than the trailing yield to smooth out the impact of profit margins. We can then look at the relative returns of stocks and bonds at previous periods when the cyclically adjusted earnings yield was at current levels relative to bond yields. This not only addresses the issue of current elevated profit margins, but it also factors in the tendency for equity valuations to mean revert over the long term.
The link between the excess returns implied by the equity risk premium using the cyclically adjusted earnings yield is shown on the chart below. As you can see, based on the strong long-term correlation since 1946, the current equity risk premium suggests that the SPX will outperform USTs by just 2.3% per year over the next decade.
Robert Shiller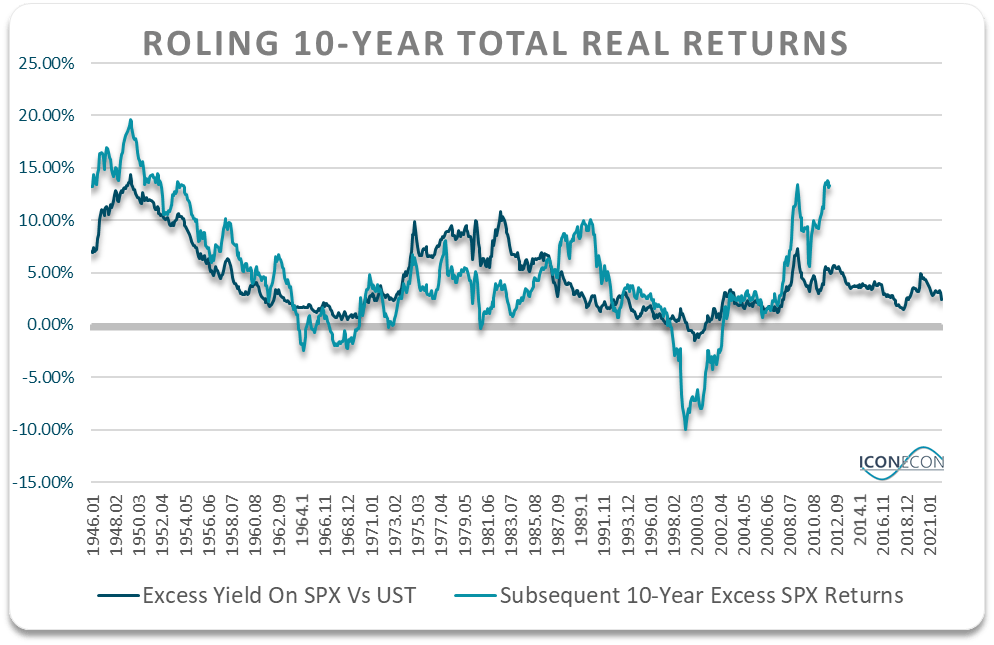
However, this should be seen as a best-case scenario. The reason being that historical correlations are formed using historical growth rates for SPX earnings, and over the post-WWII period cyclically adjusted earnings have grown by 7.1%, due largely to strength in US real GDP. To be precise, real cyclically adjusted earnings have risen by 4.9% while consumer prices have risen by 2.2%.
Going forward, nominal earnings growth should be significantly lower than its historical average due to the much weaker growth outlook for the US and the rest of the world, capping earnings growth. As I argued in ‘1% U.S. Long-Term Real GDP Growth A Best-Case Scenario‘, I expect US real GDP to average no more than 1% over the next decade. When we add to that the expected inflation rate of 2.8% implied by 10-year US breakeven inflation expectations, this amounts to less than 3% nominal long-term earnings growth, which is most than 4 percentage points below its historical rate. With this in mind, the SPX should be expected to underperform UST by roughly 2% per year over the next decade if history is a guide.
Even this bearish estimate may turn out to be on the optimistic side. If we look at the valuation work done by John Hussman, he is currently penciling in around 7% annual underperformance on the SPX relative to 10-year USTs for the next 12 years. It is also worth noting that the historical correlations he cites are far tighter than using the simple cyclically adjusted earnings yield as I have above.
John Hussman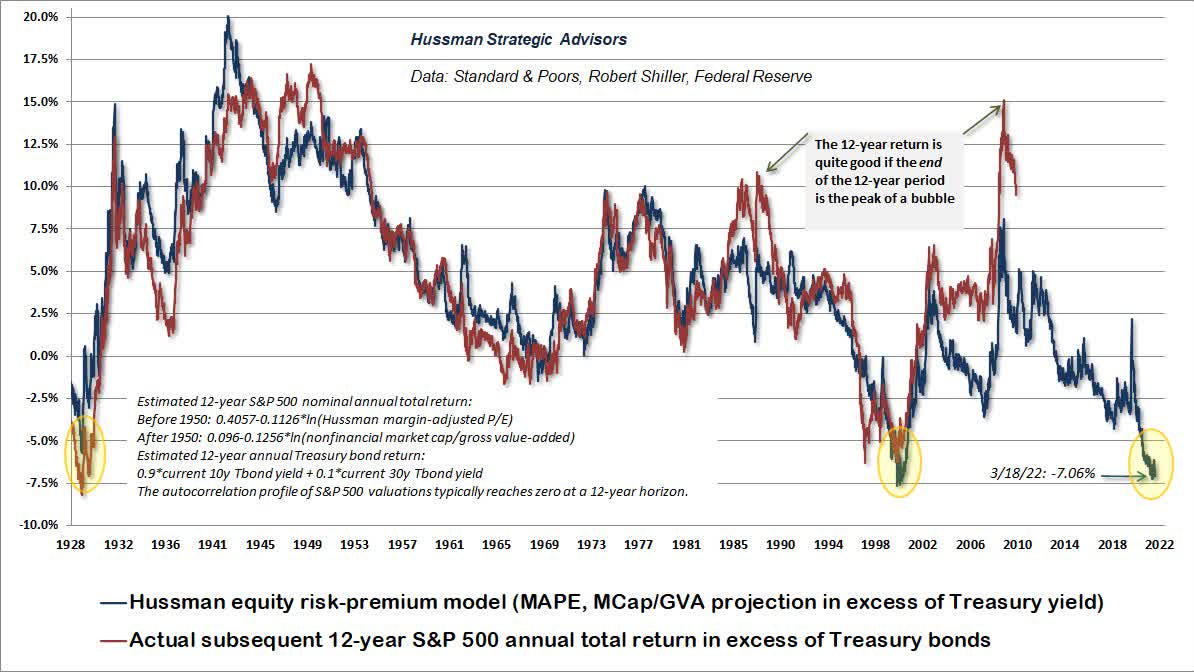
Regardless of the SPX valuation metric used, it appears as though bonds are more attractive now than at any time since the SPX market peak of 2000. Over the 10 years following that peak, the SPX underperformed USTs by a staggering 10% annually.
Bonds Offer Additional Benefits
While I do not expect to see equities underperform to such a degree going forward, there are other reasons to shift to bonds now aside from stronger expected returns. The main reason is that bonds are significantly less volatile. Even after a dramatic increase in yields over the past two years from historic lows, the low on 10-year bonds in total return terms over this period has been just 10%, and with yields now almost 2% higher than they were at the lows, another 10% loss would require a spectacular rise in yields. Secondly, bonds have a proven track record of outperforming during periods of economic weakness, which is when positive returns become increasingly important. As shown below, of the last 8 recessions identified by the NBER, only one – the 1973-75 recession – has occurred alongside rising 10-year UST yields. The rest have all seen yields fall significantly, with an average decline of around 1%.
US 10-Year UST Yields Vs US Recessions (NBER, Bloomberg)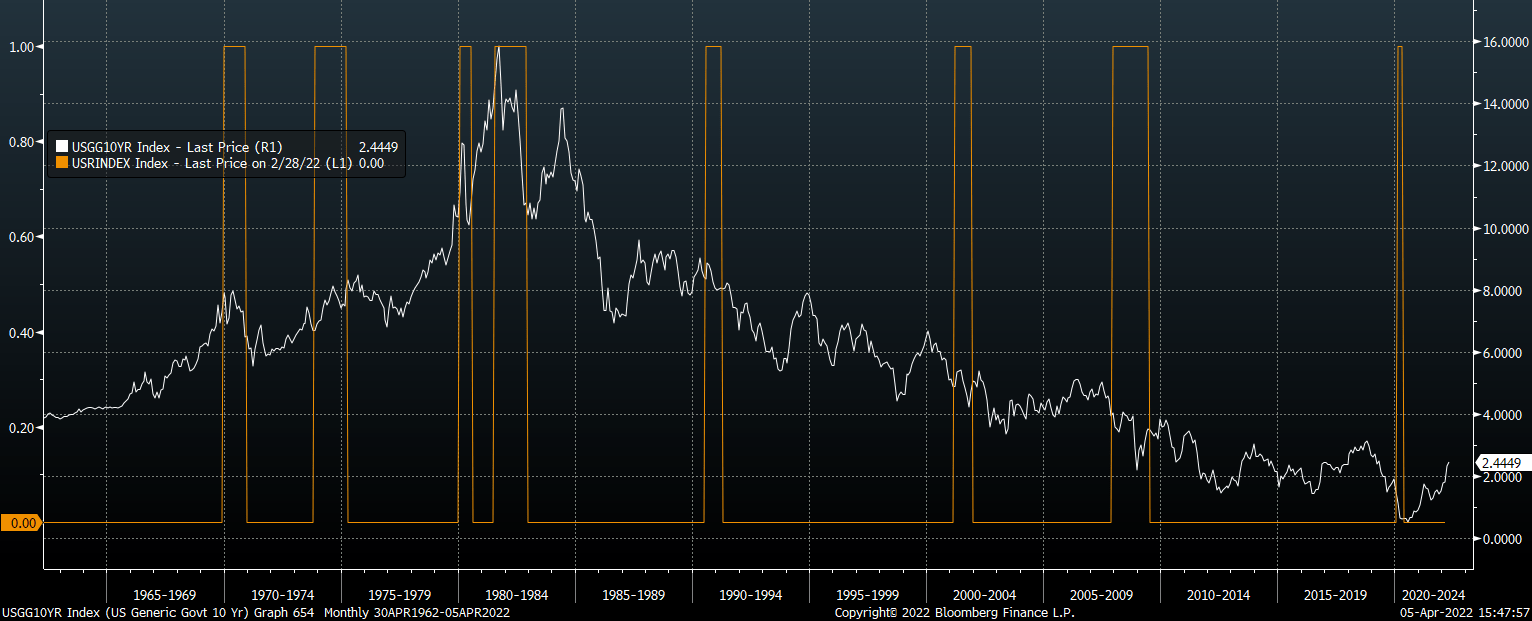
As we saw in the late-1970s/early-1980s, even persistent elevated inflation does not particularly strengthen the case for US stocks relative to bonds from a historical perspective. During the inflationary period of 1972-1983, stocks and bonds performed equally poorly, with bonds suffering from much lower drawdowns. The reason being, while high inflation is positive for nominal earnings, it has a strong tendency to undermine valuations for a number of reasons as I explained in ‘Inflation And Stocks: The Good, The Bad, And The Ugly‘.
Hyperinflation Risks Cannot Be Rules Out
The main risk that US investors face in shifting out of stocks and into bonds currently is a collapse in confidence in the dollar and loss of control of inflation. Such a scenario would likely cause a nominal earnings increase that greatly outweighs any drag on returns caused by a contraction in valuations. I outlined the threat of hyperinflation in this article, and while I believe that it remains an extreme tail risk, it is a consequential enough risk that I also think any sizeable shift into bonds should also be undertaken alongside a shift into precious metals or other real asset that should benefit from a currency collapse.
Be the first to comment