

wildpixel/iStock via Getty Images
U.S. exports lifted the trajectory of trade between the U.S. and China in February 2022.
Year over year, the value of those exports surged by 22% overall, with a third of the increase represented by agricultural goods, including cereal grains, soybeans, and cotton. The single biggest growth category however was pharmaceutical products, which accounted for 19% of the year-over-year gain and makes sense given China’s continuing problems with coronavirus infections. Exports of U.S. mineral fuel oils also increased significantly in the year-over-year measure, with much of the remaining increase spread over multiple categories.
We should also note that much of the year-over-year gains resulted because February 2021 had seen an unusually low level for U.S. exports to China. That volatility can be seen in the following chart tracking the trailing twelve-month average of the combined value of that trade as the heavy black line, where the counterfactual is shown by the dashed red line. We’re using the trailing twelve-month average to account, in part, for the seasonality in the actual monthly data, which we’ve shown as the thinner purple line.
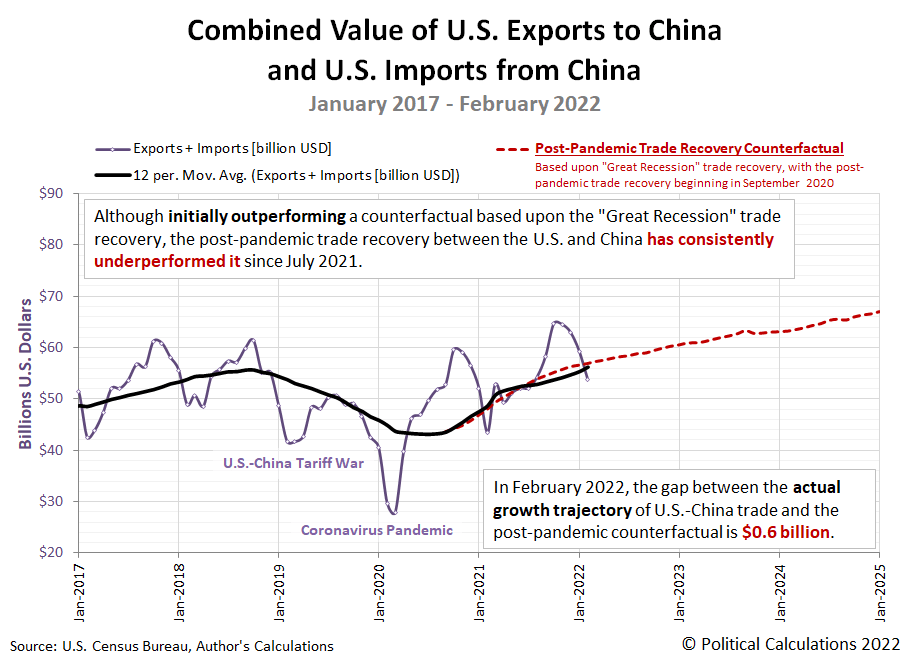
Much as February 2021’s trade level between the U.S. and China was unusually low, March 2021’s trade level was unusually high, so we anticipate the gap between the actual trajectory of U.S.-China trade and our counterfactual will open up when March 2022’s data becomes available.
References
U.S. Census Bureau. Trade in Goods with China. Last updated: 5 April 2022. Accessed 5 April 2022.
Editor’s Note: The summary bullets for this article were chosen by Seeking Alpha editors.
Be the first to comment