


IvelinRadkov/iStock via Getty Images
Introduction
I’ve written two previous articles on US Bancorp (NYSE:USB) stock for Seeking Alpha. The first was in 2020, soon after I purchased the stock on 5/13/20. I wrote about that purchase in my 7/15/20 article “Stocks I Bought On The Dip: U.S. Bancorp“. After holding the stock for about a year-and-a-half, I took profits on 12/20/21 and I wrote about that sale in this year’s January 19th article “Why I Recently Took Profits in US Bancorp“. Here were my returns compared to the S&P 500 index (SPY) over that time.
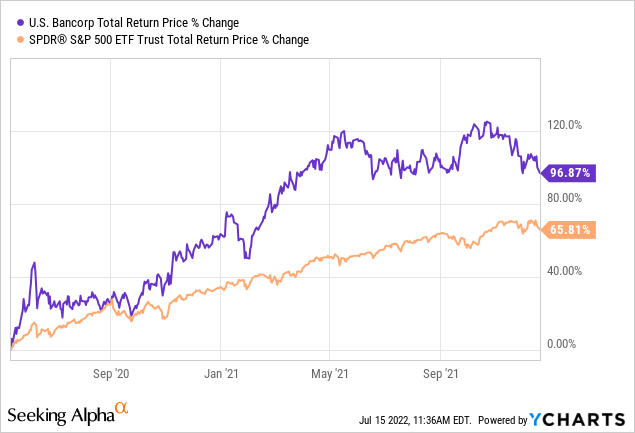
The stock was basically a double and handily outperformed the index over the holding period, producing both great relative and absolute returns. Since I sold USB in late December 2021, here is how the stock has performed.
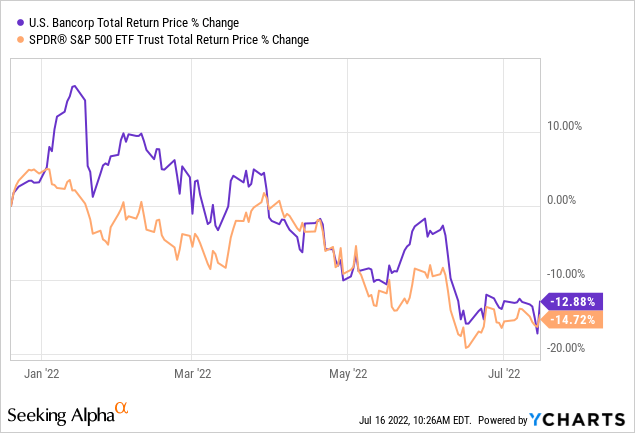
In this article, I’m going to share with readers the method I used to produce these realized returns, and I’m also going to share a couple of extra tips I use when selecting which banks to have on my “buy list”, and which to exclude.
Knowing A Bank’s Risk Is Difficult
My philosophy is that with most financial stocks, like banks and also insurance companies, outside investors with limited information (like us) never really know how much risk a financial institution is taking on. Typically, those risks don’t surface until there is a recession or disaster of some type, and if the recession is bad enough, only then do we find out that a bank’s borrowers can’t pay them back on schedule, or an insurance company’s premiums were too low to cover their eventual claims.
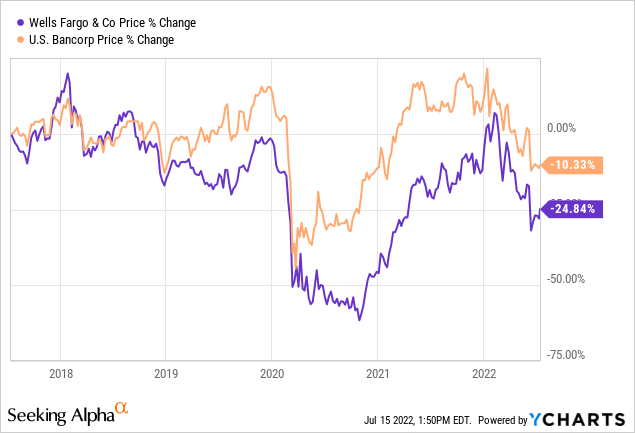
When it comes to regional banks like US Bancorp, one observation I’ve made over the years is that the regional bank stocks roughly trade together as a group. Below are the total returns of USB compared to S&P’s Regional Banking ETF (KRE) over the past 5 years.
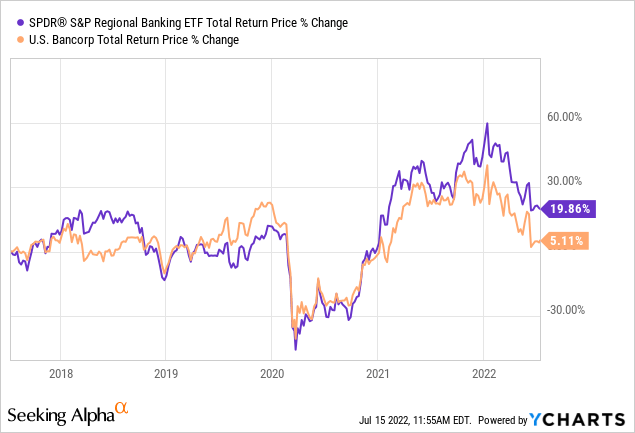
We can see that the returns are highly correlated. The truth is that I could plop about any decent regional bank in this graph and most of them would have similar stock price movements as the index. Is this fair? Are all regional banks of equal value and safety over the medium-term? I would argue that they are not. But the market is sort of dumb in this sense. I believe investors can take advantage of this dislocation, but perhaps not in the way most might think.
My view is that if I am unlikely to be able to take advantage and get alpha by selecting individual regional banks instead of buying an index, I might be able to increase the quality and safety of my holdings by only purchasing the highest quality and the very best banks out of the group. Then if something does go horribly wrong at some point, I have taken on less medium-term downside risk.
Now, I already noted that I don’t think it’s really possible for outside investors to know those risks, which is probably why the market doesn’t even try. But a big part of my overall investing approach is that the past is often a very good predictor of the future. Not perfect, but very good. Sticking with that line of thinking, one thing I always check with regional banks is how well earnings performed during the 2008 financial crisis, and also how well they recovered. If a company failed to navigate that crisis well, or the data simply isn’t available, then I avoid those stocks and instead only focus on the ones who performed well during that crisis. In my view, this increases the odds that if there is another crisis at some point, I can basically hold higher quality businesses but not pay a higher price for that quality premium.
Let me give an example. I recently had a member of my marketplace service, The Cyclical Investor’s Club, ask me about Huntington Bancshares (HBAN). Below is a price chart that compares HBAN to USB stock over the past 5 years.
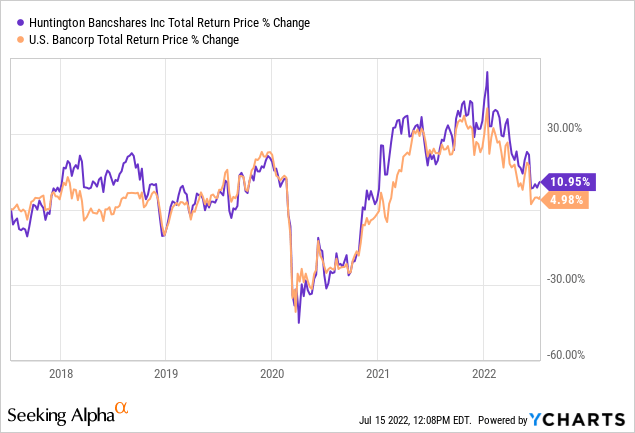
They are nearly identical.
Now let’s look at the long-term price and earnings of these banks to see how they performed during the great financial crisis.
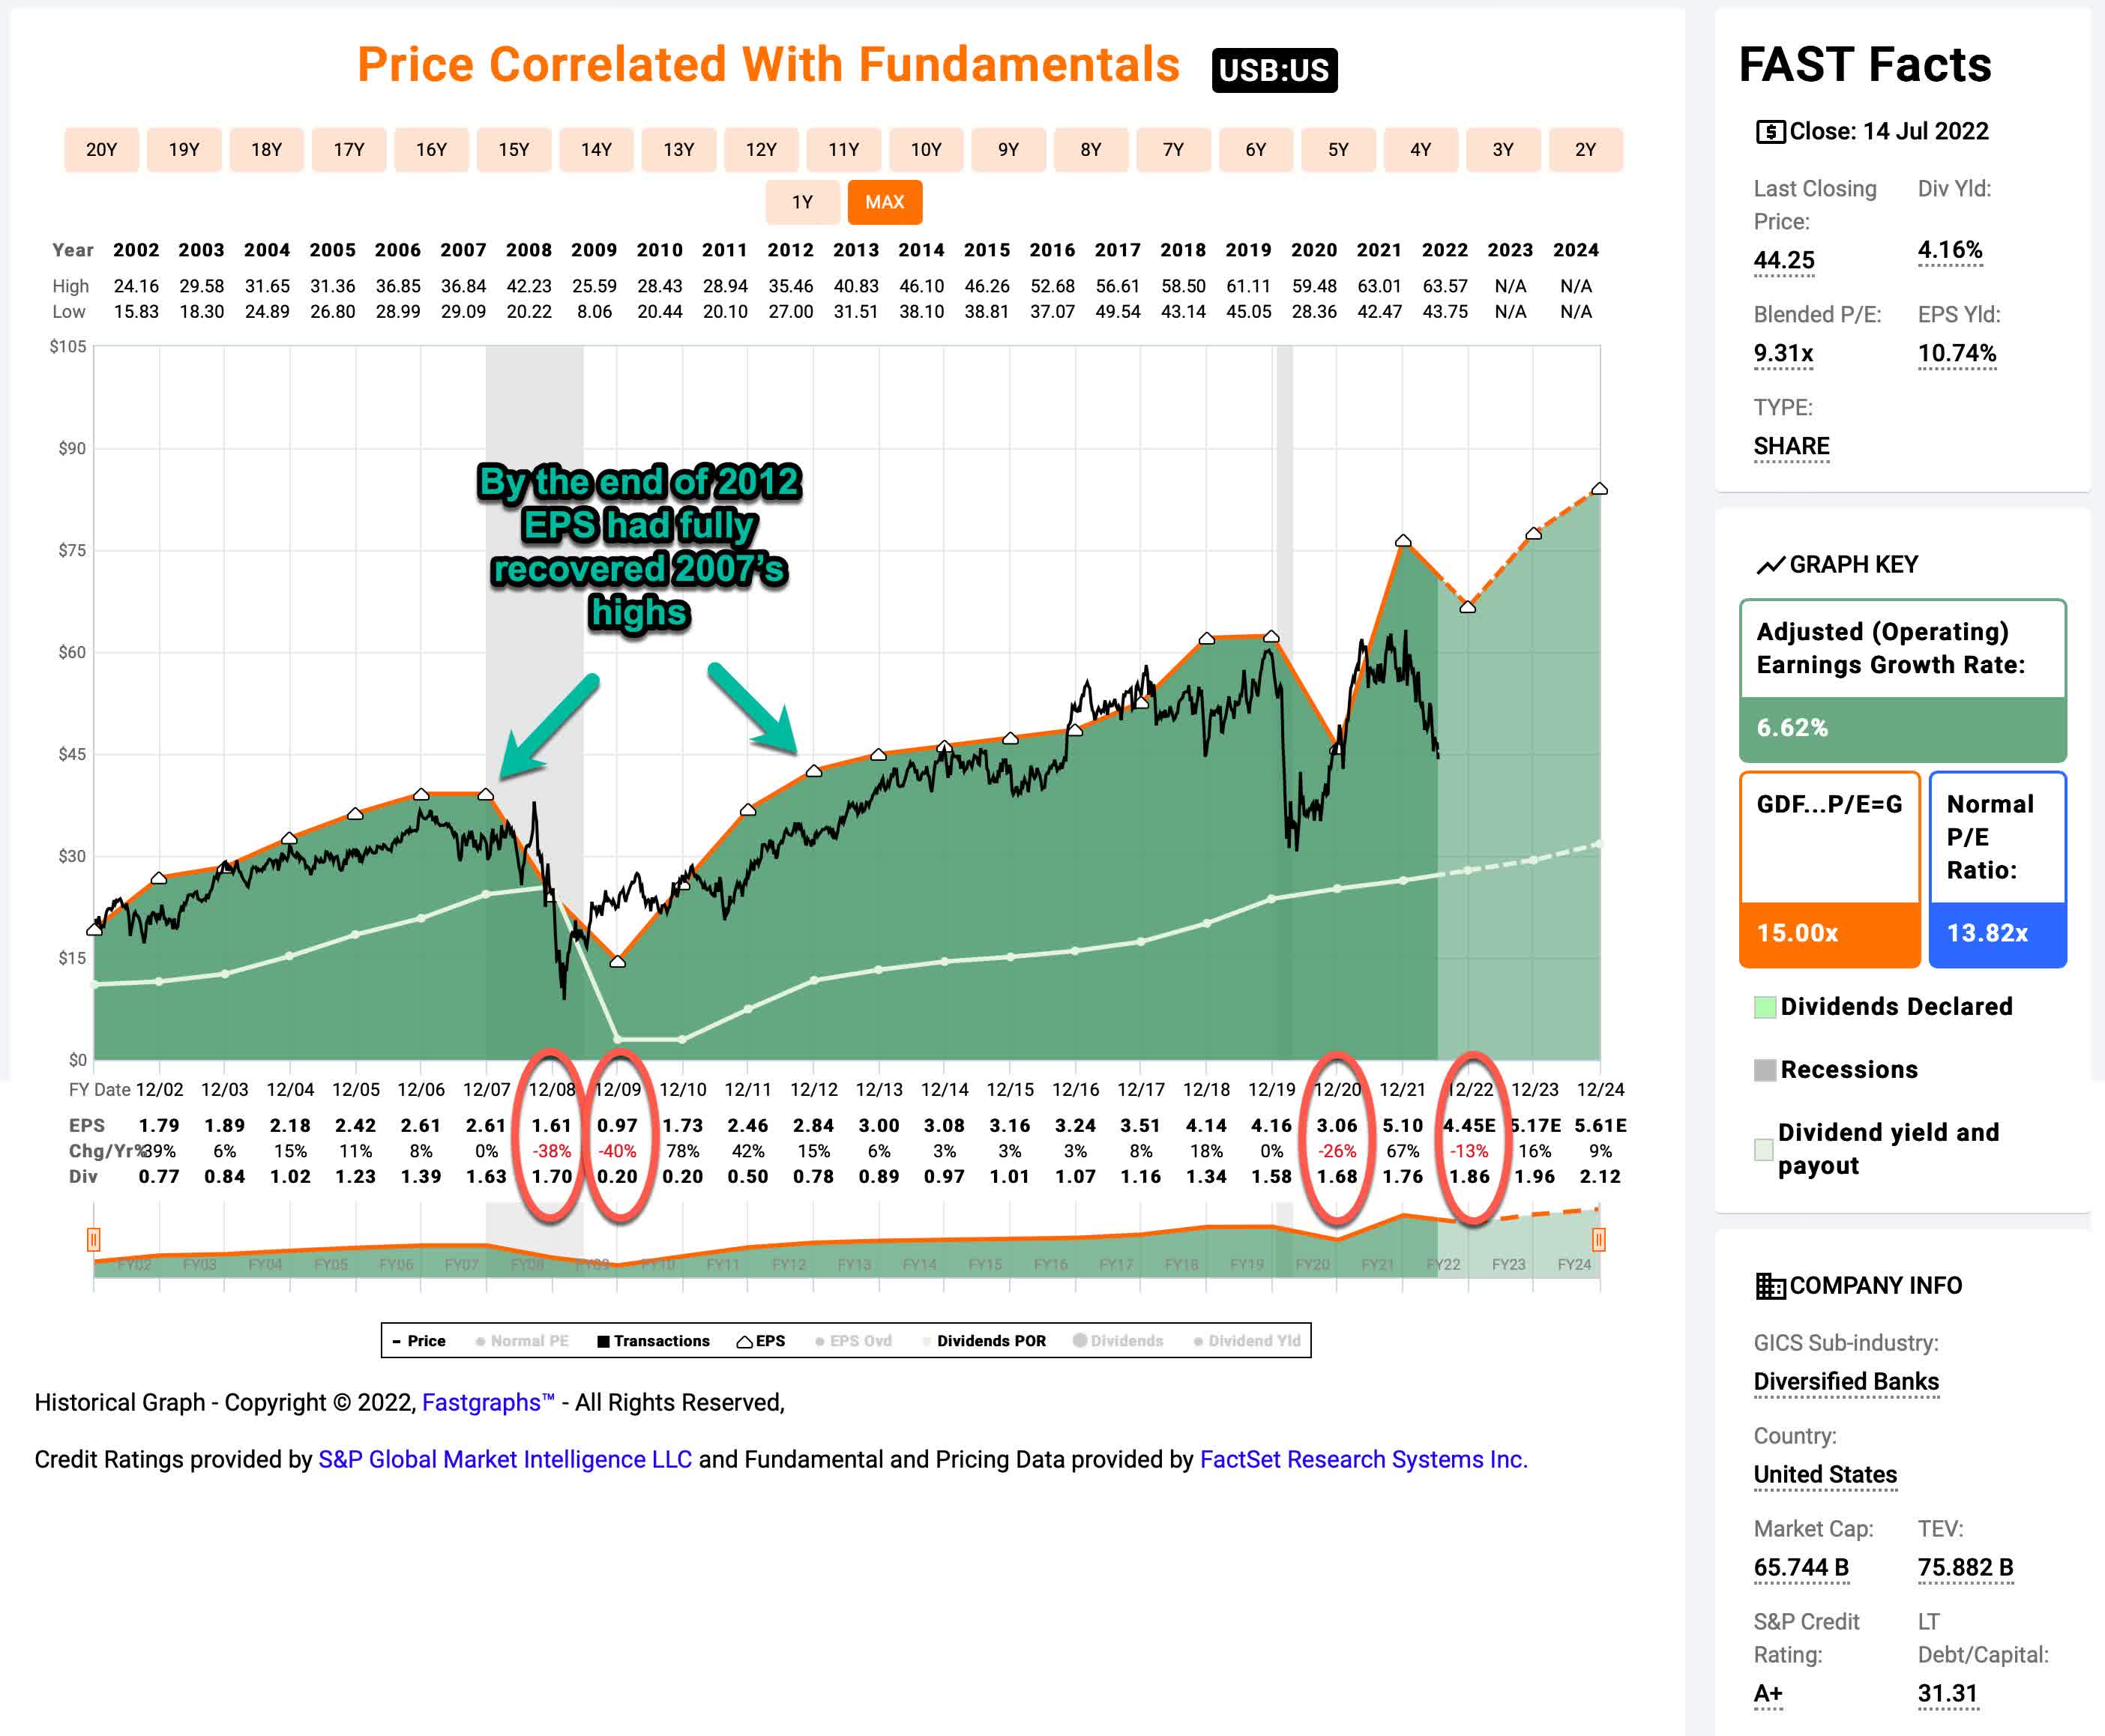
FAST Graphs
US Bancorp was severely impacted by the financial crisis in 2008 and 2009, and EPS growth fell significantly. However, earnings stayed positive the entire time, and EPS had fully recovered and made new highs by 2012. This lets us know that they were not taking on too much risk leading into the crisis and they probably would have survived even if the government decided not to bail out the banks.
Now let’s look at HBAN’s earnings history:
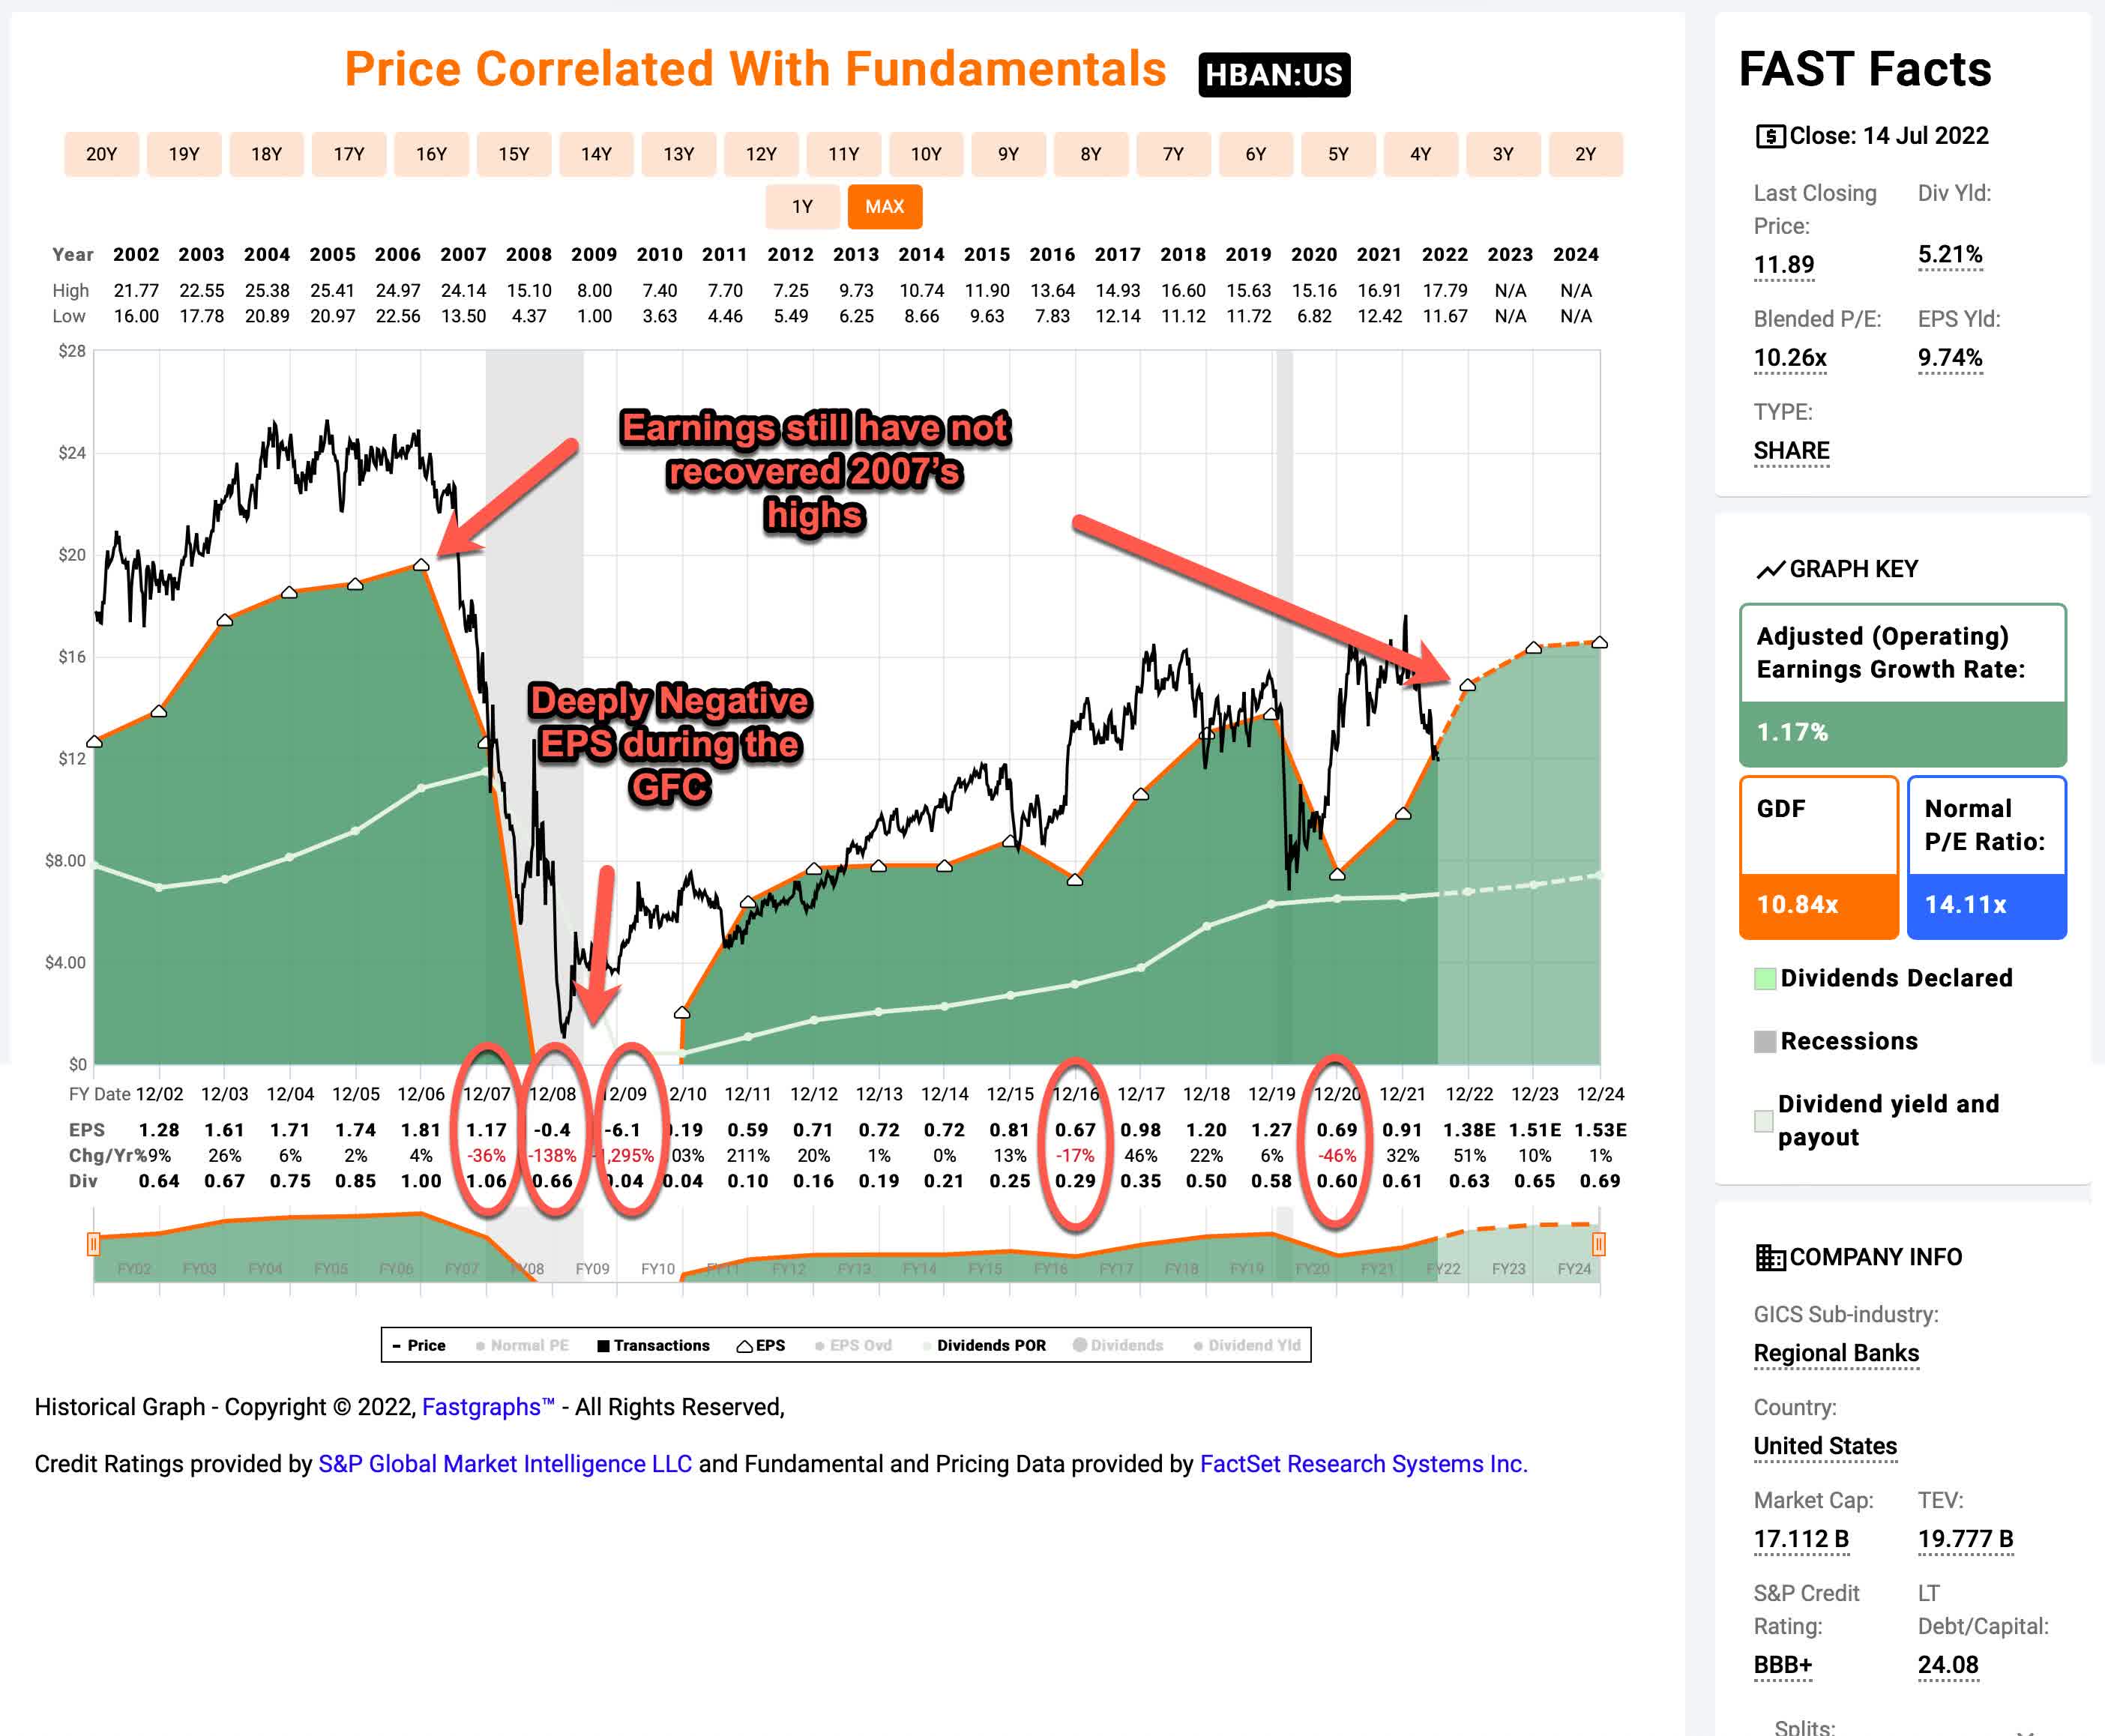
FAST Graphs
During the 2008/9 recession, earnings per share were deeply negative, and 14 years later EPS still hasn’t reached the highs of 2007. More recently, in 2020, EPS fell -46% for HBAN and only -26% for USB. The market is telling us, based on the stocks’ price movements over the past 5 years, that the risk and reward of these banks are essentially equal. Time will tell, but I feel much more comfortable betting on USB over the medium or long term than I do HBAN because USB has a very long history of being a responsible lender through multiple cycles and calamities.
Alright, there is my first deep cyclical bank investing tip. Only buy the highest quality candidate based on historical earnings because the market is likely going to charge the same price as it does for lower quality candidates. My next tip will come later on in the analysis when I compare USB to another popular bank I have been avoiding.
One can see from USB’s historical EPS that it can experience -50% drawdowns during recessions, and that’s the standard I use to declare a stock a “deep cyclical” stock. The rest of this article will be an explanation of my deep cyclical strategy, and my method for determining the buy price for USB should the stock price continue to fall. The significance of this categorization is that I use a different type of analysis (that is a bit unorthodox) for deeply cyclical stocks than I do for more steady-earning businesses, and that analysis focuses on historical price cyclicality rather than earnings in order to estimate a good entry price for the stock in question.
The reason I don’t use traditional metrics like P/E ratios for cyclicals is that earnings fluctuate so much that they can send the wrong message about value. As earnings fall dramatically, P/E ratios rise, making the stock look expensive even though the price is quite cheap if earnings rebound in a timely manner. So I mostly avoid using P/Es or similar metrics as a value guide for deeply cyclical stocks. The one time to look at P/Es is when examining the peak P/Es just before a downcycle. What I’m looking for here is to see whether the peak (in this case monthly) P/Es are similar for both cycles. If they aren’t similar it might mean that one cycle can be expected to be different than the other, and a lot of my assumptions using this strategy rely on the cycles being somewhat similar to those of the past. In this case, USB’s peak P/E in 2007 was 13.82, in 2020 was 14.44, and in 2021 it was 13.32. Those are similar enough that it doesn’t raise any red flags about the valuation of USB going into the recession being dramatically different than it was in the past, and we can proceed without making any major adjustments to the approach.
Historical Price Cyclicality
Once I’ve established that a stock is a deep cyclical, the next thing I examine is what their historical deep drawdowns have looked like. In most cases, I require there be at least enough data to include two recessions, and in USB’s case, this isn’t a problem as they have data going back several decades and we can easily examine the last three or four recessions.
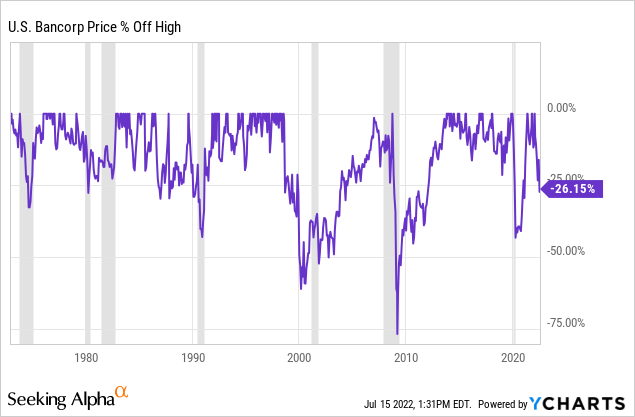
| Year | ~Time Until Bottom | ~Duration | ~Depth |
| 1989 | 15 months | 2 years | -45% |
| 1999 | 15 months | 5 years | -62% |
| 2008 | 6 months | 4 years | -76% |
| 2020 | 3 months | 1 year | -52% |
Examining USB’s historical price drawdowns during the last four recessions we get a range of about -45% to -75%. I don’t think it’s likely we see another great financial crisis on the scale of 2008/9 anytime soon. Usually it takes a few decades for the lessons of the past to be forgotten, and for the same mistakes to be repeated again. So, if we set that decline off to the side, that leaves us with a potential drawdown range of -45% to -62%, which I think is a reasonable drawdown range to expect during the coming bear market and recession. When buying a deep cyclical stock during a recession, I typically require that at a minimum the stock price is -50% off its highs, so that will be my standard this time around as well. (That was actually the same level I decided to use in 2020.) I’m aiming a little bit deeper on some other bank stocks, like JPMorgan (JPM), which I recently wrote about and shared I was aiming for a -60% drawdown before I buy that one, so, I think it’s okay if I accept a little bit higher price for USB before buying. It’s a stock I know I can sleep well at night holding even during the worst of times.
Next, let’s look at the impairment tests I run cyclical candidates through in order to see if there are any red flags that might indicate this time is significantly different from past cycles. I’ll frame these as a series of questions, and as long as USB passes the tests, I’ll buy it if it hits the price I want.
Impairment Tests
Are revenues during this cyclical peak higher than the last one?
The reason I look at this is that if revenues are lower than the previous cyclical peak, it can be a sign that the business is either being disrupted or in secular decline.
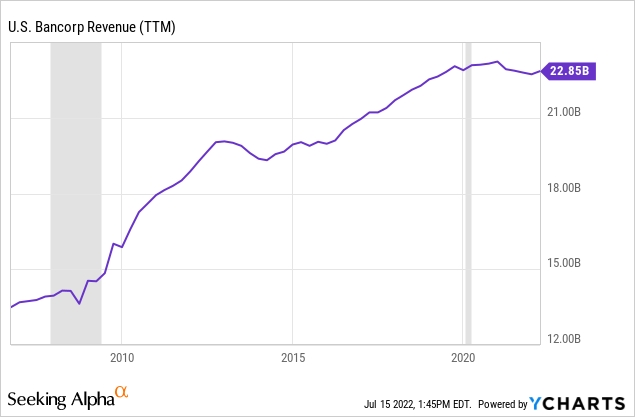
Revenues are far above what they were in 2006 and they also grew higher after the 2020 recession as well. So USB passes this test.
Interestingly, there are banks that do not. Wells Fargo (WFC) is a good example.
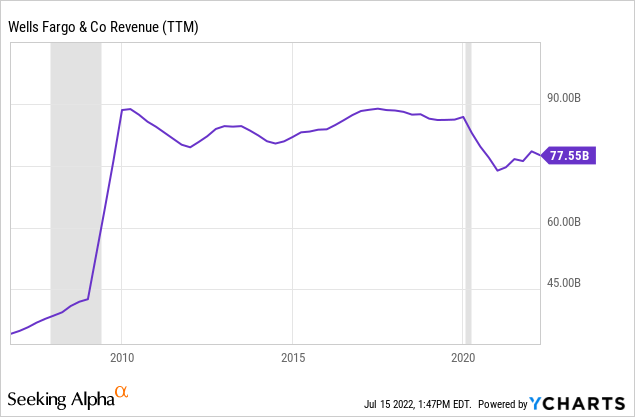
While revenues are higher than in 2006, they peaked in 2010 and are still significantly lower than 2019 before the last recession. And indeed, unlike most other regional banks that follow mostly in lock step price-wise with one another, despite a strong price recovery off the bottom last year, WFC is starting to show relative price weakness.
Wells Fargo, therefore, would not pass this impairment test, because the odds are higher that it will have a slower recovery than USB will from the coming recession.
Could the business have a hidden fatal flaw?
Since, by definition, the fatal flaw in the business model is “hidden” and cannot be easily seen, my test for this is whether the cyclical business in question has experienced two full business cycles, because typically recessions are where the flaws are exposed, and sometimes businesses can get lucky and avoid trouble in one recession but have the flaw eventually catch up to them during the next. I typically pre-screen for this before I write an article, and USB passes this test, since it recovered fine from the past three recessions.
Is there a clear and disruptive threat to its core business?
I don’t think there is right now, and in fact with the central bank raising rates closer to historical norms, that could be a positive for USB during the next economic upcycle.
Has the stock experienced a recent super-cycle?
Occasionally, stocks go through big super-cycles, valuations get thrown out the window by investors and the stock prices get bid up to crazy high levels. This can cause a problem for a strategy like mine that measures declines from peak prices, because if the peak prices are ridiculously high, then a stock might fall -50% off its highs and still not exactly be a good value.
I don’t have a clear way to identify super-cycles. It’s kind of an “I’ll know it when I see it” sort of thing. But my quick way to check is to look at a log-scale version of a long-term historical price chart. Super-cycles tend to show up pretty well on these charts without giving as many false positives as a normal long-term price chart might.
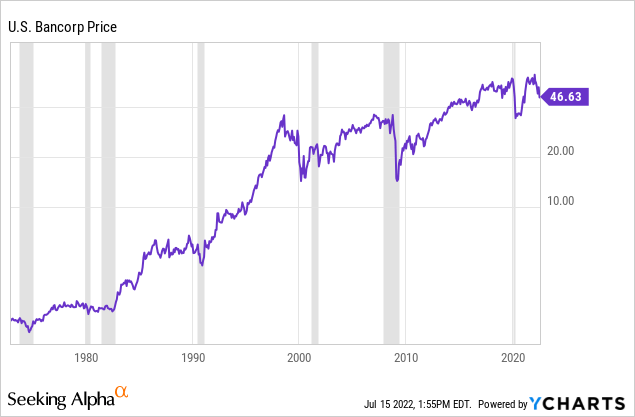
I think a person could make the case that the late 1990s was a super cycle, but the truth is that recent years actually look pretty depressed, and I see zero signs here of a current super-cycle.
Is management corrupt or incompetent?
I don’t think I’ve ever read or heard an unkind word about management, and during the Great Financial Crisis U.S. Bancorp’s name was hardly mentioned. So, I don’t see any evidence that this is something to worry about here.
Has the price dropped enough to produce alpha in the past?
What I’m going to do here is backtest what would have happened if we would have purchased the stock after the price fell -50% off its highs and then sold it after we achieved a +100% simple return.
For this section of the analysis, I’m going to go back in time and see what sort of returns investing in USB after a major decline would have produced. In the table below, I assume the stock was purchased after it had declined -50% from its highs and then sold after it recovered its previous peak stock price. So, for each investment, the pure return is ~100%, and they do not include dividends. I annualized that return and then compared it to the S&P 500 if bought and sold on the same dates, annualized. The goal is to see if historically this would be an alpha-producing strategy, so the last column is the alpha produced by the investment annualized relative to the S&P 500.
| Year the Decline Began | Purchase Date | Sell Date | Months Held | Annualized Gains |
S&P 500Annualized Gains |
Alpha vs. S&P 500 Annualized |
| 1999 | 2/18/00 | 12/18/03 | 46 | 26.09% | -4.93% | 31.02% |
| 2008 | 1/16/09 | 7/05/13 | 55 | 22.82% | 20.00% | 2.82% |
| 2020 | 3/23/20 | 4/27/21 | 13 | 92.31% | 80.56% | 11.75% |
Buying after a -50% decline during the 1999 downturn would have taken almost 4 years to double and would have produced very good annualized gains of +26.09% and also dramatically outperformed the S&P 500 which suffered a loss over this time-frame. During the 2008 decline, banks were hit much harder and took longer to recover, but even then USB was able to produce annualized returns over 20% and slightly outperform the index if purchased at -50% off its highs. And, during the 2020 decline (when I actually did buy USB when it was about -50% off its highs) USB produced fantastic absolute returns and also very good relative returns.
What is a reasonable investment strategy?
Given USB’s long history of recovering in a timely manner from downturns and producing both good absolute and good relative returns, and, going into this recession it was similarly valued compared to the last recession, and that buying the stock at -50% off its highs both had a reasonable chance of occurring during a recession, I plan to take an approximate 1% portfolio weighted position in the stock if the price falls below my ‘buy price’ of $31.79 (which is about -50% off its highs).
Conclusion
Sometimes the market doesn’t price real risk properly, and it treats higher quality businesses the same as lower quality ones. While stocks like USB and HBAN have similar 5 year performance, if we go back 20 years, the results are quite different.
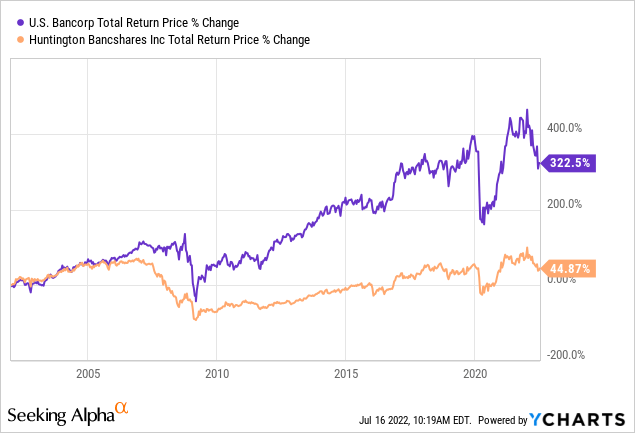
And leading up to the great financial crisis, from 2001 to 2006, the market was actually telling us that HBAN was the better bank.
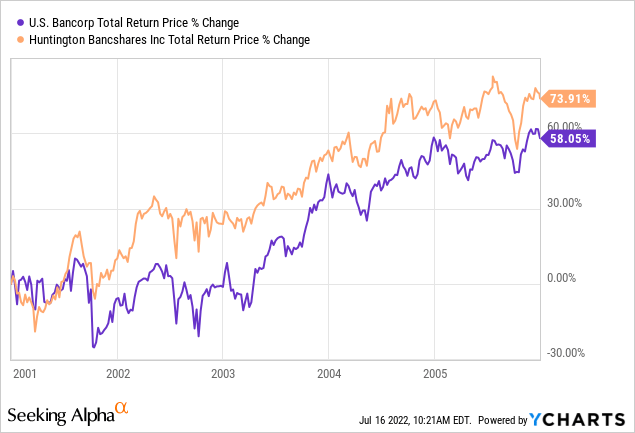
So, one thing I think we can be certain of is the market has no clue which are good banks and which are less-good banks until “the tide goes out”. And I don’t claim to know either. But I do think it makes sense to choose the bank with the best historical track record of doing things better. The good news is, we don’t have a to pay a premium in order to do that.
Be the first to comment