

da-kuk
(This article was co-produced with Hoya Capital Real Estate)
Introduction
I had a reader request a review of the Tri-Continental Corporation (NYSE:TY) CEF. Along with Central Securities Corp. (CET), which I just reviewed, both are Closed-End-Funds that date back to 1929! There are three common reasons investors would pick a CEF over an ETF:
- The benefit leverage should supply in a Bull market, though that doesn’t apply here as TY has minimal leverage.
- The possibility of buy assets at a discount, which enhances both yield and returns compared to paying “full price”. As shown later, TY does that.
- The desire to own an asset that will outperform a broad market index as most CEFs are actively managed versus most ETFs being passive. Unfortunately, unlike CET, TY fails on this measure.
Based on this review, and better performance by the Central Securities CEF, I would consider selling TY and replacing it with CET or GAM.
Tri-Continental Corporation review
Seeking Alpha describes this CEF as:
The Fund invests primarily for the longer term and has no charter restrictions with respect to its investments. With respect to the Fund’s investments, assets may be held in cash or invested in all types of securities. The Fund may invest in debt/fixed income instruments and convertible securities that, at the time of purchase, are rated below investment grade or are unrated but determined to be of comparable quality. The Fund may invest up to 25% of its net assets in foreign investments, including emerging markets. Benchmark: Bloomberg US Convertible Comp TR USD. TY started in 1929.
Source: seekingalpha.com TY
TY has $1.5b in AUM and comes with a 46bps fee. The TTM yield as shown on Seeking Alpha is over 16% due to a large 2021 year-end payout: more on this later. I found it odd that an equity-focused CEF, even one that can own fixed-income assets, benchmarks against a Convertible securities benchmark. Holdings would indicate a better match is the S&P 500 Index.
Researching deeper, I found that TY uses a blended benchmark, though some results presentations only compare TY against the S&P 500 Index.
The Blended Benchmark, a weighted custom composite established by the Investment Manager, consists of a 50% weighting in the S&P 500 Index, a 16.68% weighting in the Russell 1000 Value Index, a 16.66% weighting in the Bloomberg U.S. Corporate Investment Grade & High Yield Index and a 16.66% weighting in the Bloomberg U.S. Convertible Composite Index.
Source: columbiathreadneedleus.com TY Annual Report
The managers, Columbia Threadneedle, list three benefits for owning their CEF:
columbiathreadneedleus.com TY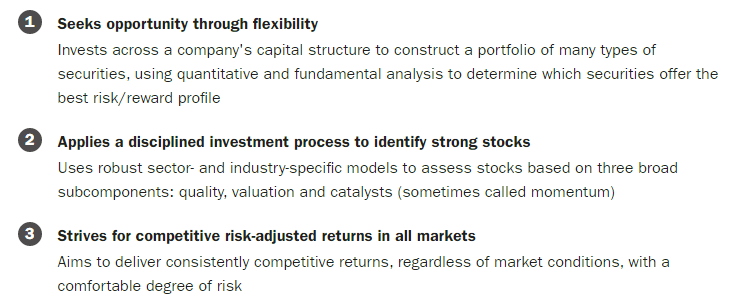
Readers can decide how well TY is meeting those objectives.
Holdings review
TY holds 242 assets with an average market cap of $305b. The portfolio has a P/E ratio of 12.5, versus a 16.9 for their benchmark. The P/BV compares favorably too: 2.3 versus 2.9.
columbiathreadneedleus.com FactSet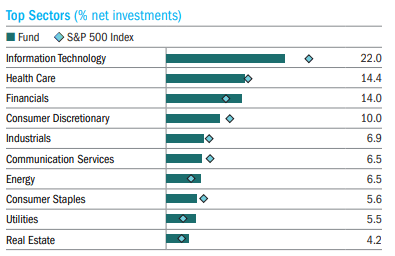
Looking at the sector weights, one might think they accidently pulled up the SPDR S&P 500 ETF (SPY) data, as the top sectors align very closely with that ETF.
columbiathreadneedleus.com 3Q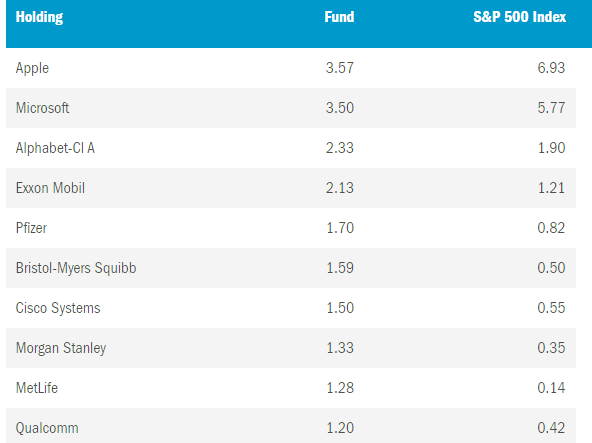
While the Top 2 holdings are the same in SPY, the rest of the list does not match SPY’s top holdings list. All told, TY’s Top 20 comprise 20% of the weight. The next chart shows what TY held at the end of the 2nd quarter, versus the 3rd quarter shown above.
columbiathreadneedleus.com 2Q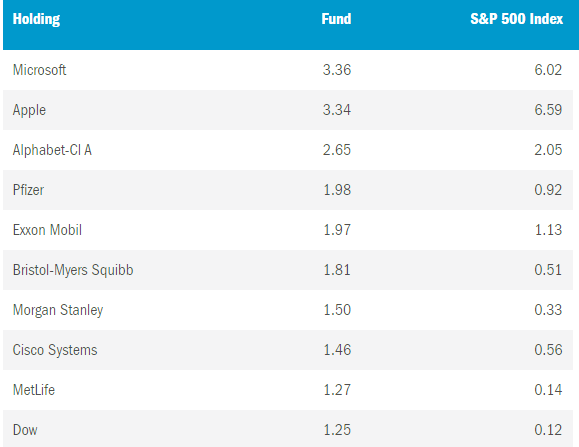
The largest 9 positions reveal the same stocks, though the weights and order differ. While that might indicate holdings stability, TY Annual Reports list the average turnover rate as being over 60% most years.
Distribution review
seekingalpha.com TY DVs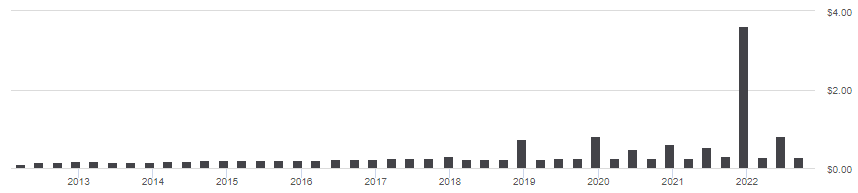
Looking at data prior to 2021, the average yield was about 5%. TY has what they refer to as an earned distribution policy. They intend to make payouts that are approximately equal to all distributions received from Tri-Continental’s underlying portfolio investments, less expenses and dividends payable on Tri-Continental’s preferred stock (about $37m). The next table lists the source of the payouts back to 2000.
columbiathreadneedleus.com DVDs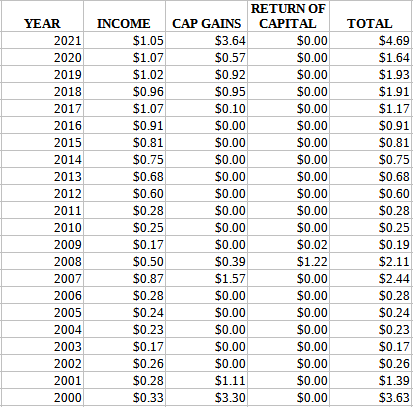
Capital gains have provided a large part of the distributions since 2018. ROC was only important in 2008, using data back to 1980.
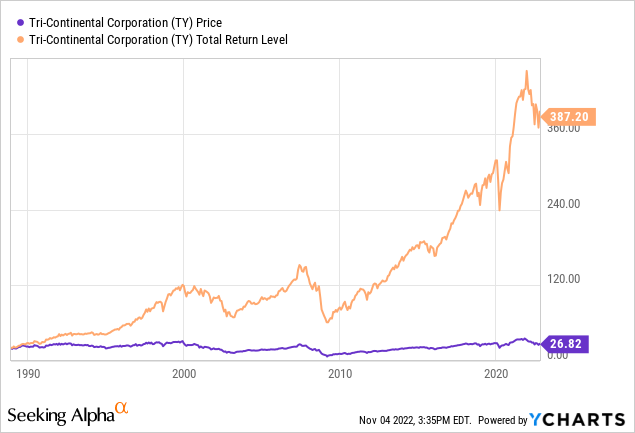
Price and NAV review
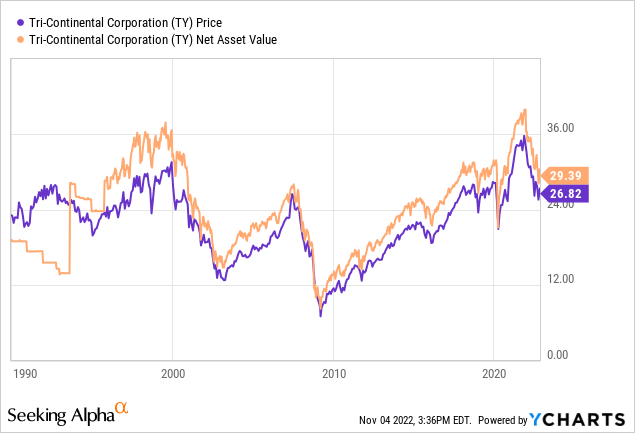
As the next chart better demonstrates, TY has a history of selling at a discount, currently near 9.6%. Sounds good until viewed against its historical data.
CEFConnect.com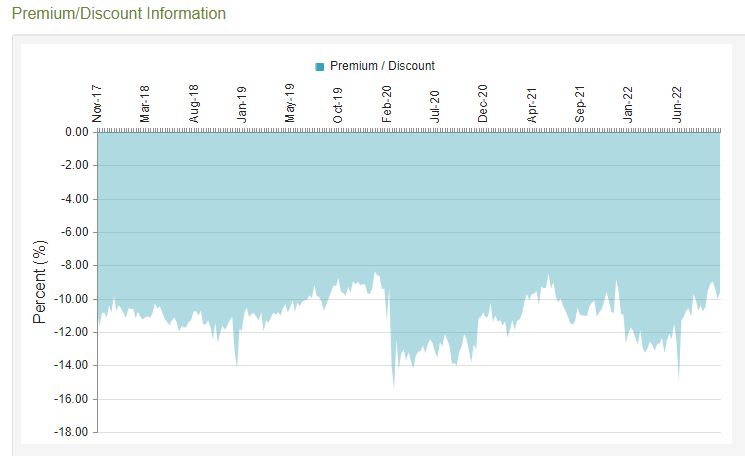
Over the past 5 years, TY has sold for a discount between 8 to 14%. The current Z-scores are over 1 for the 6 and 12-month values, which is not a good level.
Portfolio strategy
In this investor’s eyes, I would not own TY as a fund designed to provide better results that an ETF like SPY I mentioned earlier. To get more history, I used this mutual fund: Vanguard 500 Index Fund Investor Shares (VFINX), instead of SPY.
PortfolioVisualizer.com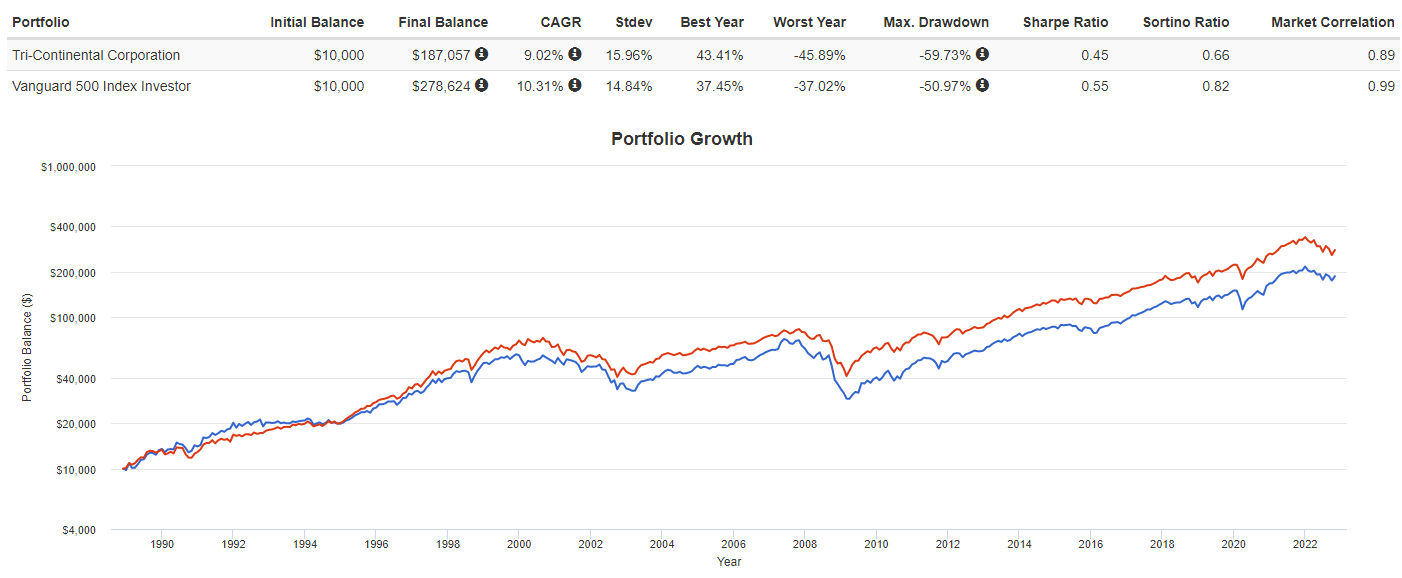
The S&P 500 based MF has provided more return and less risk since 1988. That said, TY is outperforming over the past 12 months. When I compared TY to three other long-dated CEFs that I found using the Seeking Alpha Peers function, the results are the same, with TY coming in last!
PortfolioVisualizer.com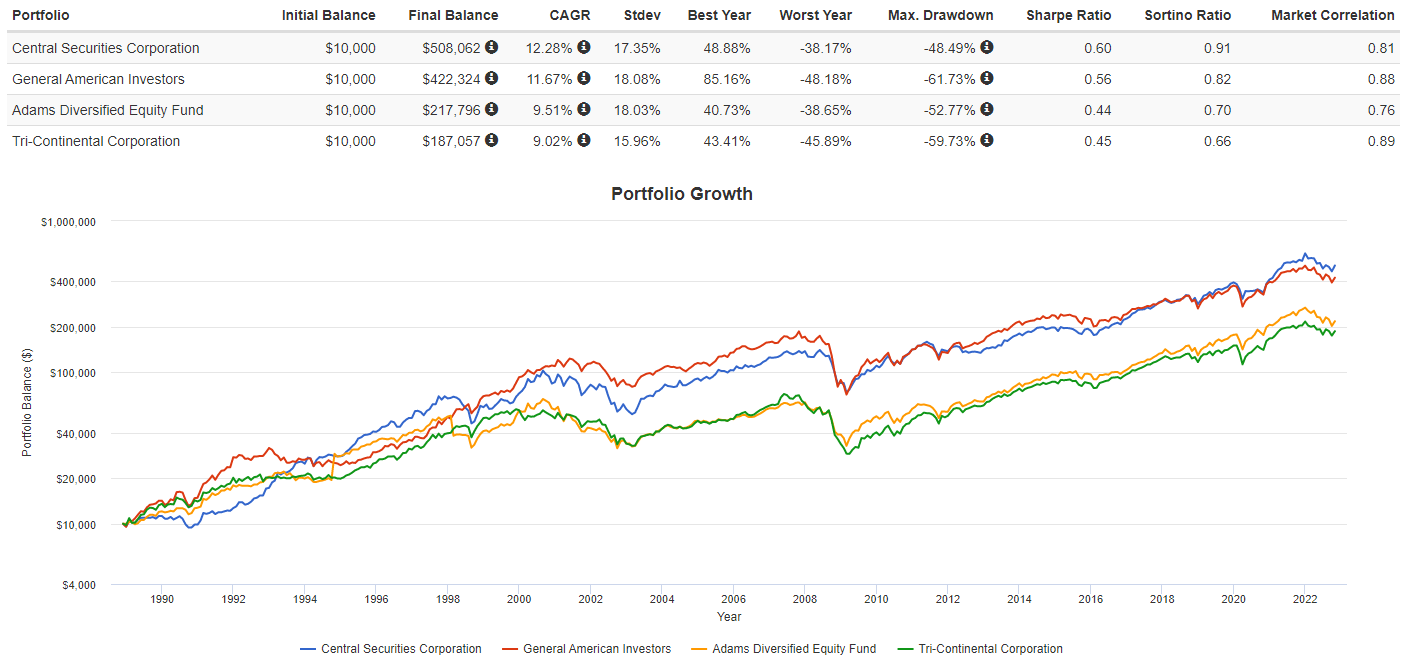
One feature all three better performing CEFs share is the sub-100 holdings diversity of their portfolios: TY has more than twice that number. The two most concentrated funds, CET and the General American Investors Company (GAM) show the best results.
Final thought
A good manager should be able to outperform a broad benchmark as both CET and the Adams Diversified Equity Fund (ADX) have shown over a long period of time. Both CET and GAM are worth analyzing in depth.
Be the first to comment