

shapecharge/E+ via Getty Images
Market anomalies, especially price action anomalies, are of little interest to passive investors, but active portfolio managers and traders may try to take advantage of them for a few basis points of extra gains.
Many anomalies, and in particular of the calendar type, come and go, but Turnaround Tuesday has been persistent so far. What some market participants may not be aware of is that this calendar anomaly has been robust during market corrections and bear markets, as I will show below.
Turnaround Tuesday anomaly: Buy SPY ETF (NYSEARCA:SPY) at the close of a down Monday and sell at the close of Tuesday.
Before going into the details of the backtest and drawing conclusions from basic statistical analysis, let us first look at the daily seasonality of SPY ETF since its inception.
SPY ETF Day Seasonality – Daily Returns (Price Action Lab Blog – Norgate Data)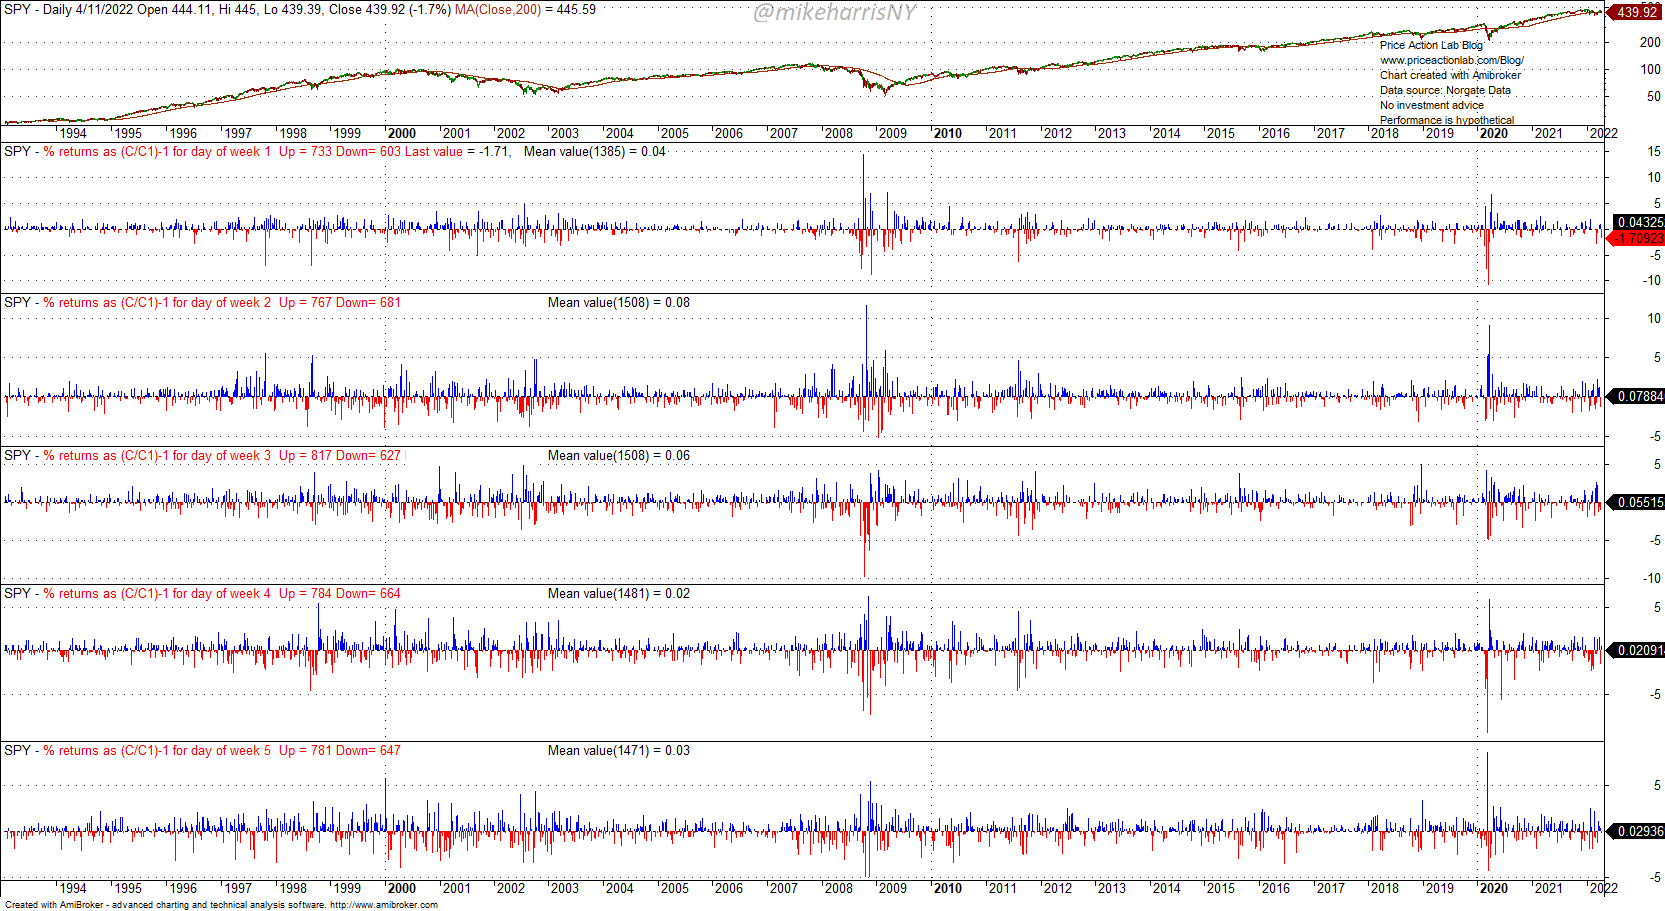
The above chart shows daily returns by day of the week, 1 through 5. The table below summarizes the results for the mean return by day of the week.
| Day of Week | Mean return (%) |
| Monday | 0.04325 |
| Tuesday | 0.07884 |
| Wednesday | 0.05515 |
| Thursday | 0.02091 |
| Friday | 0.02936 |
By far, the day with the highest mean return is Tuesday, at 0.07884%. Thursday and Friday have the lowest mean return.
Below is a chart that summarizes the results of a backtest of the Turnaround Tuesday anomaly for the SPY ETF. The backtest runs from January 29th, 1993 to April 11th, 2022. I used commission and slippage of $0.01 per share. For analysis purposes only, equity is fully invested.
Backtest results of Turnaround Tuesday Anomaly (Price Action lab Blog – Norgate Data)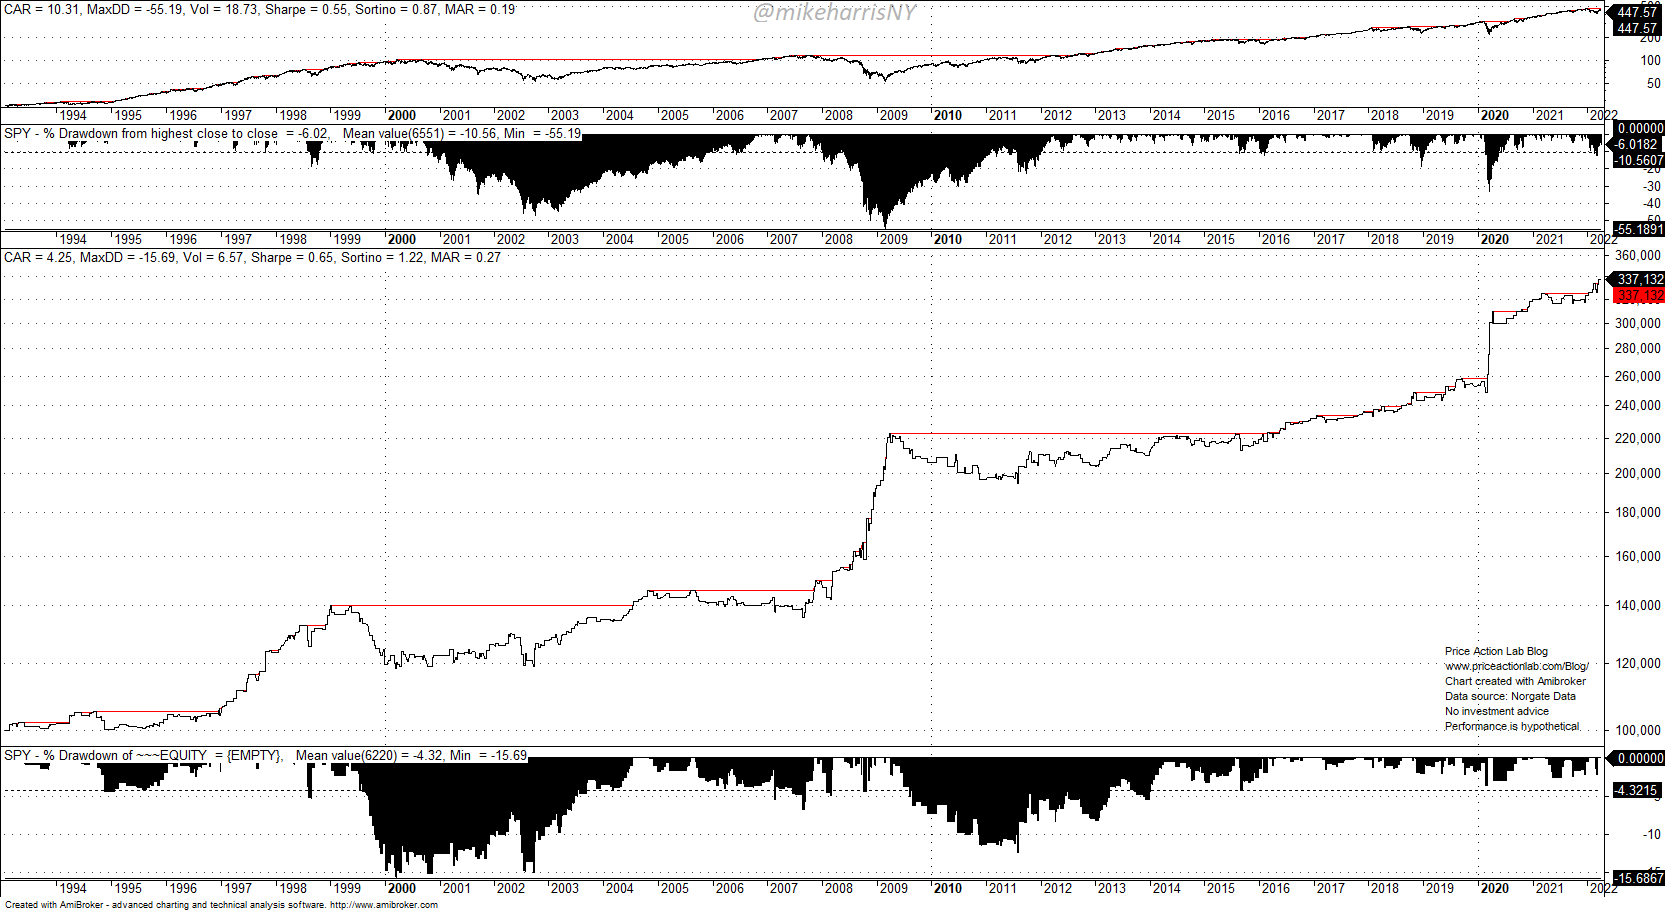
The top two charts show the performance of the SPY ETF and its drawdown profile in the backtest period. The third chart is the equity curve resulting from the anomaly trades, and the bottom chart is the drawdown profile of the equity.
The annualized return for the Turnaround Tuesday anomaly is 4.25%, which is nearly 40% of the annualized return of SPY buy and hold of 10.3%. It’s surprising that a calendar anomaly has generated 40% of the performance of the ETF since its inception and also at a significantly lower maximum drawdown. The results are summarized in the table below. I also include results for entering the trade at the open of Tuesday instead of the close of Monday, and also results for trading all down days, i.e., buying at the close of a down day and exiting at the next close.
| TA | TA O to C | All Down Days | Buy and Hold | |
| Annualized return | 4.25% | 1.77% | 2.94% | 10.3% |
| Maximum drawdown | -15.7% | -20.9% | -30.80% | -55.2% |
| Sharpe ratio | 0.65 | 0.33 | 0.26 | 0.55 |
| Volatility | 6.6% | 5.4% | 11.25% | 18.7% |
| Win rate | 57.1% | 53.8% | 54.6% | – |
| Number of trades | 597 | 597 | 2255 | – |
TA: Turnaround Tuesday, TA O to C is when trading the open of Tuesday instead of close of Monday, All Down Days enters the trade at close of down day and exits at close of next day.
Below are some observations from the above table.
1. The performance boost of the anomaly comes from overnight gains, as expected. As shown in the chart below, the SPY ETF’s performance since inception is due to overnight gains while regular trading hours have contributed to nearly nothing.
SPY ETF Overnight and Regular Trading Hours Gains (Price Action Lab Blog – Norgate Data)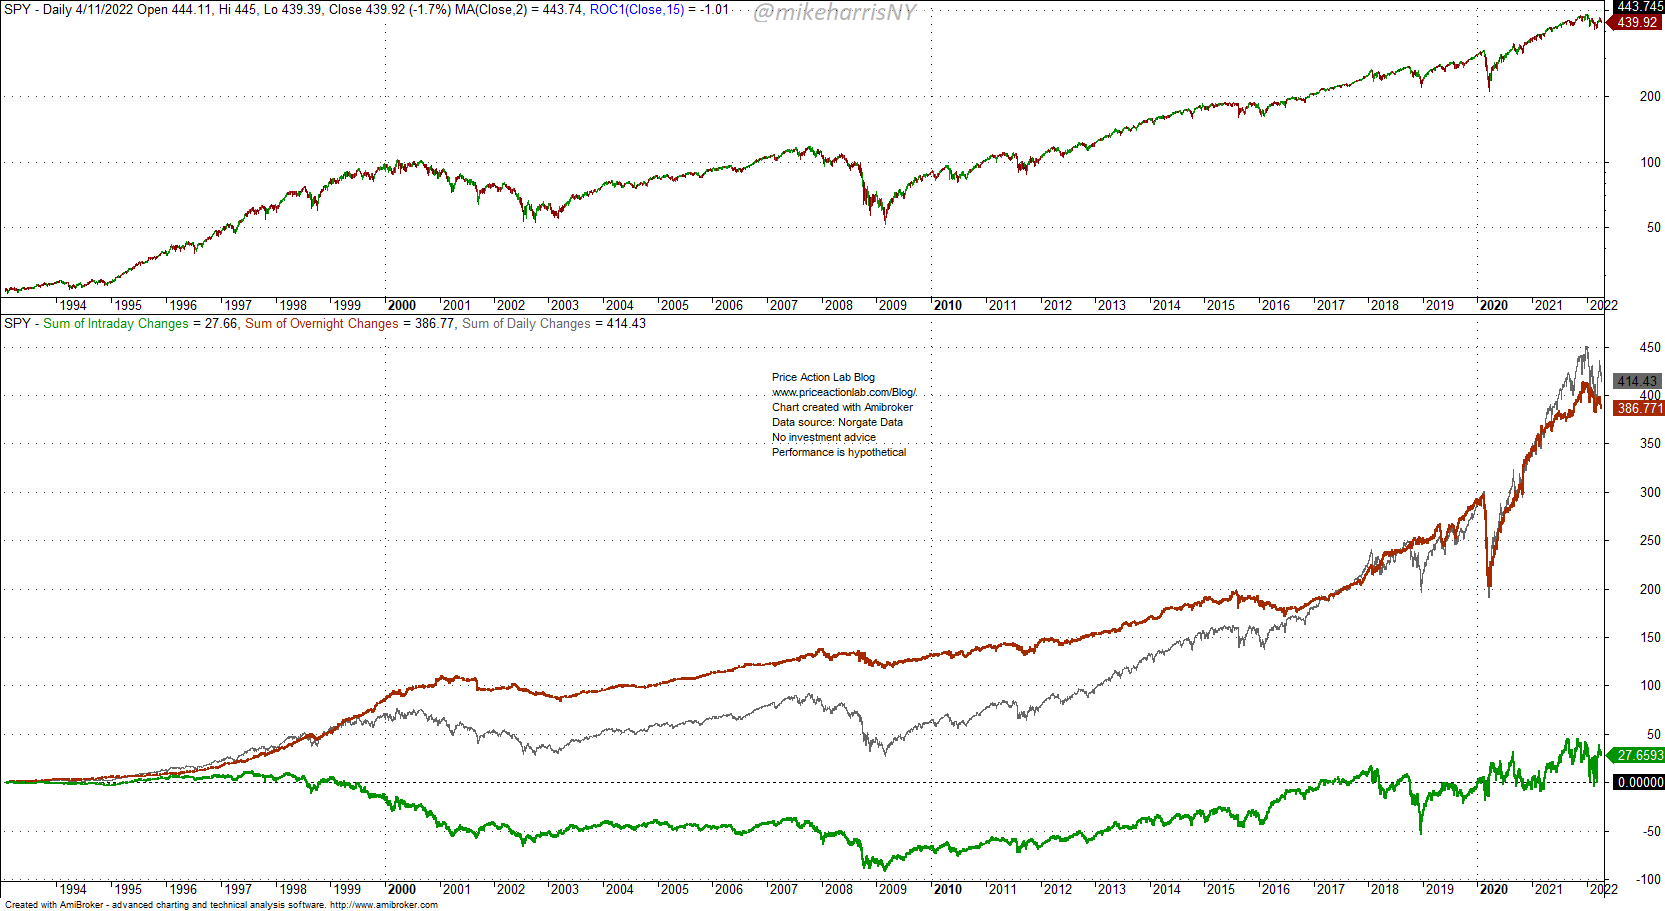
The red line represents the accumulation of daily changes due to overnight and the green line represents the accumulation of regular trading hours changes. The gray line represents the total accumulation. It may be seen that until recently, regular trading hours had contributed nearly nothing to the long-term gains of the SPY ETF. There have been many theories about this significant anomaly, but none is convincing, and in my opinion, this is what it is, and hypotheses are not really going to change much.
2. All the down days have generated a respectable annualized return, but at a much higher drawdown and volatility. The difference between the Turnaround Tuesday anomaly and all down days is statistically significant. Specifically, a t-test generated a p-value of 0.00228 and rejected the null hypothesis of equal means.
3. There are jumps in the equity curve that are attributed to large corrections and bear markets. This can be better seen from the yearly profit chart below.
Turnaround Tuesday Yearly Performance (Price Action lab Blog – Norgate Data)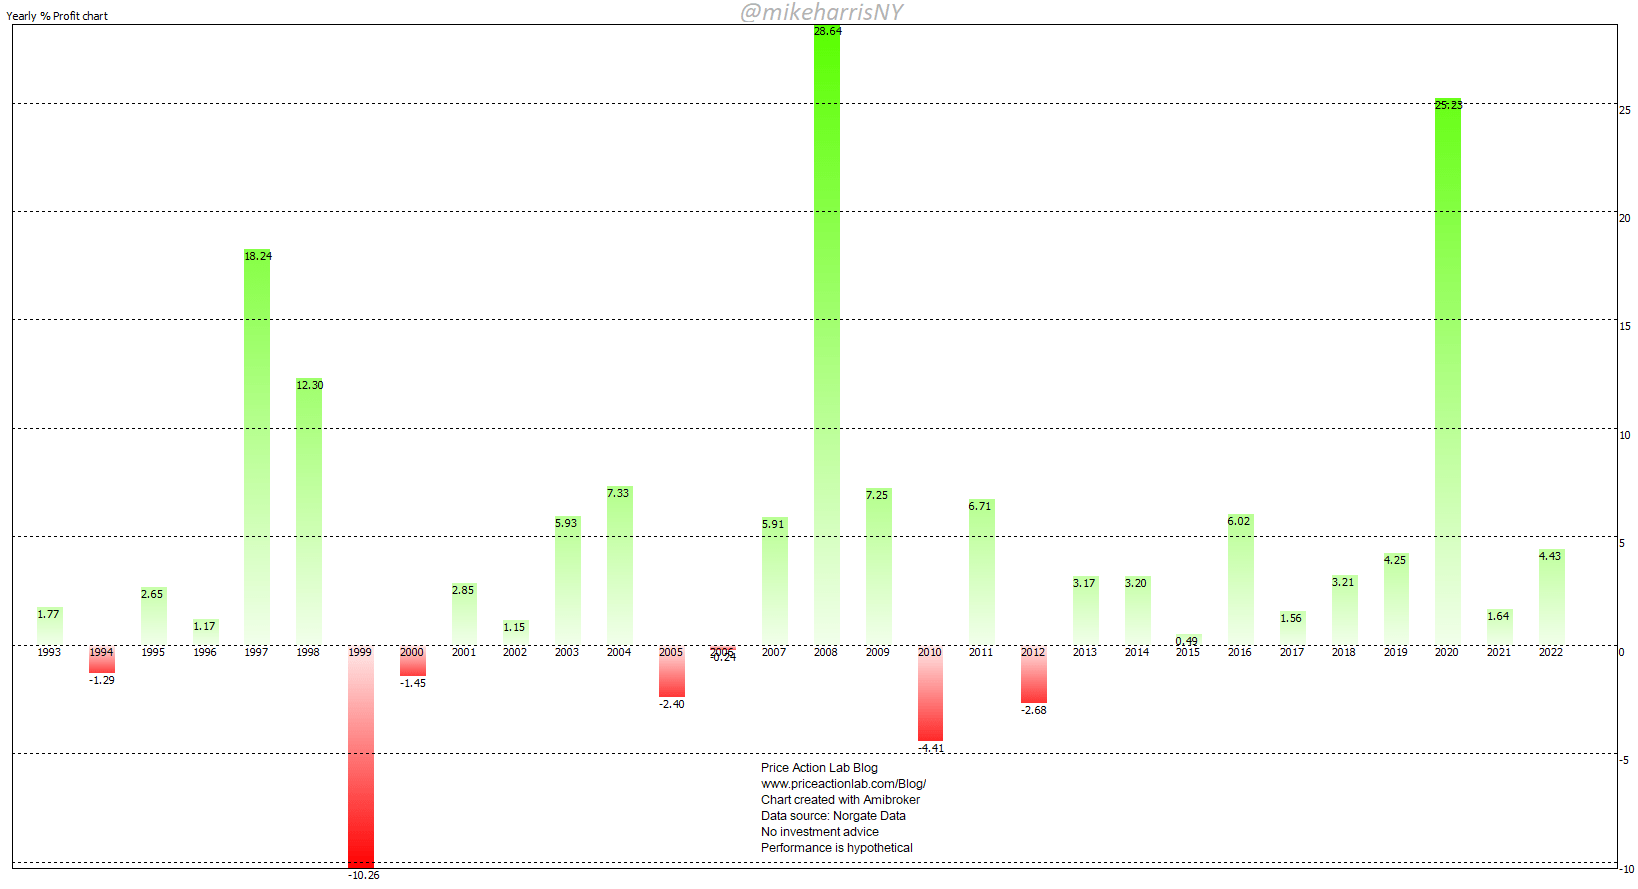
For the whole duration of the dot-com bear market from 2001 to 2003, in 2008, 2011, and even recently in 2020, this calendar anomaly had positive performance. This could have been the result of short squeeze action after a down Monday. Note that the best return for this calendar anomaly was in 2008 at nearly 29%, and the second best was in 2020 at about 25%. This is a significant anomaly and a market inefficiency.
The Turnaround Tuesday strategy has worked well in the past for the SPY ETF, especially during bear markets and large corrections. As with all anomalies and inefficiencies, they will fade at some point, but that could take longer than expected. It is puzzling that these anomalies in price action exist, but this is what it is and trying to find explanations may be an exercise in futility.
Be the first to comment