

Dimensions/E+ via Getty Images
Days after my recent analysis of Newell Brands (NASDAQ:NWL), a company which I wrote about on several occasions in the past, I came across Fortune Brands Home & Security (NYSE:FBHS) – a leading home and security products company with a very interesting history. It is a holding company founded in 1969 as the well known “American Brands”, that was originally involved in the tobacco, insurance, leisure, hardware and spirits industry. The company changed its name in 1997 and split the remainder of its business into two publicly traded companies, FBHS and Beam (Fortune’s spirits portfolio) in October 2011. In its current form, the company manufactures and sells plumbing-related equipment (faucets, accessories, kitchen sinks and waste disposals), security doors, locks, safety and security devices, as well as fire resistant safes, security containers and commercial cabinets. Moreover, the company manufactures high quality bath and kitchen cabinets. Brands owned by Fortune include Moen, ROHL, Victoria+Albert, Perrin & Rowe, Therma-Tru, Master Lock, American Lock, Larson, SentrySafe, AOK, Diamond Brands, KitchenCraft, and Homecrest. Interested readers might want to take a look at the company’s (a bit dated) investor presentation.
Clearly, the company is closely tied to the housing market and this is also emphasized by the fact that The Home Depot (HD) and Lowe’s (LOW) are major customers of the company. Net sales of HD and LOW were 14% and 16% of total net sales in 2021. Sales to all U.S. home center retailers were approximately 29% of net sales in 2021. Besides fears from higher inflation, the business’ exposure to the housing market is likely also the main reason for FBHS’s recent decline in share price, from $110 in late 2021, to $77, as of March 30, 2022.
Compared to FBHS, which can be characterized as a manufacturer of mostly non-discretionary products, NWL is more exposed to discretionary products and therefore also appears to be more sensitive to business cycles. The company manufactures and sells a variety of consumer goods (e.g., camping, writing, home accessories and decoration) under the well-known brands Rubbermaid, Graco, Coleman, Yankee Candle, Sharpie, Dymo and Paper Mate. Newell’s management held a very detailed presentation at the Consumer Analyst Group of New York (CAGNY) in late February of 2022.
Since also Newell has released its full year earnings in February, I incorporated each company’s current financial data in this article, whereas my previous analysis of NWL relied on estimates for 2021. In this article, I will compare the two companies, in terms of profitability, consistency of results, balance sheet quality, and finally also valuation.
Earnings Consistency, Growth and Profitability
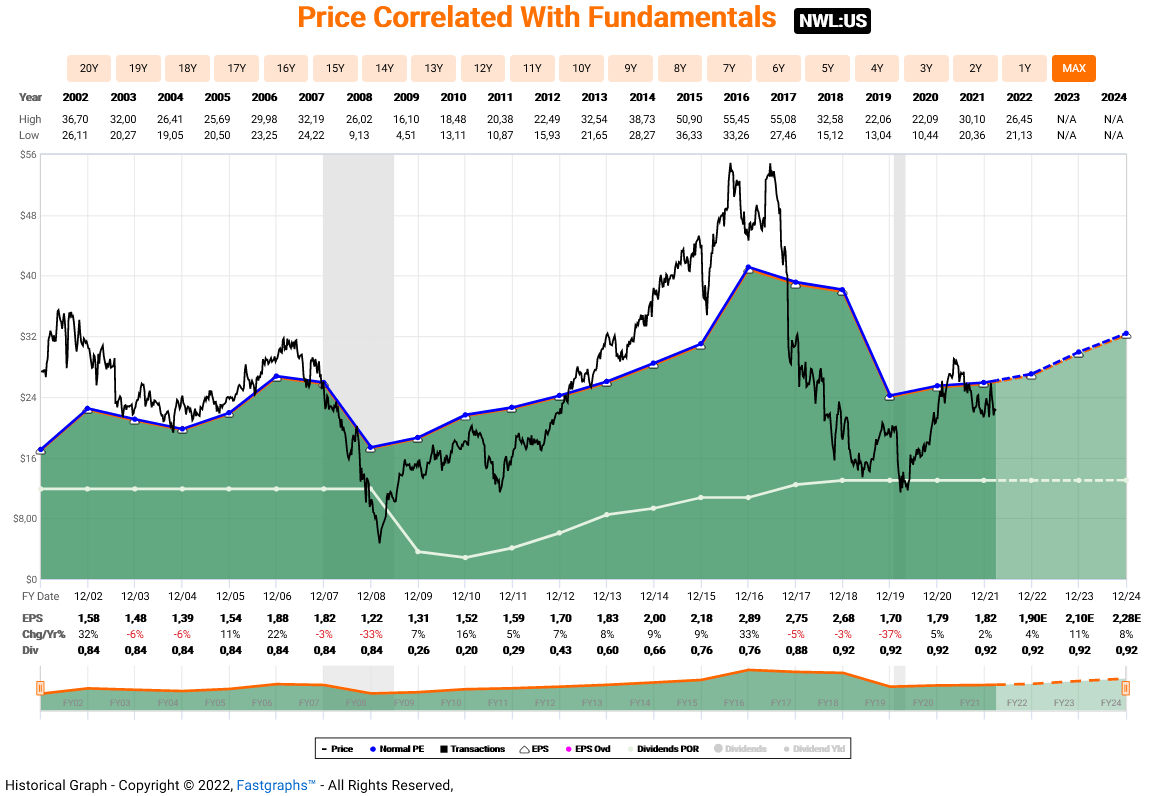
Newell Brands is well known for the debacle stemming from the acquisition of Jarden in 2015 at an operating earnings multiple of 26. The company was unable to properly integrate Jarden’s business units and took on a large amount of debt to fund the acquisition. In 2018, the company faced heat from Starboard Value and Carl Icahn and prepared a turnaround plan, involving a substantial sale of assets, in order to enable deleveraging and share repurchases. Pre-Jarden Newell Brands was a company that reported far from consistent earnings, which is attributable to managerial missteps but certainly also the somewhat cyclical nature of the business. Earnings in fiscal 2008 declined sharply due to the Great Recession (see the FAST Graphs plot in Figure 8), by more than 30%.
Fortune Brands, same as Newell Brands, does not only grow organically but also through acquisitions. FBHS’ earnings growth has been very consistent since the company went public as a result of the split in 2011. The 2011 10-K contains data from which the company’s performance during the great recession can be reconstructed. Operating earnings, adjusted for impairment charges, declined sharply by more than 60% in 2008 and again in 2009, underscoring the company’s dependence on a robust housing market (Figure 1). The current decline in optimism about the housing market is evident in Fortune’s stock price, which has fallen 30% since the end of 2021.
Figure 1: Net sales and adjusted operating earnings of Fortune Brands (own work, based on the company’s 2011 to 2021 10-Ks and the historical data found in the 2011 10-K)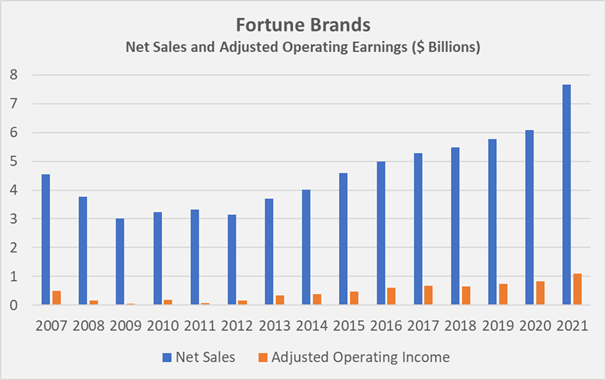
These observations suggest that Newell’s earnings are actually less cyclical than Fortune’s; however, the latter appears to be a better managed company, as indicated by the consistency of sales and earnings growth. A top-line compound annual growth rate (CAGR) of over 8% since 2009 is certainly very good for a business with a comparatively narrow moat. In the context of the pandemic-induced renovation boom, analysts expect earnings to continue to grow at a low double-digit rate over the coming years. FAST Graphs’ two-year analyst scorecard in Figure 2 suggests that the company occasionally beats or misses analyst estimates by a considerable margin and that the boom in 2021 was significantly underestimated. However, I would urge you not to extrapolate the analysts’ previous pessimism into the future; on the contrary, I personally would even consider the double-digit earnings estimates to be somewhat optimistic.
Figure 2: FAST Graphs’ two-year forward analyst scorecard for FBHS (obtained with permission from FAST Graphs; Copyright © 2022, Fastgraphs™ – All Rights Reserved)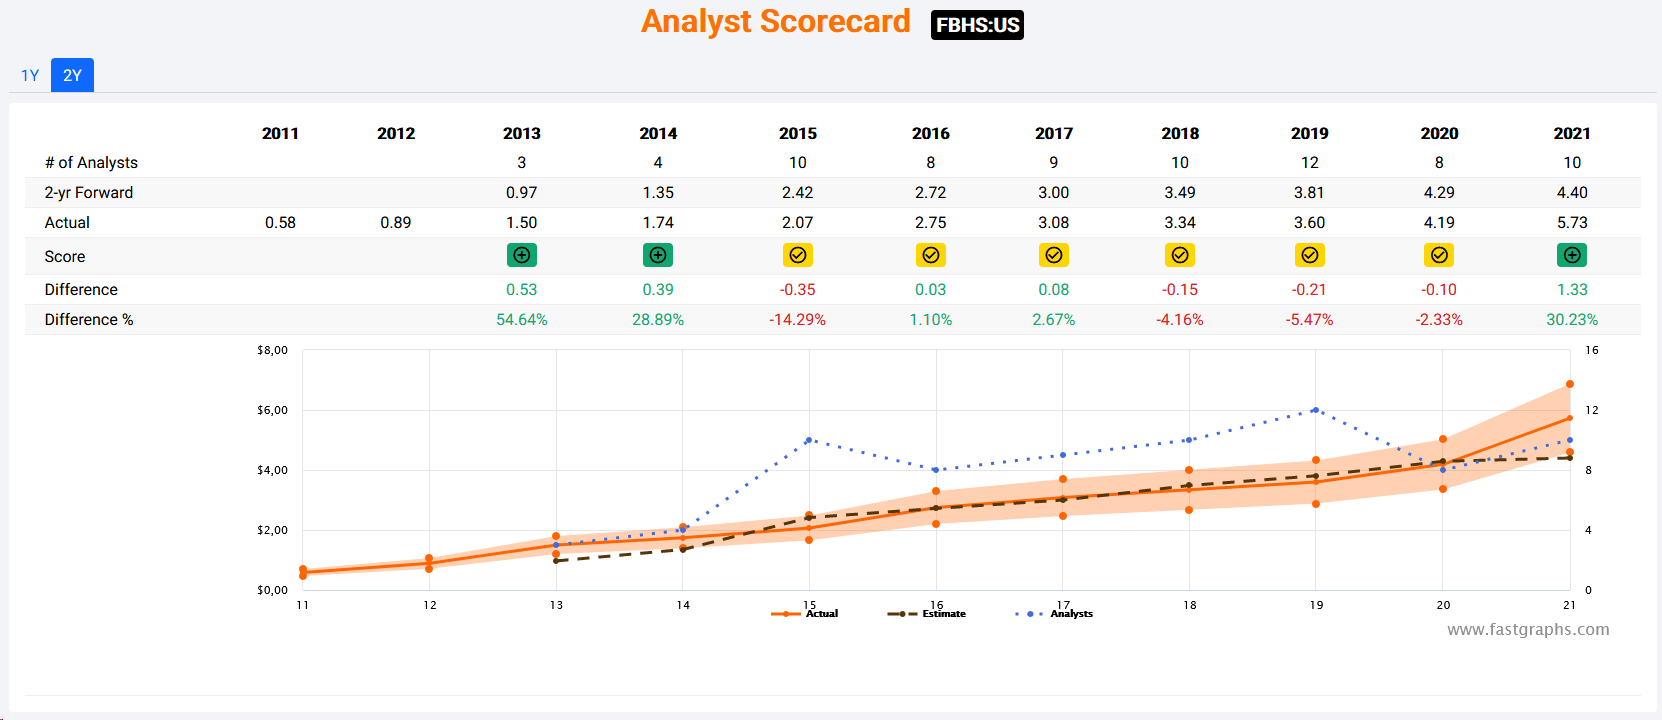
Newell understandably did not participate in the pandemic-induced renovation boom but nonetheless reported very strong sales growth of almost 13% in 2021. It should be noted, however, that Newell’s business suffered disproportionately during 2020, due to the company’s exposure to learning equipment. Going forward, analysts expect the company’s earnings to grow at a mid- to high-single-digit rate, and this is likely a reflection of the expectation of the turnaround continuing to yield tangible results. However, it should be kept in mind that analysts have had difficulties estimating Newell’s earnings accurately (Figure 3). This is somewhat understandable, considering the company’s still ongoing transformation and the fact that management deviated from the proposed plan in the past, as outlined in my article from early 2019.
Figure 3: FAST Graphs’ two-year forward analyst scorecard for NWL (obtained with permission from FAST Graphs; Copyright © 2022, Fastgraphs™ – All Rights Reserved)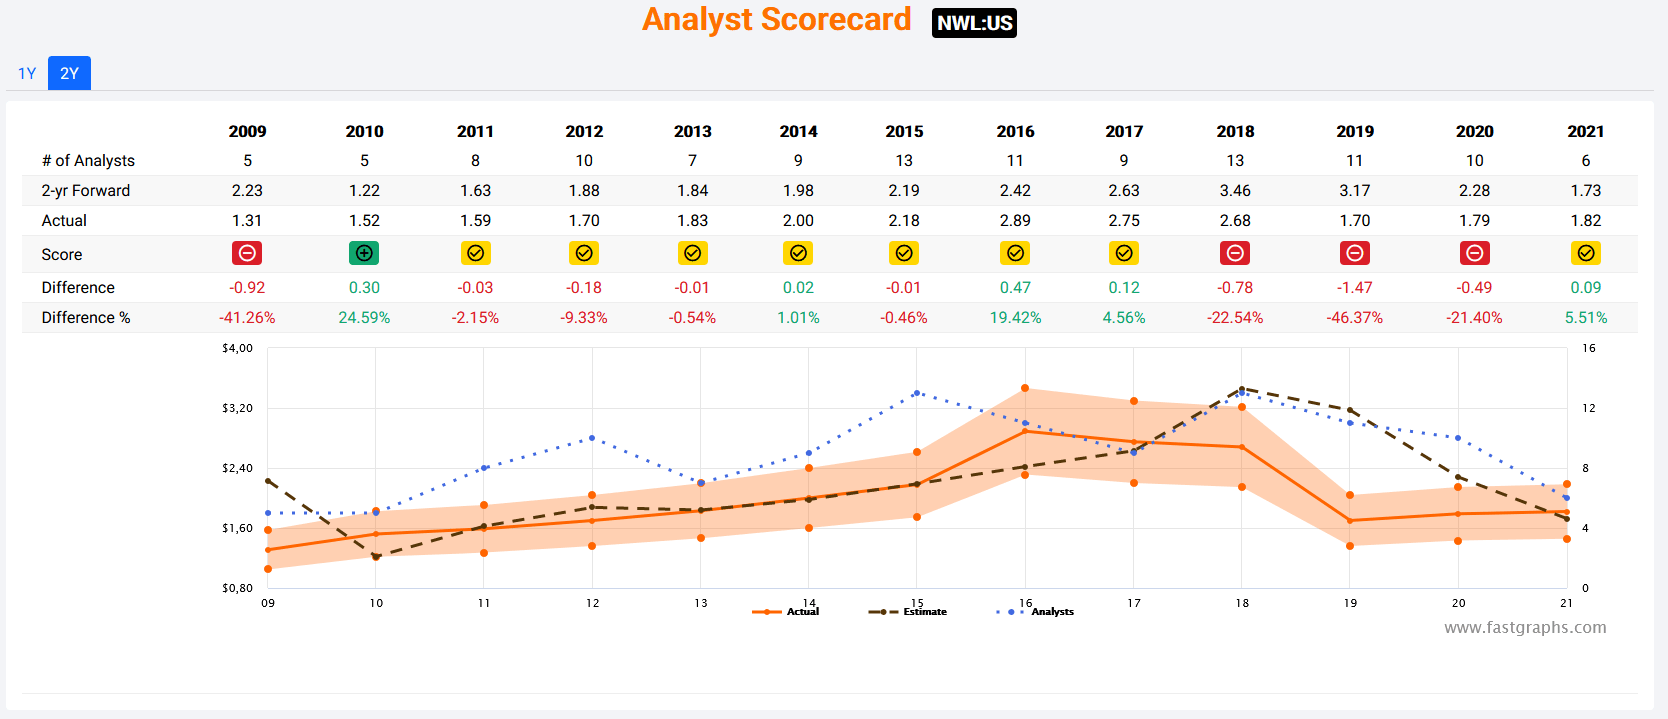
In terms of overall profitability (2021 gross margin 36% versus 31%, 2021 operating margin 15% versus 11%), FBHS clearly appears to be the better pick. Since Newell owns a number of strong brands, its comparatively weak profitability appears somewhat incomprehensible but is likely due to the fact that the company is still working to bring its profitability to an acceptable level. Should Newell’s management succeed in righting the ship, an investment in the company could lead to a comparatively better return, as market participants are obviously still not confident of a successful turnaround. Personally, I am quite optimistic about Newell’s future, especially considering that the company is currently fighting windmills in managing the consequences of the COVID-19 pandemic, i.e., pricing pressures, tight labor market and persisting supply chain disruptions. Tangible evidence of the turnaround taking shape can be noticed from Newell’s cash conversion cycle, which directly relates to the company’s free cash flow (FCF) generating capability (Figure 4). FBHS’ cash conversion cycle is slightly better than that of Newell. This is mainly attributed to Fortune’s faster inventory turnaround of around 75 days.
Figure 4: Newell’s cash conversion cycle since the acquisition of Jarden in 2016 (own work, based on the company’s 2016 to 2021 10-Ks)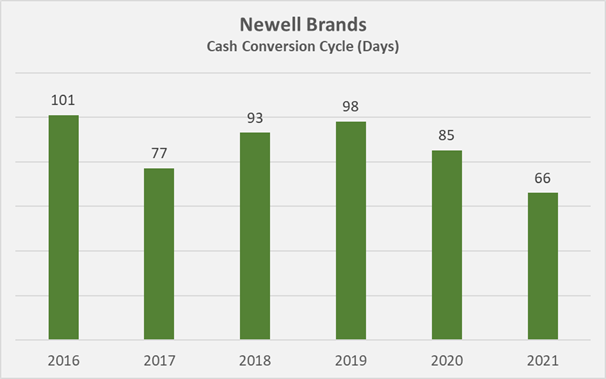
In terms of return on invested capital (ROIC), FBHS also scores much higher than NWL, at 15% versus 10%. Fortune’s high FCF productivity is also emphasized by its substantial cash return on invested capital (CROIC) of 13%, whereas Newell was barely able to earn its weighted-average cost of capital in 2021. Note that I have calculated CROIC on the basis of free cash flow, whereas ROIC employs the more easily manipulated net operating profit after taxes. To remain as realistic as possible, I normalized FCF for working capital movements and share based compensation expenses. However, I have not considered goodwill impairment charges during normalization of Newell’s FCF since I believe that the company wrote off all of its goodwill with questionable earnings power in the process of restructuring. Impairment charges in the cash flow statements of post-split Fortune Brands were not material. My calculations are based on a 2021 normalized FCF of $800 million for Newell Brands and $730 million for Fortune Brands.
Balance Sheet Quality and Dividend Coverage
The fact that FBHS is the more stable company can also be noticed from the weighted-average interest rate of 3.7%, whereas Newell currently pays around 4.7% on its long-term debt. Also, interest coverage in terms of pre-interest normalized free cash flow is significantly higher at Fortune Brands (9.6x versus 4.3x for NWL). Fortune’s equity ratio is also considerably higher than that of Newell, at 39% versus 29%. Both companies carry a substantial amount of goodwill on their balance sheets, i.e., each roughly 80% in terms of shareholders’ equity. More than $11 billion (!) of Newell’s goodwill, mostly relating to the costly acquisition of Jarden, have been written off since 2018. As already mentioned, impairment charges are rarely observed in FBHS’ financial statements, speaking of management’s prudence in terms of capital allocation.
Assuming that both companies eliminate their dividends and used all of their normalized free cash flow to pay down debt, it would take Newell more than six years to fully deleverage, whereas Fortune’s indebtedness appears much more manageable at a notional debt repayment period of less than four years. However, it is important to note where Newell is coming from and I believe this is best illustrated by Figure 5, which shows the company’s historic notional debt repayment in years of normalized FCF.
Figure 5: Newell’s notional debt repayment in years of normalized free cash flow (own work, based on the company’s 2015 to 2021 10-Ks and own estimates)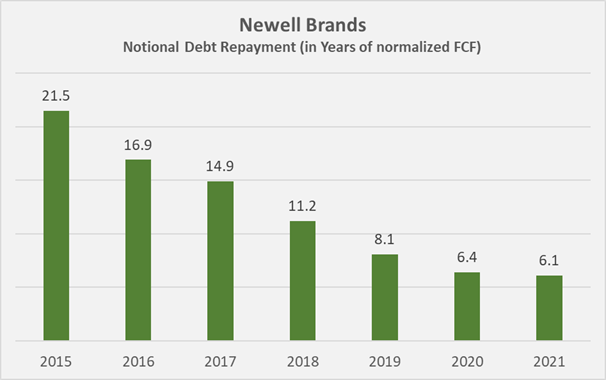
Neither Newell’s, nor Fortune’s debt maturity profile appears concerning (Figure 6); however, Newell could be required to refinance a material amount of its long-term debt at a potentially unfavorable rate.
Figure 6: Fortune Brands’ and Newell Brands’ debt maturity profiles (own work, based on the respective company’s 2021 10-K)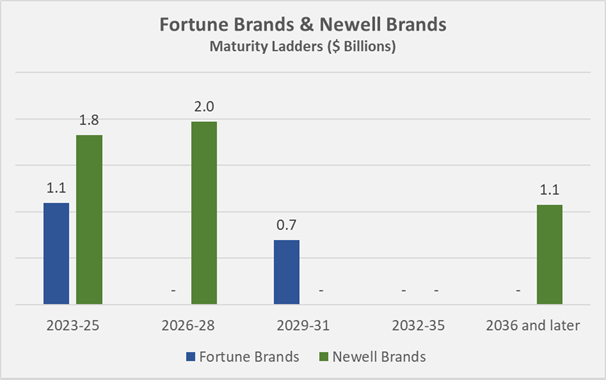
In conclusion, I view Fortune’s financial leverage far from concerning, but am also quite positive on Newell, which has been deleveraging substantially over the last couple of years. A successful turnaround takes time, and management is certainly fighting on a number of fronts here, but the results show me that the company is on the right track.
Both companies pay a dividend, and Newell’s payout ratio in terms of normalized free cash flow is considerably higher, although certainly not alarming, at 50%, whereas FBHS is only paying out around 20% of its normalized FCF. In terms of dividend yield, Newell looks much more compelling at over 4%, while the shares of Fortune Brands yield only 1.4%. With a long-term CAGR of over 10%, FBHS could be a compelling dividend growth pick. Nevertheless, such an investment requires considerable patience, as it is expected to take more than 11 years until the current yield of Newell is reached – notably not considering reinvested dividends. To be clear, I do not view Newell as a yield trap, considering that the dividend is well covered by FCF. Management remained committed to the dividend also during very difficult times (i.e., during the COVID-19 pandemic), and I expect it to resume growth as the company deleverages and continues to improve FCF.
While NWL understandably is not repurchasing a material number of shares (apart from the recently announced buyback related to a part of Carl Icahn’s 10%+ stake), Fortune Brands is routinely buying back shares with its remaining FCF. The company has just announced the authorization of share repurchases of up to $750 million (roughly 7% of the shares outstanding, assuming a price per share of $77). Since 2011, FBHS more than offset the dilution through stock-based compensation, having reduced the share count by 10%. Conversely, noticeable but still far from concerning dilution is visible at Newell, with the number of weighted average diluted shares outstanding having increased from 423.9 million in 2019 to 428.0 million in 2021.
Valuation
Several valuation metrics, calculated on the basis of each company’s 2021 adjusted earnings, book value, sales and normalized FCF are shown in Table 1. Understandably, the shares of Newell Brands trade at lower multiples due to the still ongoing turnaround and the associated uncertainties. Fortune Brands is a more stable business and the market rightly attaches a relative premium to the shares. Note that the gap in FCF yield should not be overemphasized as Newell is a much more leveraged company and this metric, same as P/E, PEG, P/B and P/S, does not consider debt. My DCF model assumes a cost of equity of 10% for both investment cases, whereas I expect Fortune’s FCF to grow at a mid-single-digit rate over the next ten years and by 2% thereafter. For Newell, I assumed 3% FCF growth over the next ten years and 2% thereafter.
Table 1: Valuation metrics for Fortune Brands and Newell Brands; note that the PEG ratio has been calculated on the basis of 10-year normalized FCF growth; (own work, based on each company’s 2016 to 2021 10-K, own estimates, and each company’s closing share price on March 30, 2022)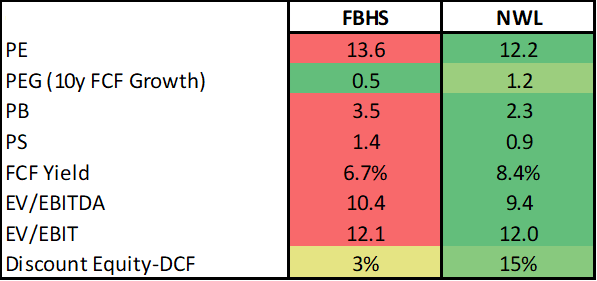
Taking into account historical valuations, Newell also appears cheaper than Fortune; however, I believe that both companies trade at a good value at the moment. A P/E of below 14 certainly provides a considerable margin of safety, as the FAST chart for FBHS in Figure 7 shows very nicely. Newell’s margin of safety in this context appears somewhat smaller (Figure 8).
Figure 7: FAST Graphs chart for Fortune Brands Home & Security, based on adjusted operating earnings (obtained with permission from FAST Graphs) Figure 8: FAST Graphs chart for Newell Brands, based on adjusted operating earnings (obtained with permission from FAST Graphs)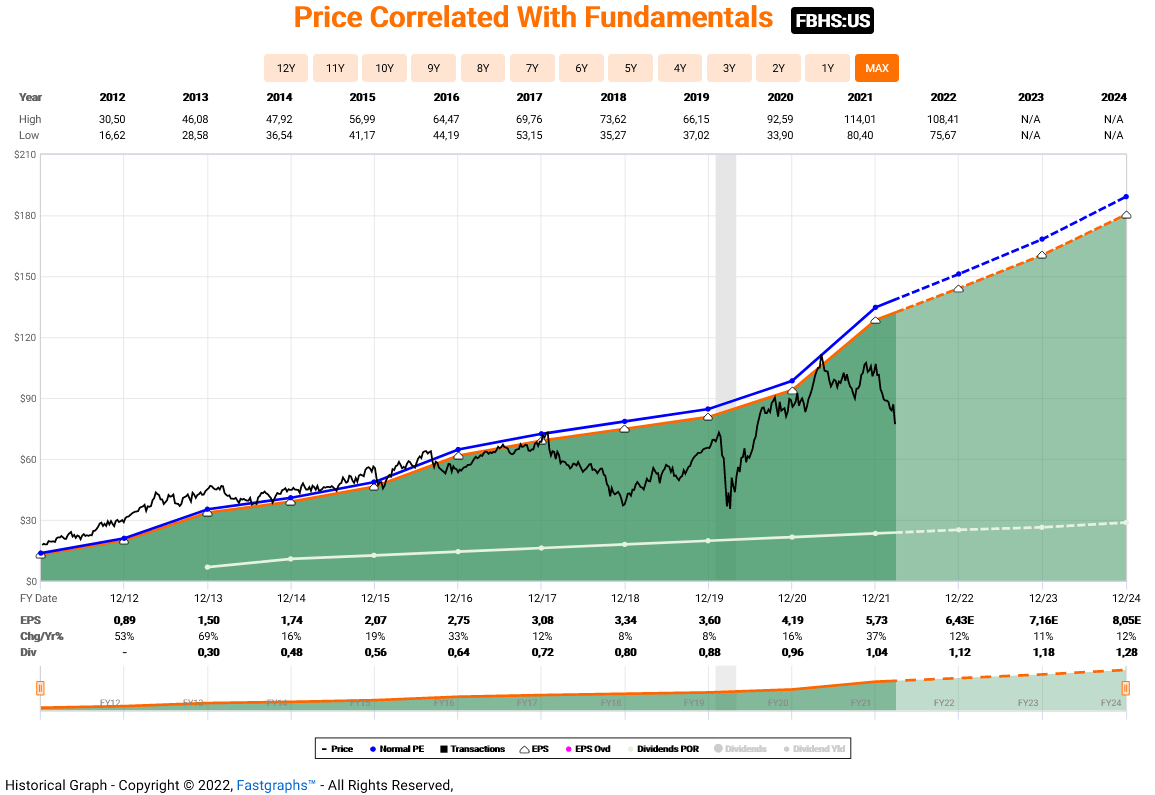
Conclusion
Fortune Brands is no longer what was once known as the mighty “American Brands”, and has focused its portfolio on home-related products. Nevertheless, it is a very well-managed company with a solid track record. At least since the separation from Beam Inc. in 2011, management has not made any significant missteps and this is reflected in the consistency of earnings, the robust growth and the strong balance sheet. In stark contrast, Newell suffered from managerial missteps in the past and is therefore still struggling to turn itself around. However, it seems reasonable to give credit to the current management, fighting on several fronts in arguably very difficult times. Both companies are cyclical to a certain extent but the earnings of Fortune Brands are expected to suffer disproportionately in a potential recession that most certainly also involves the housing market.
I like both companies at their current valuations, but view Fortune Brands as a less risky bet with potentially less upside. However, it should not be forgotten that the company’s shares still trade against the backdrop of very strong earnings due to the pandemic-related boom in renovations, same as Home Depot or Lowe’s, even after the recent decline. Striking a more positive tone, it seems entirely plausible that the current trend will continue, especially as more and more people are likely to opt for renovation rather than purchasing a new home in view of the persistently high inflation rate. In the context of inflation, I view Newell Brands as a somewhat mixed bag. While the company has a wide range of brands with strong pricing power, the discretionary nature of many of these products should also be considered.
From the perspective of dividend-growth investing, Newell appears much more compelling at a yield of over 4%; however, the dividend is not expected to grow for the foreseeable future as management likely – and understandably – prioritizes deleveraging. I am confident that Fortune Brands will continue to increase its dividend at least at a high single-digit rate, considering the low payout ratio and the comparatively high profitability. Nevertheless, at a current yield of only 1.4%, dividend growth investors require a lot of patience until a meaningful yield-on-cost is achieved.
Be the first to comment