

Kativ/E+ via Getty Images
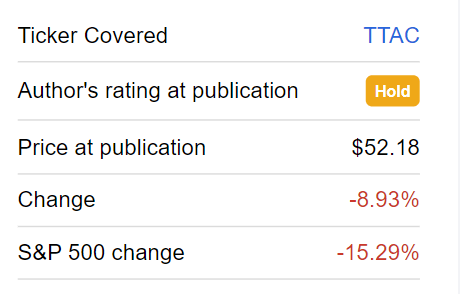
The previous time I wrote about the FCF US Quality ETF (BATS:TTAC), a free cash flow-centered actively managed investment vehicle, was in April 2022 when I concluded that the strategy it leverages is, by all means, powerful, yet not completely invulnerable in the environment characterized by the reduction in growth premia amid capital shortage supervening from higher interest rates across the globe and principally in the U.S. Long story short, I flagged that its large exposure to richly priced companies could have been an issue.
At this juncture, TTAC certainly deserves an update for a few reasons.
First, the market has been through a few ups and downs since then, with the direction mostly defined by the releases of inflation data and interest rate decisions and some short-lived inertia afterward as investors were thinking in terms of the changes in the cost of capital and how this could affect trading multiples and subsequently give their portfolios a boost or trigger something I would call a quick and painful removal of the excesses amassed.
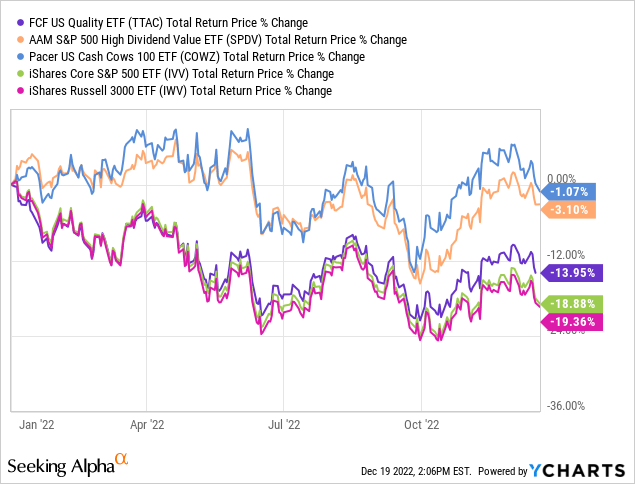
And though it declined by almost 9%, the fund still fared much better than the iShares Core S&P 500 ETF (IVV), as well as the iShares Russell 3000 ETF (IWV), which tracks the index the FCF ETF is supposed to outperform while not compromising on volatility.
Seeking Alpha
Overall, TTAC delivered a total return 4.5% higher than IWV during the first eleven months of the year, finishing ahead of it during seven. Another way of saying, if it does not turn sharply lower in December, then 2022 could become its best year since its inception in 2016.

Created by the author using data from Portfolio Visualizer
And second, since we are talking about an actively managed investment vehicle that has replaced a meaningful share of its holdings since March, a careful review of the portfolio changes should also be of interest to my dear readers.
So we should look carefully at the performance delivered and assess the current factor exposure to answer the question about whether TTAC has a better value & quality proposition now, a factor mix I consider of remarkable relevance at this point, and, hence, whether it is positioned to outperform the market going forward.
As a refresher, TTAC’s investment strategy is based on a proprietary FCF-centered model designed to select approximately 150 of the strongest U.S. equities. Additionally, it steers clear of companies with worrisome rises in share count as well as concerning increases in leverage. A remark worth making is that the strategy incorporates environmental, social, and governance considerations as well.
It is noteworthy that speculative growth names naturally cannot qualify for inclusion since in most cases they are incapable of delivering even a measly cash surplus left after covering opex and capex, so it seems they are filtered out quickly, which is important in an era of higher rates, scarcer capital, and lower risk appetite.
Since my previous article, the TTAC equity basket has seen a relatively profound recalibration, with the names from the end-March version now accounting for less than 76% of the 142-strong portfolio.
The table below contains the top ten stocks removed, with the weights as of March 30.
| Stock | Weight |
| Berkshire Hathaway (BRK.B) | 1.40% |
| S&P Global (SPGI) | 1.00% |
| Advanced Micro Devices (AMD) | 0.94% |
| Meta Platforms (META) | 0.88% |
| The Interpublic Group of Companies (IPG) | 0.82% |
| Sherwin-Williams (SHW) | 0.81% |
| American Financial Group (AFG) | 0.78% |
| The Allstate Corporation (ALL) | 0.78% |
| Goldman Sachs (GS) | 0.72% |
| Workday (WDAY) | 0.72% |
Of course, there have been a few additions also. The ten most notable stocks that have been added to the portfolio since then are as follows (weights as of December 16).
| Stock | Weight |
| ONE Gas (OGS) | 0.88% |
| Merck & Co. (MRK) | 0.79% |
| Adobe (ADBE) | 0.76% |
| Aon (AON) | 0.75% |
| Gilead Sciences (GILD) | 0.74% |
| Texas Pacific Land Corporation (TPL) | 0.73% |
| Cheniere Energy (LNG) | 0.69% |
| Enphase Energy (ENPH) | 0.66% |
| Medpace Holdings (MEDP) | 0.63% |
| CVS Health (CVS) | 0.62% |
TTAC remains strongly bullish on the mega-cap league, with the weighted-average market cap at $298 billion. What is also stable is the fund’s focus on the IT sector; tech has retained its first place in the sector mix, with about 32% now vs. 33.3% weight in March.
Next, it is apparently positive on Apple (AAPL), its major investment with about 5.6% weight (6% in March); since AAPL has about $111.4 billion in LTM FCF and an over 5% FCF yield, this is barely coincidental. Next, the second-largest position (2.7% weight vs. 3.6% in March) is Microsoft (MSFT), with its similarly substantial FCF of $63.3 billion.
However, the third-largest position has changed; at this point, it is Exxon Mobil (XOM), with a 1.9% weight vs. only ~0.97% previously, while Alphabet (GOOGL) retreated to sixth place. Again, this is explainable as on the back of galloping oil prices and consequently surging revenues, this energy supermajor’s FCF this year might climb to as high as $58.4 billion.
Elevated prices, robust profitability
Now, let us discuss the essential factors.
First and foremost, valuation should be examined. To begin with, the weighted-average earnings yield of this portfolio is about 5.5%, as per my calculations, which translates into around 18x P/E (Last Twelve Months). Is this an acceptable level? It probably is, yet obviously still not appealing enough for a higher interest rates environment. For better context, IVV had a weighted-average Price/Earnings of around 20.8x, which I discussed in this article which has been published recently. So it seems TTAC has an edge here, especially considering about 11.7% (about 12.6% in March) of its holdings have a B- Quant Valuation grade or better vs. IVV’s ~7%. However, this is still a measly level, at least for my taste.
The next metric to assess is the median FCF yield for the portfolio (ex-financials and real estate). As per my calculations, the figure is 5.7%, which is relatively attractive, though of course again not ideal.
Turning to quality, TTAC’s holdings still have impeccable profitability, with none of the holdings having a D+ Profitability grade or worse, precisely like in March. None is FCF-negative (obviously excluding financials and real estate), with the median FCF margin at 20.5%, as my calculations show. Meanwhile, a share of loss-making companies rose modestly, to ~4.1% from ~2.7%, which is not an issue in my view.
Final thoughts
TTAC has a well-designed investment strategy amalgamating quality assessed via the proprietary FCF model and ESG considerations. It has shown resilience this year, remaining ahead of IWV and IVV for now, thus partly proving the point that quality-heavy portfolios should do better in the higher rate environment than those tilted toward growth.
However, funds using FCF in their stock selection and, unlike TTAC, not compromising on value have still been doing better. For reference, below are the total returns of the Pacer US Cash Cows 100 ETF (COWZ) and AAM S&P 500 High Dividend Value ETF (SPDV).
In sum, to remain consistent with my preference for high quality and appealing valuation, I would not say I am totally satisfied with multiples of most of TTAC’s holdings, even though profitability is the one I see no reason to dislike. I understand perfectly that rich valuation is resulting from the quality and size premia, yet I do not view this as a sufficient reason to ignore elevated multiples that still pose risks at this point, so the Hold rating is maintained.
Be the first to comment