

Olemedia
Company Snapshot
Trinseo PLC (NYSE:TSE), is a specialty materials company whose expertise primarily lies in the fields of plastics (~31% of group sales), latex polymers/binders (~25% of group sales), and polystyrene production (~23% of group sales). Even though TSE has a presence across the globe (40 manufacturing plants and 11 R&D centers across 15 countries), the bulk of its revenue (~57% of group sales) comes from the European region. The company’s products are utilized by a whole host of end markets, most notably the building & construction space. TSE is a small-cap stock, with a market-cap of roughly $650m.
Corporate overview presentation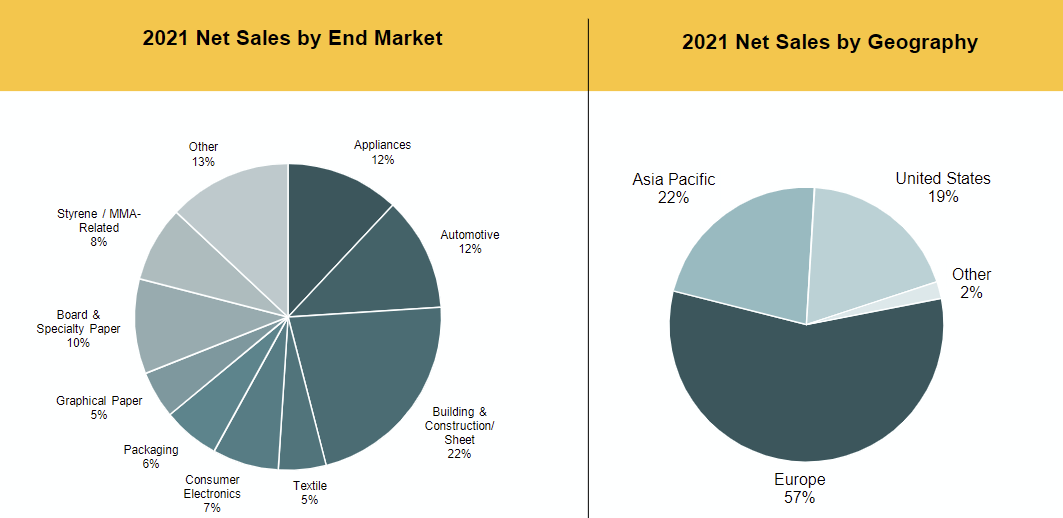
Here are some big-picture thoughts on what I think could be a high-risk-high reward play. Let’s start with a summary of some of the concerns I have over the TSE story.
What’s Bad
It’s all but likely that the Euro region will witness a recession, and cyclical stories such as TSE that derive a bulk of their revenue from those regions are unlikely to flourish. TSE management had previously stated that slowing demand and destocking initiatives across Europe, particularly in the construction markets, would serve as a drag. The Eurozone construction PMI slipped into contraction territory in May and currently hovers at lowly levels of 45. It isn’t just the headline PMI number; job cuts, new order declines, cost pressures, and expectations for the future all continue to point to some lingering pressures that won’t disappear overnight.
Trading Economics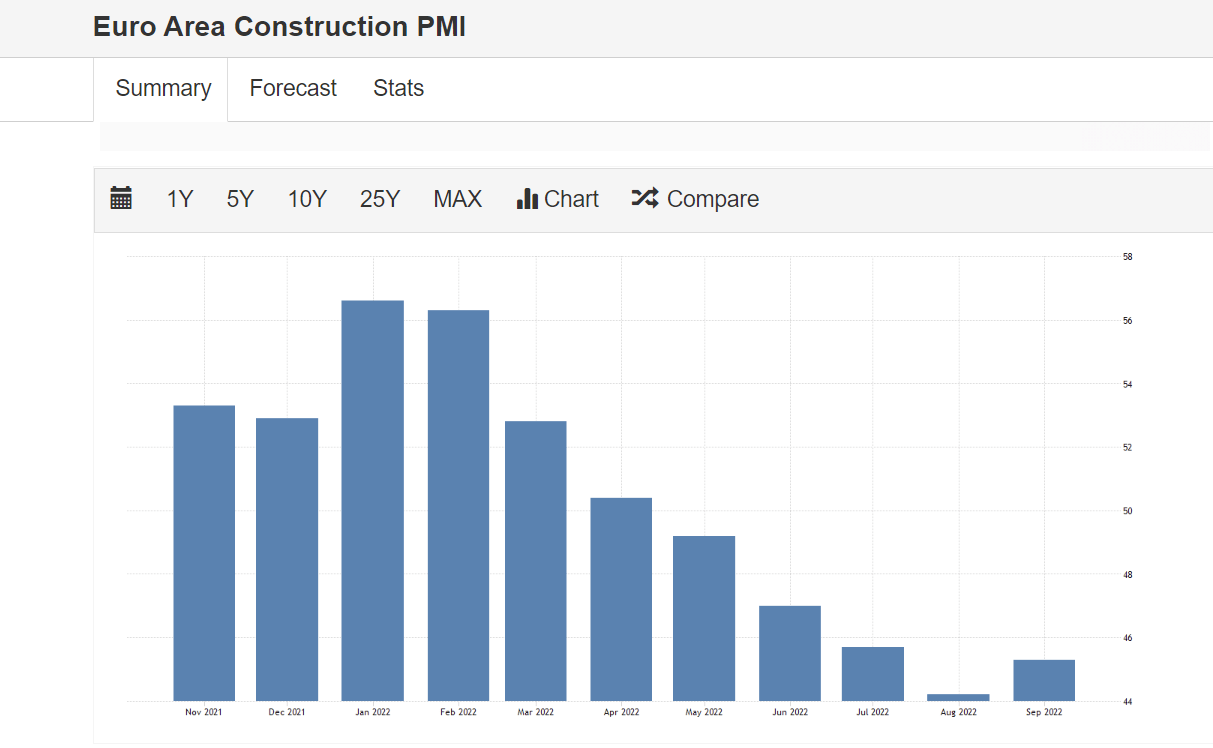
The adverse effect of high natural gas prices has also weighed on the region’s styrene margins which were in negative territory all through Q3.
In addition to Europe, it also appears as though the Chinese markets have failed to show any meaningful progress, particularly when it comes to demand for polycarbonate (70% of demand comes from China) and this is a region that the TSE management had been hoping would improve, for a couple of quarters now.
TSE’s level of financial gearing is another cause for concern in the current environment; the debt on the books which stood at $1.2bn pre-pandemic has more than doubled to levels of over $2.4bn (71% of the total capital base). Having significant debt on your books doesn’t necessarily have to be an issue if your operating model can generate ample cash flow, but that isn’t the case with Trinseo. Note that the ability of TSE’s operating cash flow to cover its debt has fallen to its lowest level in 5 years.
YCharts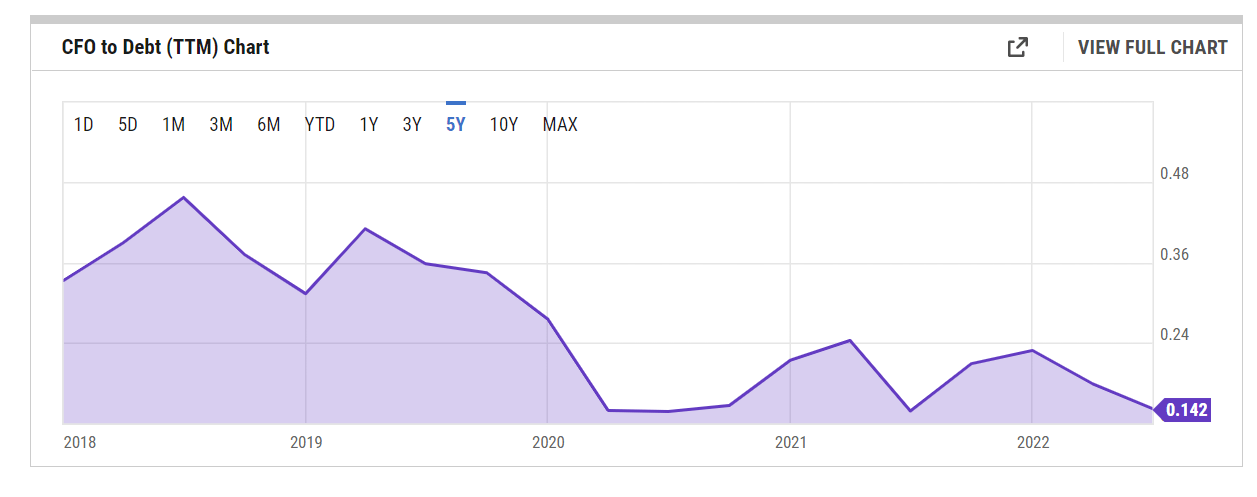
Previously, TSE was known for having approximately $460m of cash and cash equivalents on its books (per quarter). At the end of Q2, this had dropped to $264m, and by the looks of the preliminary results announced on the 18th of October, it has dimmed even further to $243m.
A bloated debt position, and weakening cash position also means that TSE comes across as pricey on the basis of the forward EV/EBTIDA metric. As per consensus estimates, the FY23 EBITDA will likely grow by 20% annually and hit $430m. On the basis of the pre-Q3 EV, of $2.78bn, you’re looking at an elevated EV/EBITDA of 6.46x. This is well above the 5-year forward EV/EBITDA average of 5.8x, and closer to the upper end of the 5year range of 3.4-7.8x.
What’s Good
Investors could look at the TSE stock in more favorable terms if it could make its revenue base less cyclical; I believe TRINSEO has been taking baby steps to address that, and the impact of this could be reflected over the next 12-18 months.
Firstly, the company has been using a greater proportion of recycled content in their products (for instance, R-LIFE acrylics consist of chemically recycled PMMA) and this puts them in an enhanced position to win contracts with clients who are based in less cyclical markets. It’s worth noting that in H1, the volume from recycled content products grew by 62% YoY.
Crucially, there’s one other catalyst brewing in the background that would be taken very well by the markets when it comes to fruition; I’m talking about the potential disposal of their styrenics business which is another cyclically-themed operation. Currently, it appears as though talks have stalled, not on account of a lack of buying interest, but on account of challenging financing conditions for prospective buyers. Put another way, it’s a matter of “when”, rather than “if”, and the disposal of that unit should also do a world of good in mitigating TRINSEO’s heightened leverage position.
In the previous section, I wrote about how TRINSEO’s cash-generating position was not in the best of health on account of steep raw material costs and inventory builds, but I’d like to believe we’ve seen the worst here. When the company published its Q2 results in early August, it stated that if natural gas prices were to remain at current levels, H2 costs would potentially be $170m higher in H2. Nonetheless, prices have come off quite significantly from the August highs, and I imagine in Q4, you’ll find some significant downward adjustments to TRINSEO’s cost base, given those storage facilities in the EU are close to being inundated.
What will also help with lower costs and higher cash generation is the company’s decision to close its Boehlen Styrene plant which had been generating $30m of losses over the past 4 quarters. Next year, the company will also likely wrap up the upgradation of its legacy Trinseo ERP system, which is poised to generate another $25m of annual savings.
The chart below highlights TSE’s monthly price imprints since its listing date. We can see that the stock is currently trading a lot closer to a price zone that had served as a floor on two separate instances over the last 8 years. The probability of bottom formation has also been enhanced by the dwindling appetite of short-sellers; the % of float that is short which stood at over 8% as of mid-September, has now dropped to just 3%.
Investing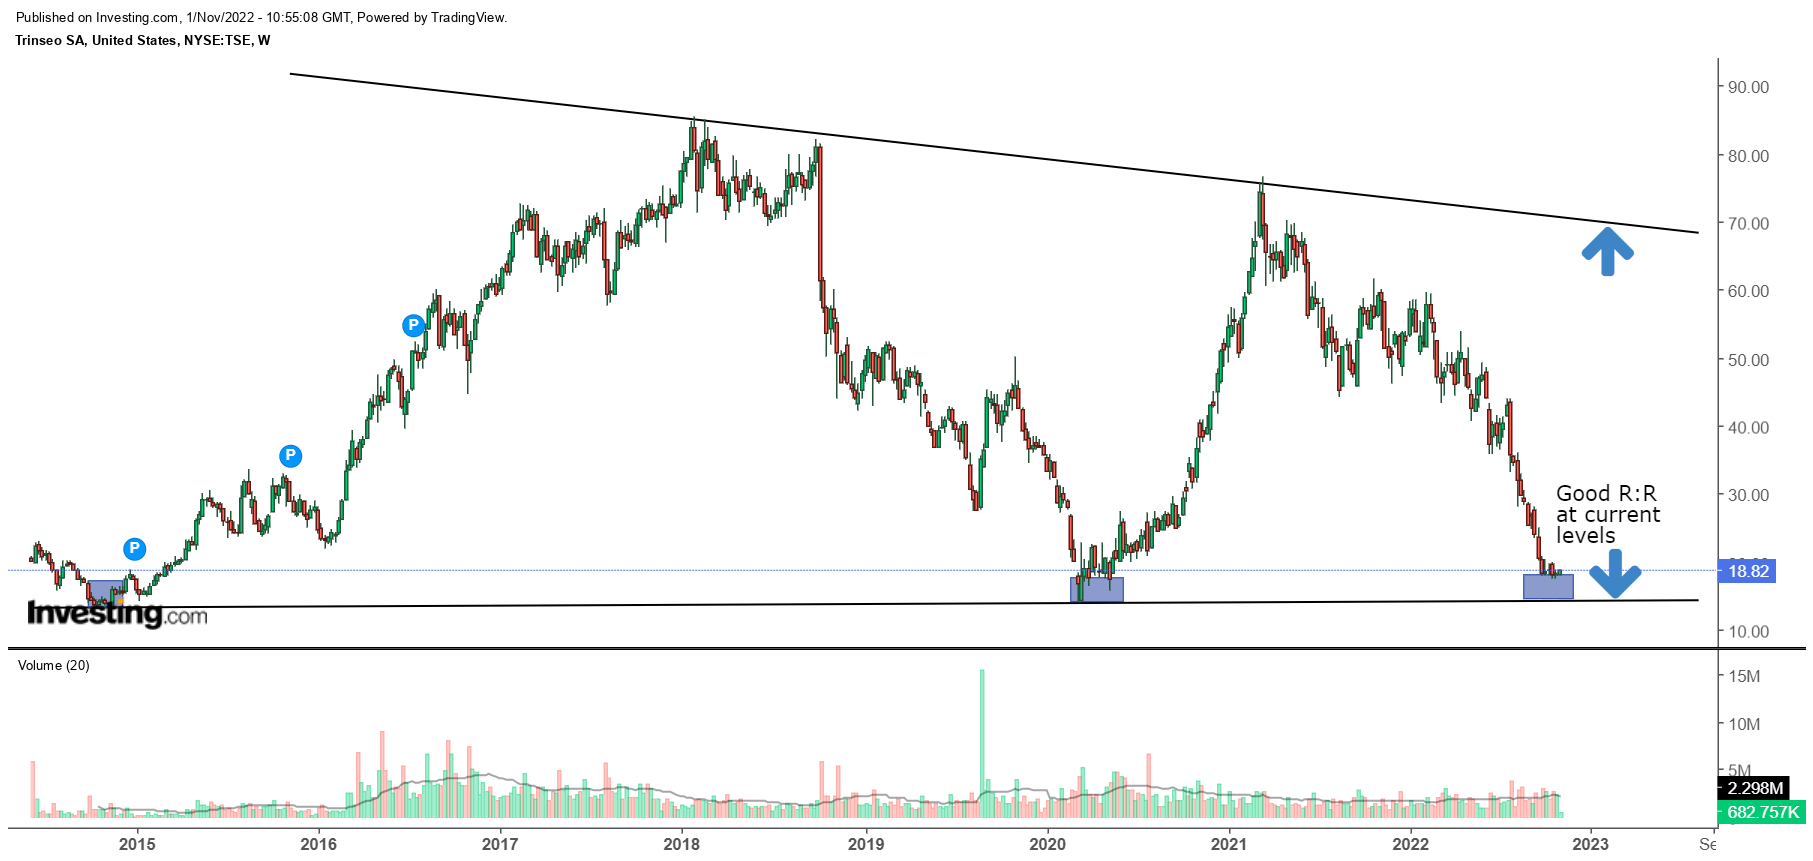
Even if you think there could be further negative surprises during the Q3 call, which could prompt further drawdowns to the sub $14 levels (the lower boundary), I think you get some solid insurance in the shape of a forward yield of 6.8% which is infinitely greater than what you typically get from Trinseo stock (5-year average of 3.45%). At these relatively low price levels, there’s also a good chance that the management of TSE gets more involved in utilizing the 18-month $200m buyback war chest which could provide further support.
The next chart throws some light on how Trinseo could serve as a useful mean-reversion candidate for those fishing for opportunities within the small-cap materials arena. Note that the relative strength ratio of TSE and the ETF – Invesco S&P Small-cap Materials ETF (PSCM), has now hit levels last seen in late 2015 before there was a bounce (it is also around 3x lower than the mid-point of the range).
Stockcharts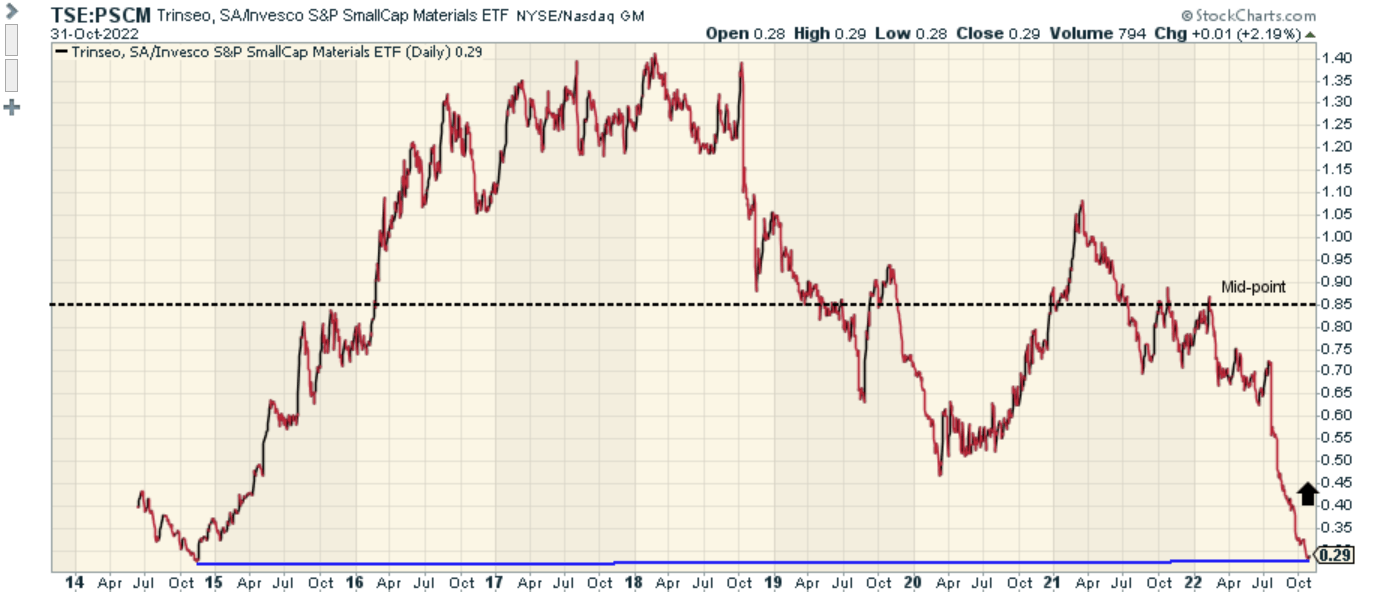
Be the first to comment