

pabst_ell/iStock Unreleased via Getty Images
Introduction
Transocean (NYSE:RIG) released its first-quarter 2021 results on May 2, 2022.
Also, Transocean published its fleet Status Report on April 25, 2022.
The company indicated, “The aggregate incremental backlog associated with these fixtures is approximately $87.2 million. As of April 25, the company’s total backlog is approximately $6.1 billion.”
Since then, Transocean announced three more significant contracts for a total of $381 million in Backlog.
- Deepwater Skyros: 10-wells starting Dec. 2022 with a daily rate of $310K/d for 540-day. Additional backlog of $167 million.
- Deepwater Invictus: 2-wells with a daily rate of $375/d. Additional Backlog of $33 million.
- Transocean Spitsbergen: 9-wells with an additional backlog of $181 million.
As of June 12, 2022, the estimated backlog remains at $6.1 billion.
Note: I have followed RIG quarterly since 2014 with 132 articles and counting. This new article is a quarterly update of my article published on April 5, 2022.
1 – 1Q22 Results snapshot
Transocean came out with a lower-than-expected quarterly adjusted loss of $181 million or $0.28 per share compared to a loss of $0.19 per share a year ago. These disappointing results were due to a drop in revenues from the year-ago quarter and lower-than-expected utilization, now at 52.7%, from 53.4% the preceding quarter.
However, as always, Jeremy Thigpen’s optimism about the future gives us hope that things will eventually improve for this struggling industry.
CEO Jeremy Thigpen said in the conference call:
Oil prices, while somewhat volatile, have remained highly supportive and are driving a steady increase in offshore activity. We continue to see a tightening of the offshore market unfolding across multiple regions with committed drillship utilization consistently exceeding 90%, with some industry experts suggesting utilization as high as 97%. As further evidenced that the market has reached an inflection point according to rig broker Clarksons, for the first time in 8 years, new contracts are on average being awarded at higher day rates than the contract they are replacing.
Below is the backlog history since 2015. The backlog has dropped continuously despite two acquisitions (Songa Offshore and Ocean Rig) and has reached a low of $6.1 billion.
RIG Quarterly Backlog history (Fun Trading) RIG Total Backlog versus Shell Backlog (Fun Trading)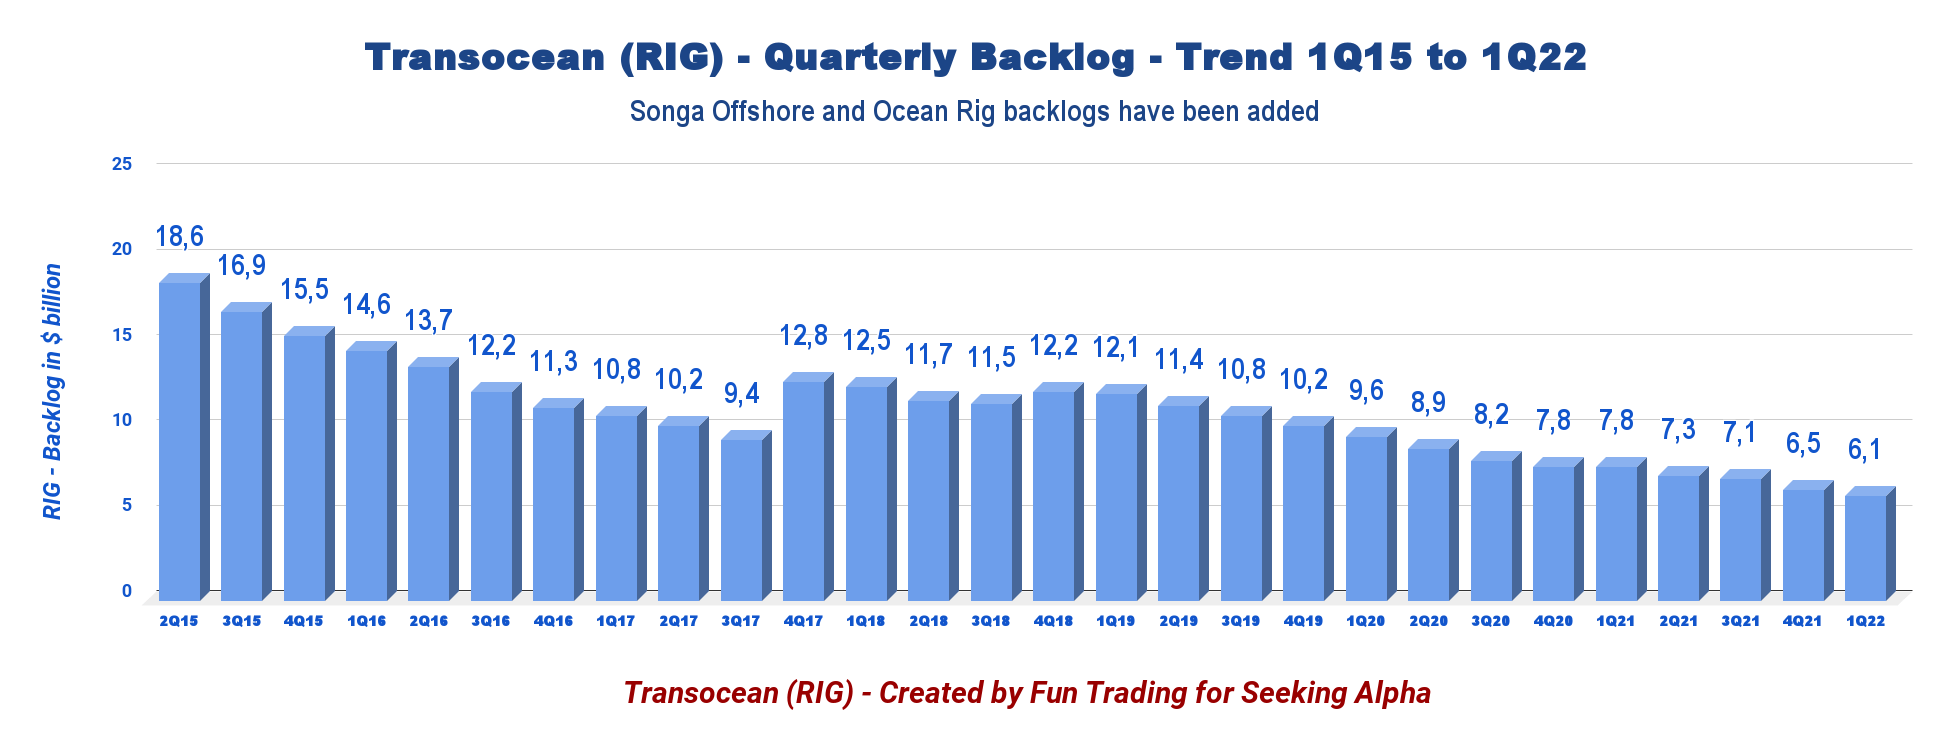
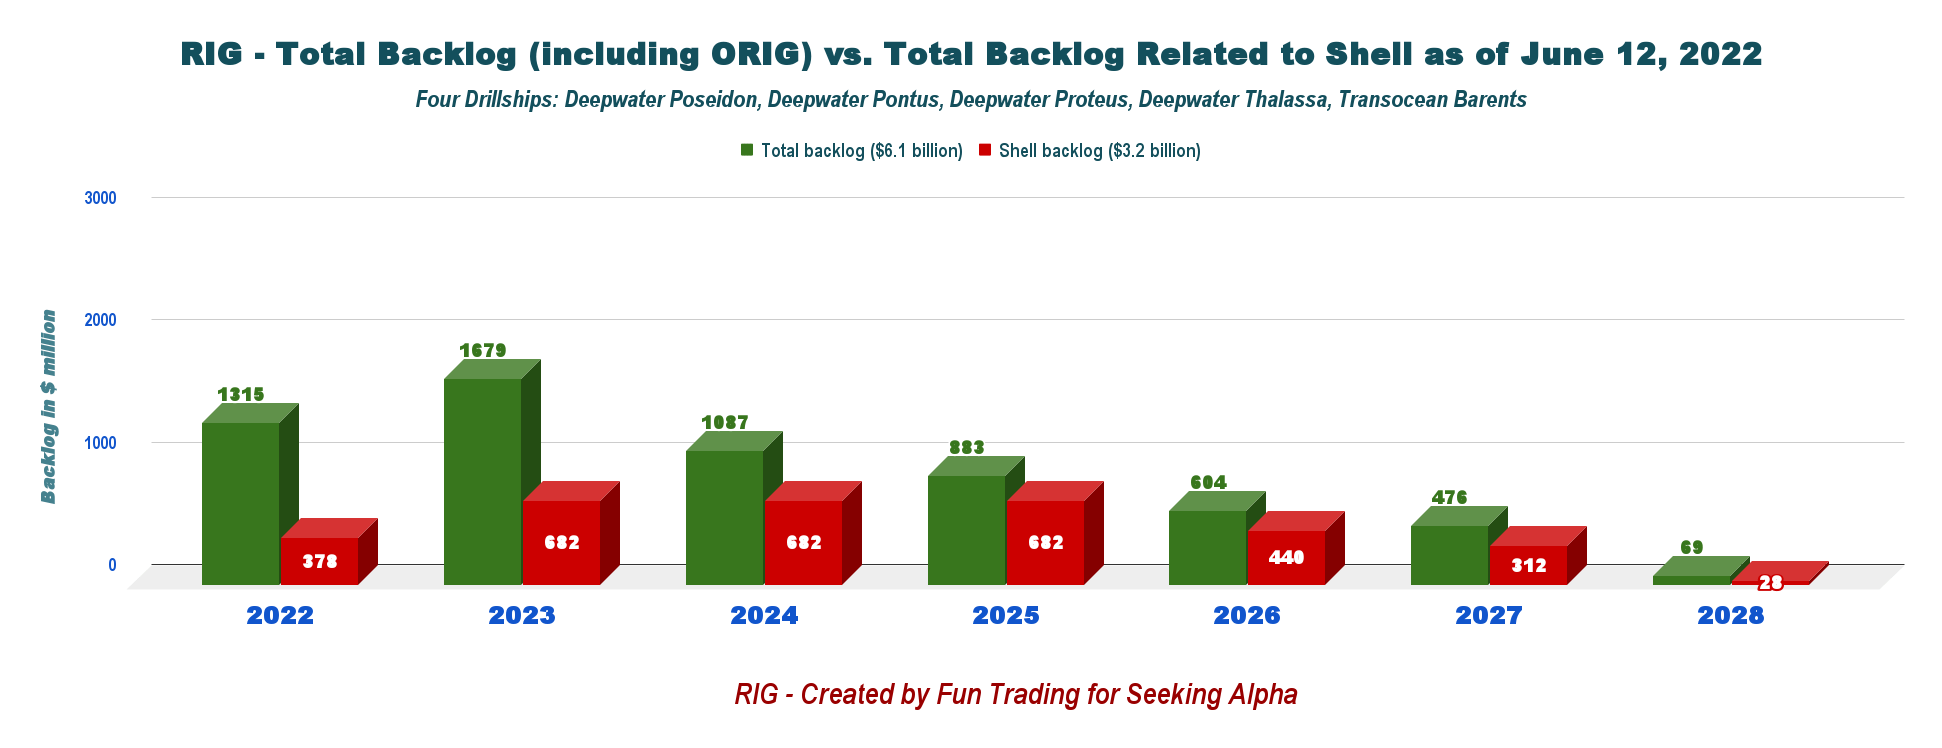
Transocean’s Ultra-deepwater floaters represented 66.5% of the total contract drilling revenues, while Harsh Environment floaters accounted for the remaining 33.5%. Also, the ultra-Deepwater backlog represents approximately 82.5% of the total backlog.
RIG: Backlog repartition between HE semisubs and UDW drillships (Fun Trading)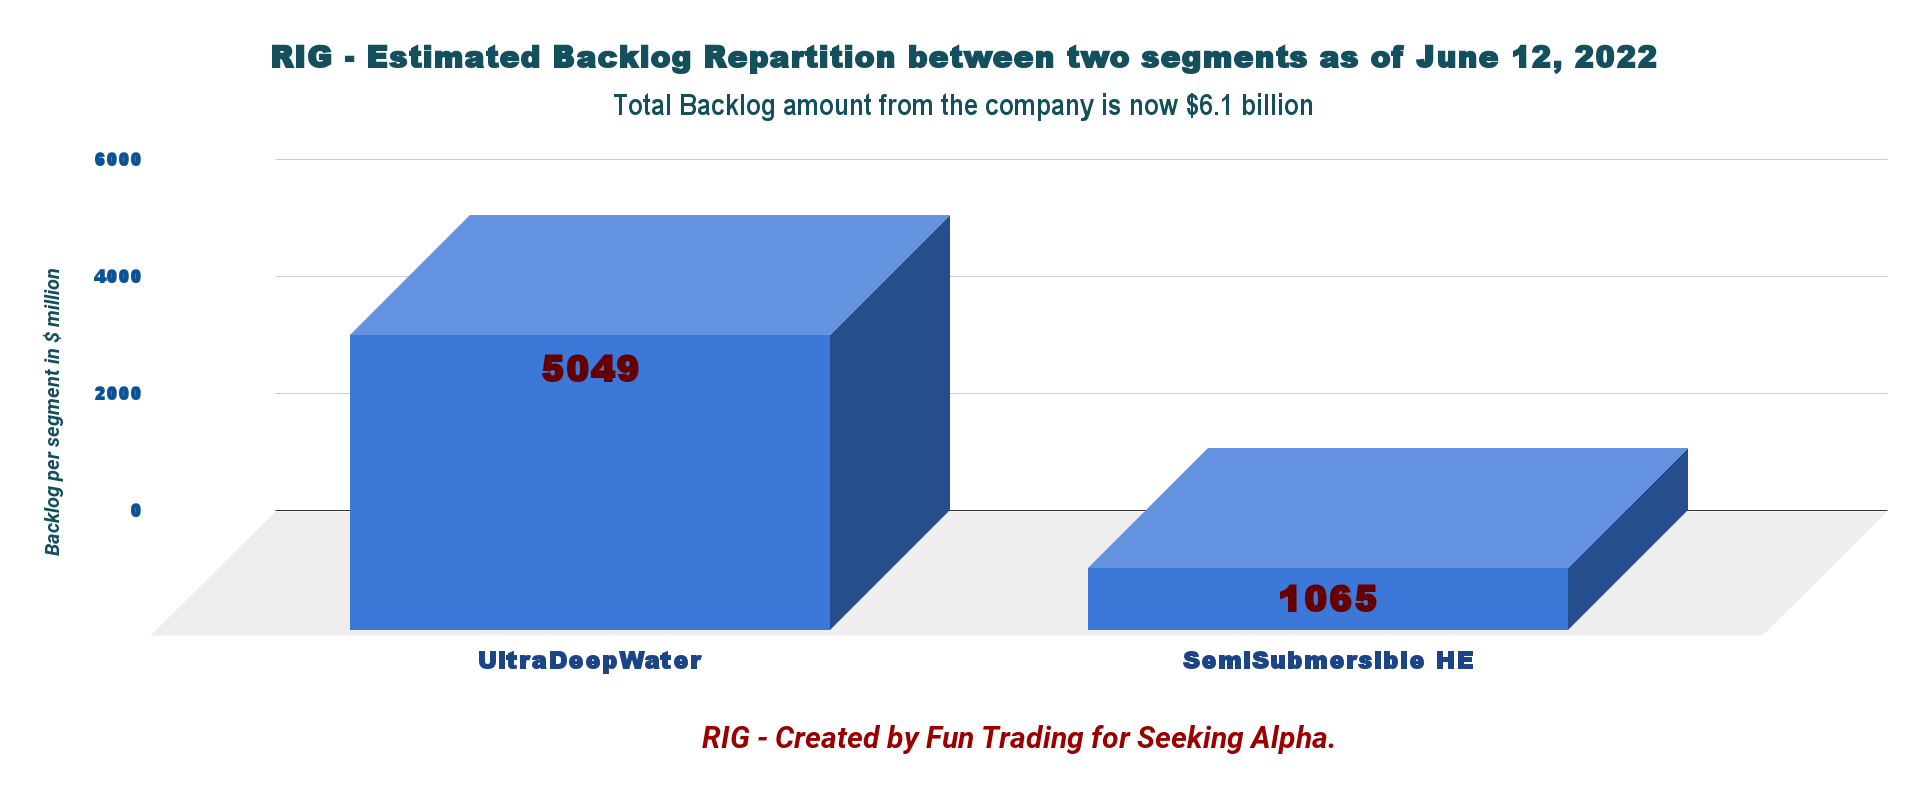
During 1Q22, revenues from the Ultra-deepwater and HE floaters are $390 million and $196 million, from $436 million and $217 million in 1Q21.
2 – Investment thesis
Despite a rally in oil prices that seem to be triggering some positive responses in the offshore drilling sector, I am not convinced that RIG is suited for a long-term investment.
First, Transocean’s balance sheet looks weak, delivering recurring losses quarter after quarter with shrinking revenue.
Second, the company’s debt load is highly toxic and prevents it from competing fairly against a few companies that have restructured last year and are more solid financially now.
I believe Transocean made a strategic mistake not to restructure its debt and will always struggle with that decision. However, it has helped the long-term shareholders avoid a total loss which is the most important for us all.
In short, RIG is not suited for a savvy investor’s portfolio but fits a special kind of trader looking for high risk/reward potential.
Thus, it is essential to trade short-term LIFO about 70%-80% of your RIG holding and keep a small long-term core position for a higher target. This dual strategy entitles you to take full advantage of the offshore drilling sector’s high volatility and inherent cyclicity. It is what I recommend in my marketplace, “The Gold and Oil Corner.”
3 – Stock Performance
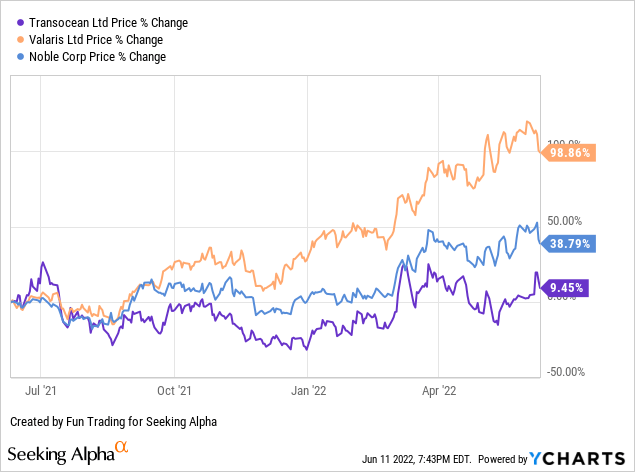
Then, this one-year chart comparison above is not really telling the whole story.
While Transocean has significantly underperformed Valaris Ltd. and Noble in the last six months, old VAL and NE shareholders were wiped out last year, and Transocean avoided filing for bankruptcy.
RIG is now up 9% on a one-year basis.
4 – Average day rates and utilization for 1Q22
The first quarter average day rate dropped to $334.5k/d from the year-ago level of $373.7k/d. Utilization declined slightly from the same quarter a year ago to reach 52.7%.
| Day rates | 1Q21 | 2Q21 | 3Q21 | 4Q21 | 1Q22 |
| The average daily rate is $k/d | 373.7 | 369.4 | 367.1 | 352.5 | 334.5 |
| Average Utilization | 52.6% | 55% | 53% | 53.4% | 52.7% |
Transocean – 1Q22 and Selected Financials History – The Raw Numbers
| Transocean | 1Q21 | 2Q21 | 3Q21 | 4Q21 | 1Q22 |
| Total contract drilling in $ Billion | 0.653 | 0.656 | 0.626 | 0.621 | 0.586 |
| Net Income in $ Million | -99 | -103 | -130 | -260 | -175 |
| EBITDA $ Million | 239 | 255 | 249 | 192 | 165 |
| EPS diluted in $/share | -0.16 | -0.17 | -0.20 | -0.40 | -0.26 |
| Cash from operating activities in $ Million | 96 | 153 | 141 | 185 | -1 |
| Capital Expenditure in $ Million | 59 | 41 | 37 | 71 | 106 |
| Free Cash Flow in $ Million | 37 | 112 | 104 | 114 | -107 |
| Cash and short-term investments $ Billion | 1.066 | 0.988 | 0.900 | 0.976 | 0.911 |
| Long-term debt in $ Billion | 7.620 | 7.527 | 7.348 | 7.170 | 7.011 |
| Shares outstanding (diluted) in Million | 617 | 621 | 653 | 658 | 664 |
| Backlog | 1Q21 | 2Q21 | 3Q21 | 4Q21 | 1Q22 |
| RIG Backlog in $ billion | 7.3 | 7.3 | 7.1 | 6.5 | 6.1 |
Source: RIG 10-Q filing
Analysis: Revenues, Earnings Details, Free Cash Flow, and Net Debt
1 – The company posted quarterly revenues of $586 million in 1Q22
Note: The total adjusted contract drilling revenues were $615 million, from $671 million the preceding quarter.
RIG: Quarterly Revenues history (Fun Trading) Transocean’s total revenues in 1Q22 decreased to $586 million from $653 million in 2021, a drop of 10.3%. Total adjusted contract drilling revenues were $615 million in 1Q22. Revenue efficiency was 94.9%, compared to 94.5% in the prior quarter.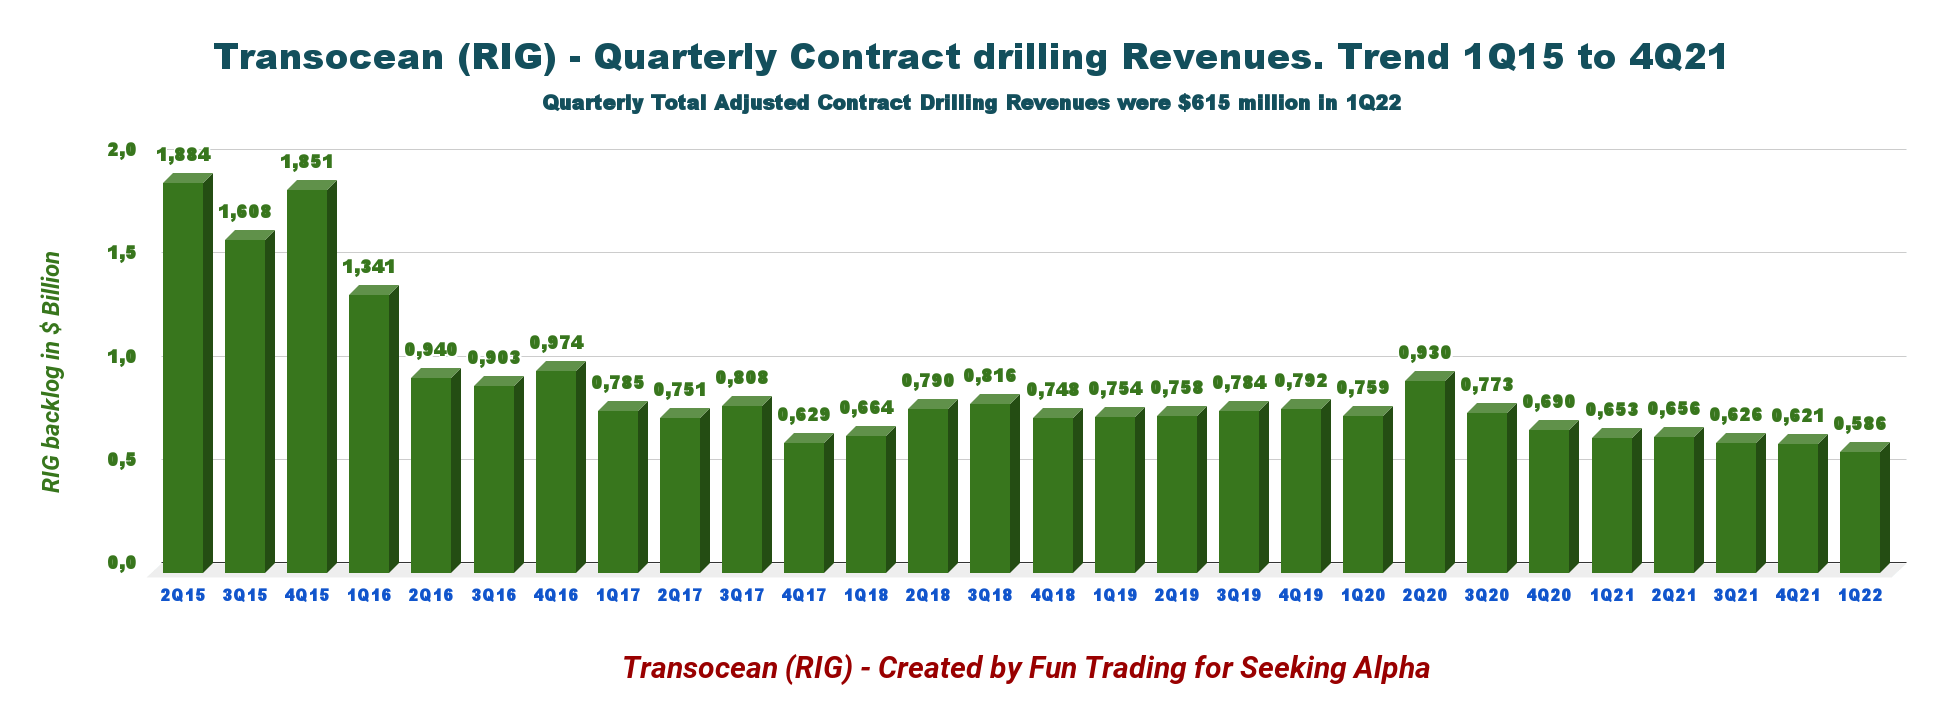
The net loss in the first quarter of 2022 was $175 million or $0.26 per diluted share. The adjusted EBITDA was $163 million, compared to $250 million in the prior quarter. The earnings did not meet analysts’ expectations.
The adjusted net loss in the first quarter of 2022 was $183 million, or $0.28 per diluted share.
2 – Free cash flow was a loss of $107 million in 1Q22
RIG Quarterly Free cash flow history (Fun Trading)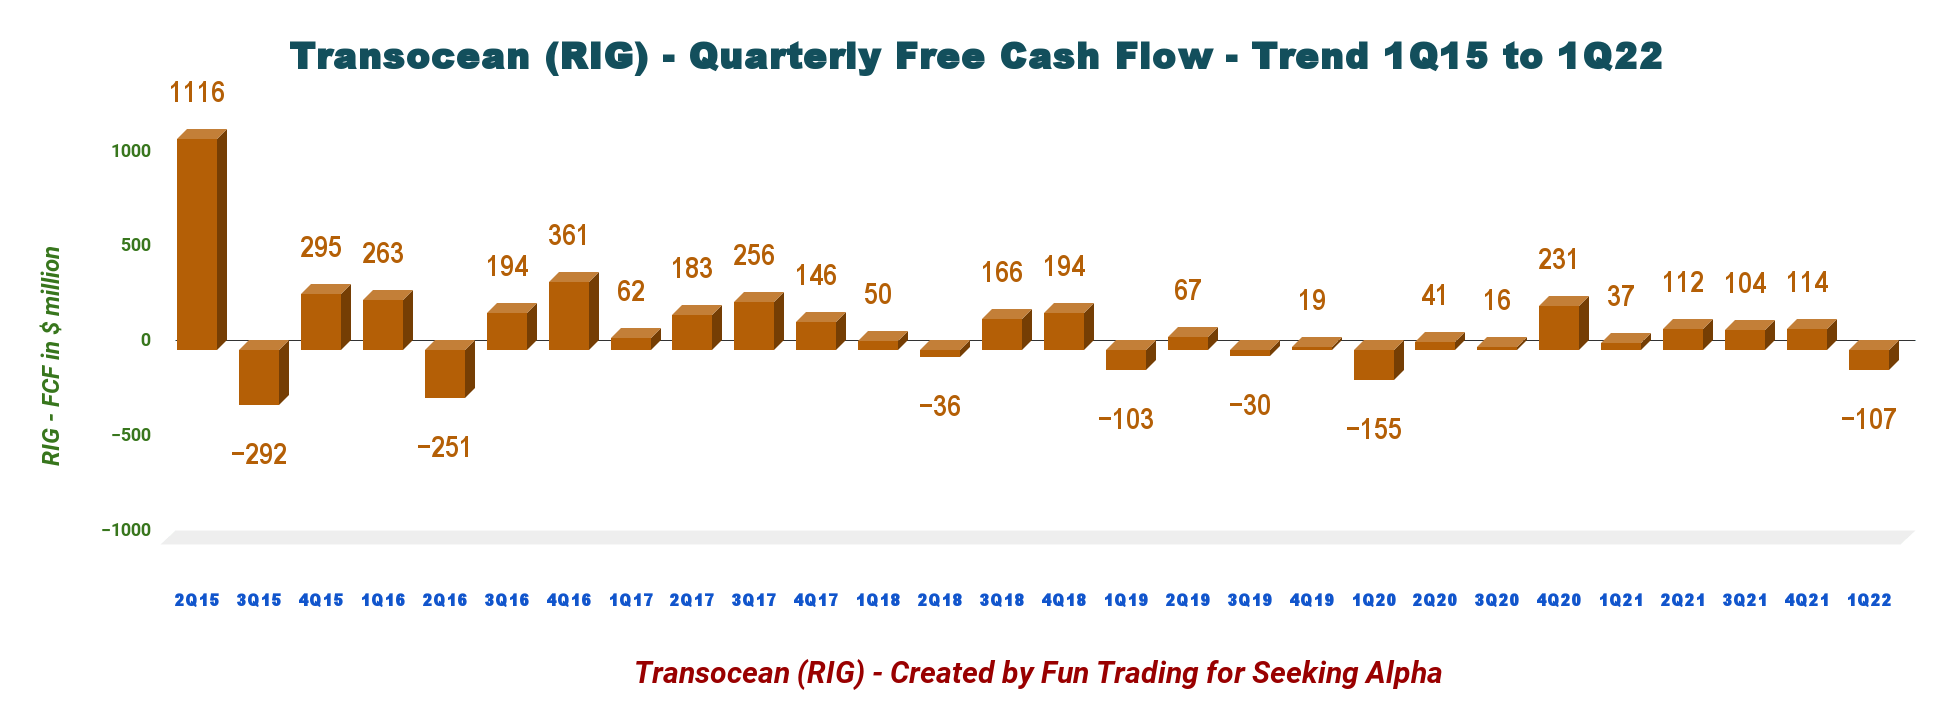
RIG had a free cash flow loss of $107 million in 1Q22. Trailing 12-month free cash flow was $223 million.
3 – Net debt (gross debt minus total cash) is $6.1 billion in 1Q22
RIG Quarterly Cash versus Debt history (Fun Trading )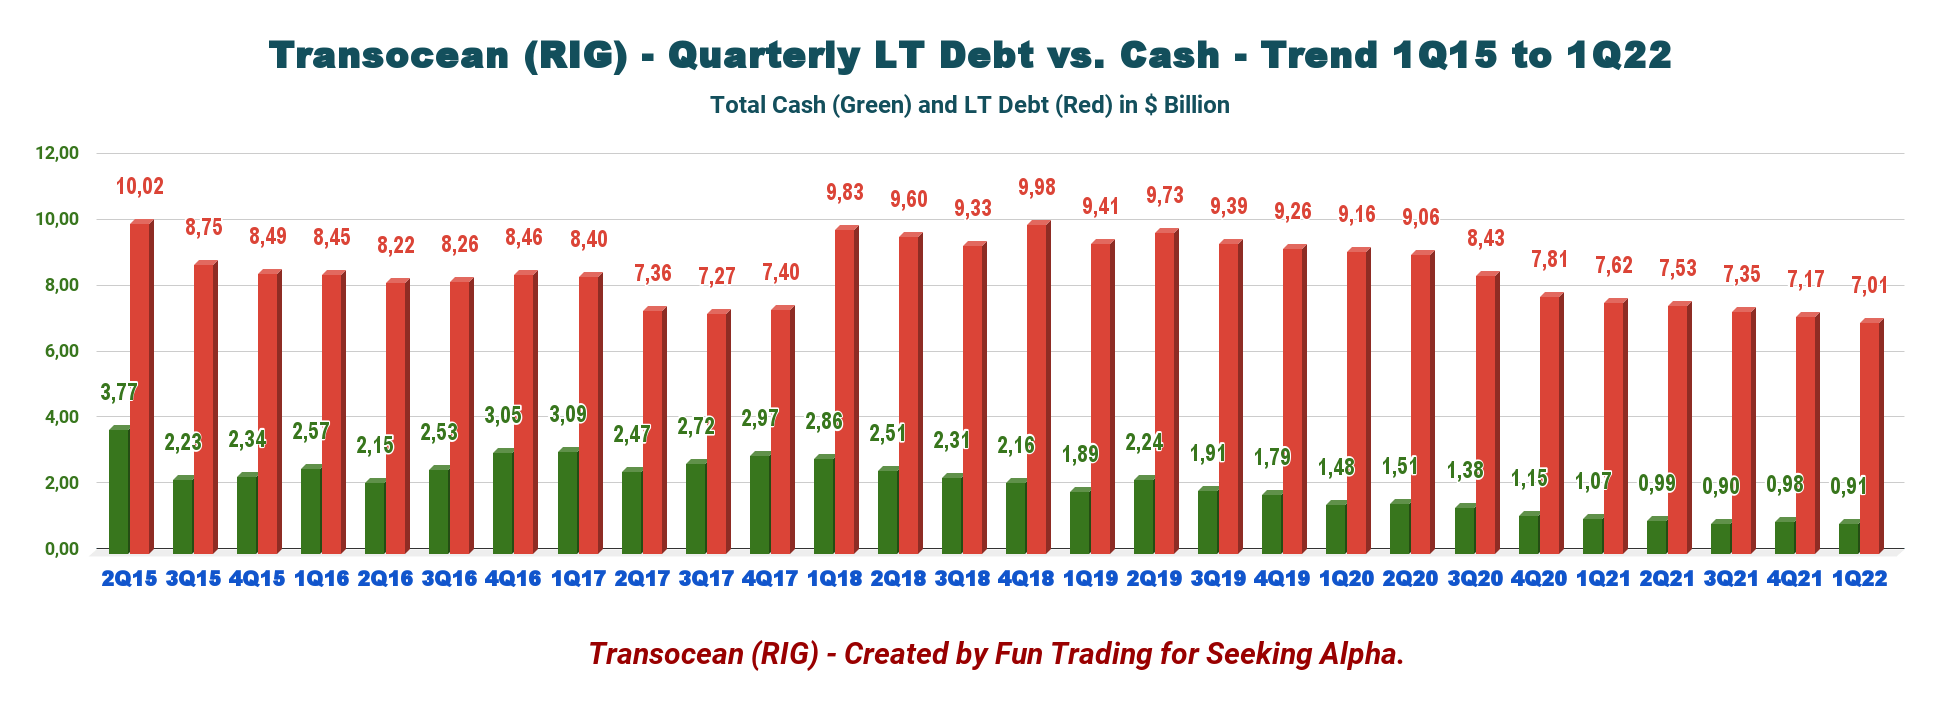
However, the total cash was $0.911 billion (please see the chart above).
The debt-to-capitalization for 1Q22 was 36.4%.
Transocean’s debt structure is the leading cause for concern, as the company has $7.01 billion in debt (including current) and cannot be profitable on a net income basis. RIG has lost about $153 million on average for the past five quarters.
4 – 2Q22 Guidance
For the second quarter of 2022, Transocean anticipates adjusted contract drilling revenues of $705 million, with operations and maintenance expenses projected at approximately $460 million.
For full-year 2022, Transocean maintains adjusted revenues of approximately $2.7 billion, with operations and maintenance expenses of $1.7 billion.
General and administrative expenses for the second quarter are expected at $50 million and between $180 million and $185 million for the full year.
Net interest expenses for the second quarter are estimated to be approximately $98 million and about $395 million for 2022, while CapEx, including the capitalized interest for the second quarter, is estimated at $121 million.
This liquidity projection includes the estimated 2022 CapEx of $1.3 billion, including $1.2 billion related to newbuilds and $80 million for maintenance CapEx.
Finally, taxes are anticipated at roughly $10 million for 2Q22 and approximately $28 million for the year.
Technical Analysis and Commentary
RIG: TA Chart short-term (Fun Trading) RIG forms an ascending channel pattern with resistance at $4.90 and support at $4.20. We could also see an ascending triangle pattern with resistance at $4.90, which is more telling in strategy. The $4.90 level is strong and will be challenging to cross. If the stock breaks out with high volume, it will be a definite bullish signal. However, this scenario is still unlikely, in my opinion.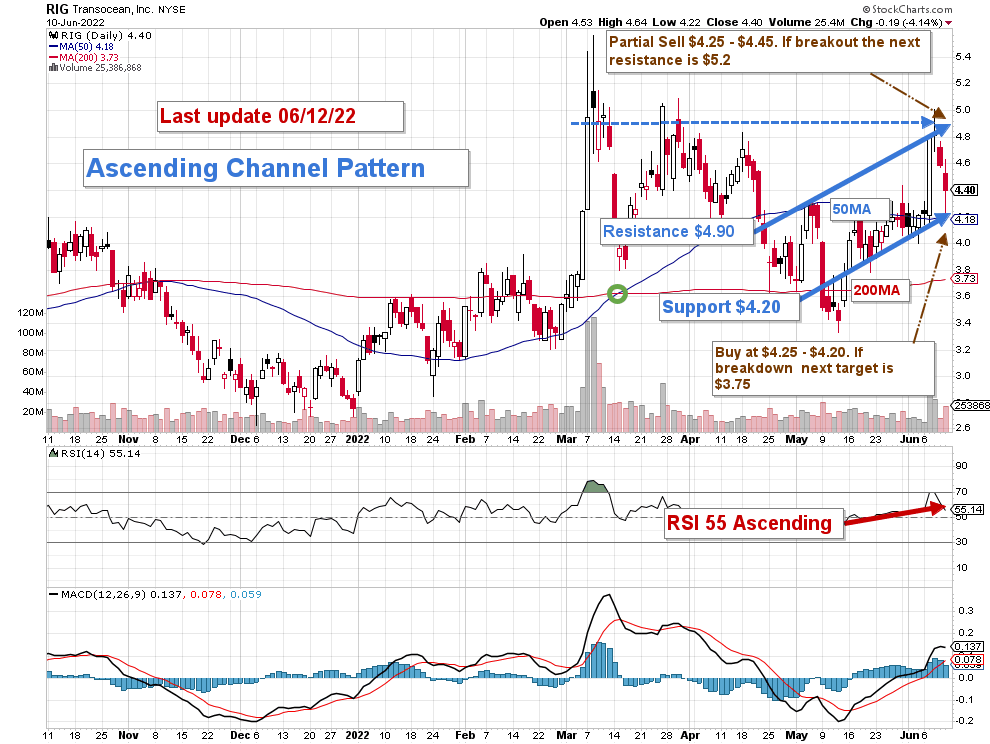
Hence, the most adapted trading strategy is to accumulate slowly below $4.25 with a low around $3.75, take profits above $4.90, and use LIFO trading with Technical analysis.
As I said in my article about TotalEnergies recently:
However, oil prices have reached an unsustainable level, creating elevated inflation that could derail the world economy and trigger a recession. The recent CPI numbers are pretty obvious.
The direct effect of this simple equation is that we are now heading for a recession which will affect the oil and gas demand. Either way, oil will have to come down from this overheated situation, and oil stocks will drop in correlation.
RIG will be moving with the general oil sector and may enter a period of consolidation if oil prices cannot hold their overheated levels. Thus, it is perhaps necessary to take a sizable chunk off around $4.90 to $5.00. Better safe…
Note: The LIFO method is prohibited under International Financial Reporting Standards (IFRS), though it is permitted in the United States by Generally Accepted Accounting Principles (GAAP). Therefore, only US traders can apply this method. Those who cannot trade LIFO can use an alternative by setting two different accounts for the same stock, one for the long term and one for short-term trading.
Warning: The TA chart must be updated frequently to be relevant. It is what I am doing in my stock tracker. The chart above has a possible validity of about a week. Remember, the TA chart is a tool only to help you adopt the right strategy. It is not a way to foresee the future. No one and nothing can.
Author’s note: If you find value in this article and would like to encourage such continued efforts, please click the “Like” button below to vote for support. Thanks.
Be the first to comment