

William_Potter/iStock via Getty Images
This article is part of a series that provides an ongoing analysis of the changes made to Harris Associates’ 13F stock portfolio on a quarterly basis. It is based on Harris Associates’ regulatory 13F Form filed on 2/14/2022. William Nygren’s 13F portfolio value increased from $62.77B to $64.23B this quarter. The portfolio is diversified with recent 13F reports showing around 200 positions. There are 58 securities that are significantly large (more than ~0.5% of the portfolio each) and they are the focus of this article. The largest five stakes are Alphabet, Fiserv, Bank of America, Charter Communications, and Huma. They add up to ~23% of the portfolio. Please visit our Tracking William Nygren’s Harris Associates Portfolio series to get an idea of their investment philosophy and our last update for the fund’s moves during Q3 2021.
Harris Associates currently has ~$125B under management. Their flagship mutual funds are the Oakmark Fund (MUTF:OAKMX) incepted in 1991 and the Oakmark International (MUTF:OAKIX) incepted in 1992. Both funds have produced substantial alpha during their lifetimes: 13.15% annualized return compared to 10.84% for the S&P 500 index for OAKMX and 9.23% annualized return for OAKIX compared to 6.34% annualized for the MSCI World ex-US Index. The other mutual funds in the group are Oakmark Select (MUTF:OAKLX), Oakmark Equity and Income (MUTF:OAKBX), Oakmark Global (MUTF:OAKGX), Oakmark Global Select (MUTF:OAKWX), and Oakmark International Small Cap (MUTF:OAKEX).
Note: The top holdings in the Oakmark International Fund are not in the 13F report as they are not 13F securities. The positions are Bayer (OTCPK:BAYRY), Lloyds Banking Group (LYG), BNP Paribas (OTCQX:BNPQF), Allianz (OTCPK:ALIZF), Intesa Sanpaolo (OTCPK:ISNPY), Credit Suisse Group (CS), BMW (OTCPK:BMWYY), Glencore (OTCPK:GLCNF), and Continental (OTCPK:CTTAF).
Stake Disposals:
Alibaba Group Holding (BABA) and Cenovus Energy (CVE): These small (less than ~1.2% of the portfolio each) positions were disposed this quarter.
Stake Increases:
Fiserv Inc. (FISV): FISV is a large (top three) 3.78% of the portfolio position primarily built over the last four quarters at prices between ~$96 and ~$111. The stock currently trades near the low end of that range at $98.78.
Charter Communications (CHTR): CHTR is a large (top five) 3.21% of the portfolio stake. It was established in 2015 when around 2M shares were purchased at prices between ~$150 and ~$190. 2017 saw a stake doubling at prices between ~$298 and ~$395. 2018 also saw a ~55% stake increase at prices between ~$260 and ~$390. The two years through Q4 2020 had seen a ~58% selling at prices between ~$275 and ~$680. There was a ~20% stake increase in H1 2021 at prices between ~$597 and ~$722. The stock currently trades at ~$560. Last two quarters have seen only minor adjustments.
Humana Inc. (HUM): The 3.21% of the portfolio HUM stake was built in Q1 2021 at prices between ~$375 and ~$448 and the stock currently trades at ~$431. Last two quarters had seen a ~44% stake increase at prices between ~$389 and ~$471. There was a marginal further increase this quarter.
Keurig Dr Pepper (KDP): KDP is a 2.81% of the portfolio position established in Q3 2020 at prices between ~$27 and ~$31 and doubled next quarter at around the same price range. Q1 2021 saw a ~25% further increase at prices between ~$30.50 and ~$35.50. The stock currently trades at $36.87. There were minor increases in the last three quarters.
Booking Holdings (BKNG): BKNG is now a medium-sized 2.50% of the portfolio position. It was a minutely small stake first purchased in 2016 and was increased substantially next year at prices between $1465 and $2035. H1 2019 saw the stake almost doubled at prices between $1665 and $1880. H2 2019 had seen minor trimming. There was a ~25% stake increase in Q1 2020 at prices between ~$1152 and ~$2087. The stock is currently at ~$2160. The four quarters through Q2 2021 had seen a ~20% trimming while the last two quarters saw marginal increases.
Ally Financial (ALLY): ALLY is a 1.84% of the portfolio position first purchased in 2015 at prices between $18.50 and $24. Next year saw the position more than doubled at prices between $15.50 and $20.50. The ten quarters through Q2 2021 had seen a ~40% selling at prices between ~$12 and ~$55. The stock is now at $44.18. Last two quarters have seen marginal increases.
Note: They have a ~7.2% ownership stake in Ally Financial.
American Express (AXP), BorgWarner (BWA), ConocoPhillips (COP), General Dynamics (GD), Grupo Televisa (TV), Howmet Aerospace (HWM), Interpublic Group (IPG), Intercontinental Exchange (ICE), LivaNova plc (LIVN), Liberty Broadband (LBRDK), Mastercard Inc. (MA), Open Text Corp. (OTEX), Reinsurance Group of America (RGA), Restaurant Brands (QSR), Ryanair Holdings (RYAAY), Visa Inc. (V), Wells Fargo (WFC), and Willis Towers Watson (WTW): These small (less than 1.5% of the portfolio each) stakes were increased this quarter.
Note: Although the position size relative to the 13F portfolio is very small, they have significant ownership stakes in Grupo Televisa and Reinsurance Group of America.
Stake Decreases:
Alphabet Inc. (GOOG) (GOOGL): GOOG is currently the largest 13F position by far at 8.65% of the portfolio. The bulk of the stake was purchased in 2014 at prices between ~$515 and ~$595. Next year also saw a ~20% stake increase at prices between ~$495 and ~$750. The two years through Q4 2020 had seen a ~28% selling at prices between ~$1054 and ~$1828. The stock currently trades at ~$2770. Last four quarters have seen only minor adjustments.
Bank of America (BAC): BAC was a minutely small position in their first 13F filing in 1999. It became a significant part of the portfolio in 2011. The 2012 to 2015 timeframe saw the stake built from 9.8M shares to 138M shares at prices between ~$6 and ~$18. The next 3 years saw a ~40% reduction at prices between ~$12 and ~$33. Last three years saw another ~40% selling at prices between ~$20 and ~$48. The stock is now at ~$43, and it is a top-three stake at 3.68% of the portfolio.
HCA Healthcare (HCA): HCA is now a 3.14% of the portfolio stake. A large position was built over the 2016-2017 timeframe at prices between $64 and $89. Q4 2018 saw that original stake reduced by ~50% at prices between ~$120 and ~$144. Next quarter also saw a ~15% stake reduction. There was a one-third increase in Q2 2020 at prices between $82 and $118. That was followed with a ~15% stake increase next quarter at prices between ~$94 and ~$138. Last four quarters had seen a ~14% selling at prices between ~$124 and ~$262. The stock currently trades at ~$261. There was marginal trimming this quarter.
General Motors (GM): GM is a 3.05% of the portfolio position. It is a very long-term stake. The original position was minutely small in 2007 and it was disposed the following year. In 2013, a huge ~70M share stake was established at prices between $27 and $41. The position size peaked at ~81M shares in 2015. The stake was sold down by ~25% in the 2016-2019 timeframe at prices between $28 and $46. That was followed with a ~45% reduction in the five quarters through Q2 2021 at prices between ~$18 and ~$64. The stock currently trades at $43.78. Last two quarters have seen minor trimming.
CNH Industrial (CNHI): CNHI is a ~3% of the portfolio position purchased in Q4 2020 at prices between $7.75 and $13 and the stock currently trades well above that range at $16.46. Last four quarters saw a ~50% selling at prices between ~$11 and ~$17.
Note: They control ~7.2% of the business.
American International Group (AIG): AIG is a 2.68% of the portfolio position first purchased in 2012 at prices between ~$23 and ~$36. The stake was almost doubled over the next two years at prices between $35 and $56.50. 2016 saw a one-third selling at prices between $50 and $66. 2017-2018 timeframe saw a similar increase at prices between $37.50 and $67. The three quarters through Q3 2019 had seen a ~20% reduction at prices between $40 and $57.50 while the next three quarters saw minor increases. The stock is now at $61.85. Last six quarters have seen only minor adjustments.
Citigroup Inc. (C): The 2.64% Citigroup position was built in 2014 at prices between ~$46 and ~$56. The stake was almost doubled over the next three years at prices between ~$37.50 and ~$76. Since 2018, there had been a combined ~30% selling at prices between ~$35 and ~$82. The stock currently trades at $56.35. Last five quarters have seen only minor adjustments.
TE Connectivity (TEL): TEL is a very long-term stake first purchased in 2011 in the high-20s price range. Recent quarters have seen minor selling. There was a 16% reduction in Q2 2020 at prices between ~$59 and ~$92. That was followed with a ~45% reduction over the last six quarters at prices between ~$79 and ~$166. The stock currently trades at ~$129 and the stake is at 2.21% of the portfolio.
Hilton Worldwide (HLT): The 2.08% of the portfolio HLT stake was built during the four quarters thru Q1 2019 at prices between $66.50 and $85.75. There was a ~18% selling in Q1 2021 at prices between ~$99 and ~$127. The stock currently trades at ~$148. This quarter also saw a ~9% trimming.
Meta Platforms (FB) previously Facebook: FB is a ~2% of the portfolio position. The stake saw a ~42% stake increase in Q1 2020 at prices between ~$146 and ~$223. The stock currently trades at ~$214. Last several quarters have seen only minor adjustments.
Liberty Global (LBTYK): LBTYK is a 1.88% position established in 2017 at prices between $28 and $37. Next year saw a ~15% stake increase at prices between ~$20 and ~$37. Q2 & Q3 2019 had seen a ~30% selling at prices between $24 and $27.50 while the next quarter saw a similar increase at prices between $20.50 and $25. H1 2020 had seen a ~30% selling at prices between ~$15 and ~$23. The two quarters through Q1 2021 had seen a one-third increase at prices between ~$18.50 and ~$26.60. Last three quarters have seen a ~25% selling at prices between ~$25 and ~$30. The stock is now at $25.95.
Note: Oakmark has a ~25% ownership stake in Liberty Global.
Netflix Inc. (NFLX): NFLX is a 1.70% of the portfolio stake purchased in 2017 at prices between ~$131 and ~$200. Next year also saw a ~50% stake increase at prices between ~$210 and ~$410. There was a ~55% selling in 2020 at prices between ~$299 and ~$557. Q2 2021 saw a roughly one-third increase at prices between ~$485 and ~$555. The stock is now at ~$375. Last two quarters have seen only minor adjustments.
Constellation Brands (STZ): STZ is now a 1.57% of the portfolio stake. The position saw a ~50% stake increase in Q1 2020 at prices between ~$106 and ~$208. The next three quarters had seen a ~23% selling at prices between ~$130 and ~$220. The stock currently trades at ~$225. Last four quarters have seen only minor adjustments.
Automatic Data Processing (ADP), APA Corporation (APA), Berkshire Hathaway (BRK.B), Capital One Financial (COF), CBRE Group (CBRE), Charles Schwab (SCHW), Comcast Corp. (CMCSA), CVS Health (CVS), DXC Technology (DXC), eBay Inc. (EBAY), EOG Resources (EOG), Gartner Inc. (IT), General Electric (GE), Goldman Sachs (GS), Lear Corp. (LEA), Moody’s Corp. (MCO), Oracle Corp. (ORCL), Regeneron Pharmaceuticals (REGN), State Street Corp. (STT), Tenet Healthcare (THC), and Workday Inc. (WDAY): These small (less than ~1.5% of the portfolio each) stakes were reduced during the quarter.
Note 1: Although the position size relative to the 13F portfolio is very small, they have significant ownership stakes in the following businesses: APA Corporation, Lear Corp., and Tenet Healthcare.
Note 2: Although the stakes as percentage of the 13F portfolio are very small, Oakmark has significant ownership stakes in the following businesses: CDK Global (CDK), Envista Holdings (NVST), GoHealth (GOCO), Qurate Retail (QRTEA), Vipshop Holdings (VIPS), and WPP plc (WPP).
Below is a spreadsheet that shows the changes to William Nygren’s Harris Associates 13F portfolio holdings as of Q4 2021:
William Nygren – Oakmark – Harris Associates’ Q4 2021 13F Report Q/Q Comparison (John Vincent (author))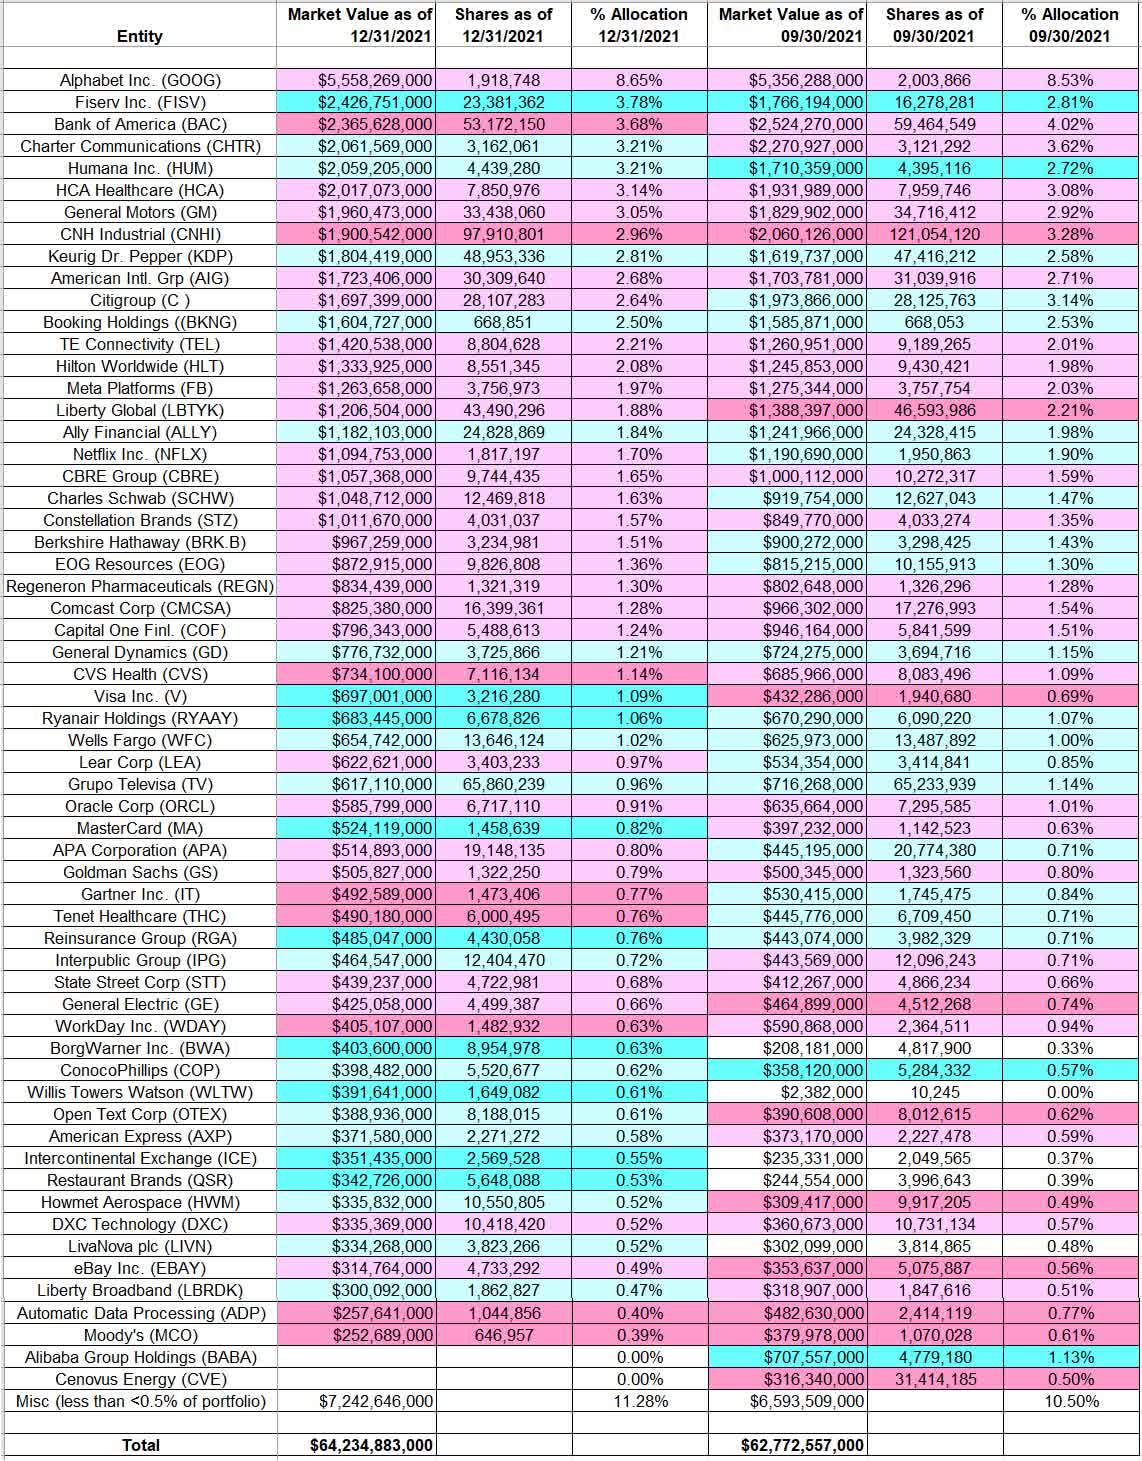
Source: John Vincent. Data constructed from Harris Associates’ 13F filings for Q3 2021 and Q4 2021.
Be the first to comment