

matdesign24
This article is part of a series that provides an ongoing analysis of the changes made to Southeastern Asset Management’s 13F portfolio on a quarterly basis. It is based on Southeastern’s regulatory 13F Form filed on 11/14/2022. Please visit our Tracking Mason Hawkins’ Southeastern Asset Management Portfolio series to get an idea of their investment philosophy and our previous update for the fund’s moves during Q2 2022.
This quarter, Southeastern’s 13F portfolio value decreased ~16% from $4.74B to $3.97B. The number of holdings increased from 36 to 38. The top three holdings are at ~23% while the top five are at ~34% of the 13F assets: Lumen Technologies, Mattel, CNX Resources, Hyatt Hotels, and General Electric.
Southeastern is best known for its investor friendly attributes. The mutual funds in the Longleaf family are Longleaf Partners Fund (MUTF:LLPFX) incepted in 1987, Longleaf Partners Small-Cap Fund (MUTF:LLSCX) incepted in 1989, Longleaf Partners International Fund (MUTF:LLINX) incepted in 1998, and the Longleaf Partners Global Fund (MUTF:LLGLX) incepted in 2012. The flagship Longleaf Partners Fund returned negative 29.34% for H1 2022 vs negative 23.87% for S&P 500 index. Annualized returns since the 1987 inception is 8.81%. Although, the fund is focused on US mid-and-large cap businesses, the current allocation has a non-US business in their top holdings: CK Hutchison (OTCPK:CKHUY). Cash allocation is less than 2%, down from an average of ~15% last year.
Note: Although their mutual funds are well known among retail investors, it should be noted that a sizable portion of Southeastern’s AUM is attributable to separately managed accounts.
New Stakes:
Westrock Coffee Company (WEST), Warner Music Group (WMG), and Masonite International (DOOR): Westrock came to market through a SPAC transaction. Southeastern invested in the PIPE at $10 per share. The stake is at ~2% of the portfolio and the stock currently trades at $14.29. WMG is a ~2% of the portfolio position established this quarter at prices between ~$23 and ~$32 and it is now at $34.15. The 0.73% DOOR stake was purchased at prices between ~$66 and ~$94 and it is now at $75.26.
Note: They have a ~11% ownership stake in Westrock Coffee Company.
Stake Disposals:
Ingles Markets (IMKTA): The minutely small 0.26% IMKTA stake was disposed during the quarter.
Stake Decreases:
Lumen Technologies (LUMN) previously CenturyLink: LUMN is currently the largest 13F position at ~11% of the 13F portfolio. It came about as a result of the acquisition of Level 3 Communications by CenturyLink that closed in October 2017. Southeastern had a huge 28M share stake in Level 3 for which they received ~40M CenturyLink shares in the ratio 1:1.4286. The terms called for $26.50 per share in cash as well. The position was increased by ~75% in Q4 2017 at prices between $13.50 and $20.50. The stock is now at $5.77. Last several quarters have seen minor trimming.
Note: Their cost-basis on the position is ~$16. Regulatory filings since the quarter ended show them owning 48.74M shares (4.7% of the business) of Lumen Technologies. This is compared to 58.6M shares in the 13F report.
Mattel, Inc. (MAT): MAT is a large (top three) 6.63% portfolio stake. It was established in Q3 2017 at prices between $14.50 and $21.50 and increased by ~250% the following quarter at prices between $13 and $19. The two quarters through Q1 2021 had seen ~43% selling at prices between ~$12 and ~$21. There was a ~18% stake increase in Q2 2021 at prices between ~$19 and ~$22. That was followed with ~10% increase in Q4 2021. Next quarter saw a ~20% selling at prices between ~$19.50 and ~$25.60. That was followed with a ~14% reduction this quarter at prices between ~$19 and ~$24. The stock currently trades at $17.14.
CNX Resources (CNX): CNX is a top-three 5.93% of the 13F portfolio stake. The original position was from 2012 when ~25M shares were purchased in the high-20s price range. Q4 2014 & Q1 2015 saw a stake doubling at prices between $24 and $39. There was a ~18% stake increase in Q2 2019 at prices between $6.15 and $10.90. Q2 2020 saw a ~25% selling at prices between $5.50 and $13. Q1 2021 saw another ~17% selling at prices between ~$11 and ~$15.75. Last two quarters saw a ~42% reduction at prices between ~$14 and ~$24. The stock is now at $16.37. This quarter also saw a minor ~4% trimming.
Note 1: Regulatory filings since the quarter ended show them owning 11.9M shares (6.6% of business) of CNX. This is compared to 15.2M shares in the 13F report.
Note 2: The prices quoted above are adjusted for the coal spin-off in November 2017.
Hyatt Hotels (H): Hyatt Hotels is a 5.43% of the portfolio stake established in Q1 2020 at prices between $36.50 and $93. Next quarter saw a ~50% stake increase at prices between $40 and $67.50. That was followed with a ~27% increase in Q3 2020 at prices between ~$48 and ~$61. The two quarters through Q1 2021 had seen ~23% selling at prices between ~$66 and ~$91. Q3 2021 saw a ~18% stake increase while in the next two quarters there was ~40% selling at prices between ~$77 and ~$107. The stock now trades at $99.62. Last quarter saw a ~19% stake increase while this quarter there was a ~8% trimming.
General Electric (GE): The 4.91% GE position was established in Q4 2017 at prices between ~$136 and $200 and increased by ~185% next quarter at prices between ~$104 and $152. Q3 2018 saw another ~26% increase at prices between ~$90 and ~$114 and that was followed with a ~40% further increase next quarter at prices between ~$54 and ~$108. The six quarters thru Q2 2020 had seen a ~47% selling at prices between ~$44 and ~$104. There was another one-third selling in Q1 2021 at prices between ~$84 and ~$112. Q4 2021 saw a ~23% stake increase at prices between ~$90 and ~$111. The stock is now at $81.47. There was a ~8% trimming in Q1 2022 while last quarter there was a ~12% increase. This quarter saw a minor ~4% trimming.
Note: the prices quoted above are adjusted for the 1-for-8 reverse stock-split last July.
Affiliated Managers Group (AMG): The 4.56% AMG stake was purchased in Q3 2018 at prices between $137 and $160 and increased by ~55% next quarter at prices between $90 and $138. 2019 had seen a ~25% selling at prices between $75 and $116. Q2 2021 saw a ~20% increase at prices between ~$149 and ~$175. That was followed with a ~15% increase in Q1 2022 at prices between ~$122 and ~$167. The stock is now at ~$157. There was minor trimming in the last two quarters.
FedEx Corporation (FDX): FDX is a very long-term position that has been in the portfolio since 2000. Currently, it is a large top three stake at 6.55% of the portfolio. Recent activity follows: the five quarters thru Q4 2017 saw a combined ~50% reduction at prices between $170 and $250. 2020 saw another ~63% selling at prices between ~$108 and ~$301. There was a one-third increase in Q3 2021 at prices between ~$219 and ~$300. That was followed with a ~25% stake increase next quarter at prices between ~$218 and ~$259. The stock currently trades at ~$178. There was a ~13% trimming this quarter.
Warner Bros. Discovery (WBD): The fairly large ~4% of the portfolio stake in WBD was established in Q3 2021 at prices between ~$24 and ~$29. Next quarter saw a ~20% stake increase at prices between $21.50 and $27. That was followed with a ~25% increase last quarter at prices between ~$13 and ~$26. The stock currently trades well below their purchase price ranges at $10.98. This quarter saw a ~8% trimming.
MGM Resorts International (MGM): The ~4% MGM position was purchased in Q3 2020 at prices between $15 and $24. Next quarter saw a ~40% stake increase at prices between ~$20 and ~$32. There was a ~20% reduction in Q1 2021 at prices between ~$28 and ~$41. The stock currently trades at $36.93. Last few quarters have seen minor trimming.
Lazard Ltd (LAZ): The LAZ position was a very small stake first purchased in Q3 2018. Next quarter saw the position built at prices between $34 and $48. 2019 saw a ~50% stake increase at prices between $31 and $40.50. The three quarters through Q1 2021 had seen a ~35% selling at prices between ~$27 and ~$47. Next two quarters had seen a ~25% stake increase at prices between ~$43 and ~$49. The stock currently trades at $38.80, and the stake is at ~4% of the portfolio. There was minor trimming in the last four quarters.
Note: They have a ~4.8% ownership stake in the business.
IAC Inc. (IAC): IAC is a 3.83% of the portfolio position purchased in Q3 2021 at prices between ~$124 and ~$154 and it is now well below that range at ~$48. There was a ~20% stake increase in Q4 2021 at around the same price range. That was followed with a ~50% stake increase over the last two quarters at prices between ~$73 and ~$138. This quarter saw a ~8% trimming.
White Mountains Insurance (WTM): The 3.69% WTM stake was built during the two quarters through Q1 2022 at prices between ~$1042 and ~$1394. The stock currently trades at ~$1350. There was a ~10% trimming this quarter.
Alphabet Inc. (GOOG), and Stanley Black & Decker (SWK): GOOG is a 3.62% of the portfolio position purchased last quarter at prices between ~$106 and ~$144 and the stock currently trades at ~$95. SWK is a small 0.88% stake purchased at prices between ~$102 and ~$145 and it is now at ~$81. Both stakes saw minor trimming this quarter.
Liberty Broadband (LBRDK): The 2.69% of the portfolio LBRDK stake was purchased in Q4 2021 at prices between ~$148 and ~$177 and it is now well below that range at ~$77. There was a ~17% stake increase in Q1 2022 at prices between ~$135 and ~$161. That was followed with a ~42% increase last quarter at prices between ~$103 and ~$141. This quarter saw a minor ~2% trimming.
Note: Their Comcast position was disposed and exchanged for Liberty Broadband based on a relative undervaluation thesis.
Graham Holdings (GHC): GHC is a 3.46% of the portfolio stake first purchased in 2013. Q2 & Q3 2014 saw a ~30% increase at prices between $286 and $360. The eleven quarters through Q1 2021 had seen a ~75% selling at prices between ~$278 and ~$620. Next three quarters had seen a ~45% stake increase at prices between ~$560 and ~$677. The stock currently trades at ~$605. Last three quarters have seen a ~15% trimming.
Note 1: They have a ~6.7% ownership stake in the business.
Note 2: The prices quoted above are adjusted for the spinoff of Cable One (CABO) from Graham Holdings that closed on July 1, 2015. Shareholders of GHC received one share of CABO for each share of GHC held. Southeastern controls ~6% of Graham Holdings.
Fiserv (FISV): FISV is a 2.68% of the portfolio position established in Q4 2021 at prices between ~$96 and ~$111. There was a ~60% stake increase next quarter at prices between ~$93 and ~$110. Last two quarters saw minor trimming. The stock is now at ~$102.
Empire State Realty (ESRT): The 2.18% ESRT stake was built in H1 2020 at prices between $6.50 and $14.30 and it currently trades at $7.12. There was a ~20% selling in Q1 2021 at prices between $8.95 and $11.85 while next quarter saw a ~6% stake increase. That was followed with a ~18% stake increase in Q3 2021 at prices between $9.65 and $12.25. Last four quarters have seen minor trimming.
Note: They have a ~8.1% ownership stake in the business.
Anywhere Real Estate (HOUS) previously Realogy Holdings: HOUS is a 2.16% stake purchased in Q4 2017 at prices between $26 and $34 and increased by ~20% next quarter. There was a ~18% increase in Q2 2018 at prices between $23 and $28 and that was followed with a ~24% increase next quarter at prices between $20 and $24. The first three quarters of 2019 had also seen a ~75% stake increase at prices between $4.50 and $18.50. Q2 & Q3 2020 had seen a ~47% reduction at prices between $2.35 and $11.50. There was a ~25% stake increase in Q3 2021 at prices between ~$16 and ~$19. The stock is currently at $7.68. Last few quarters have seen minor trimming.
Note: Southeastern controls ~8.4% of the business.
Douglas Emmett (DEI): DEI is a ~2% of the portfolio stake established in Q4 2020 at prices between ~$23.25 and ~$33.30 and the stock currently trades at $16.42. There was a one-third stake increase in Q2 2021 at prices between ~$31.40 and ~$36.75. Last two quarters saw a ~13% trimming.
Note: the Q4 2020 commentary talks about this investment – they had followed the business since 2011 and they pulled the trigger as the COVID “death of office space” narrative opened up an opportunity to acquire a position at a good price.
RenaissanceRe (RNR): The 1.14% RNR stake was established in Q3 2021 at prices between ~$138 and ~$164 and it is now at ~$181. There was a ~17% stake increase in Q4 2021 at prices between ~$139 and ~$173. Last three quarters saw a ~70% reduction at prices between ~$124 and ~$171.
Stake Increases:
PVH Corp. (PVH): The 2.68% PVH stake was established last quarter at prices between ~$57 and ~$81 and it is now at $72.28. There was a ~11% stake increase this quarter.
CNH Industrial N.V. (CNHI): The small ~1% stake in CNHI saw a ~25% increase this quarter at prices between ~$11 and ~$13. The stock currently trades at $16.22.
Kept Steady:
Madison Square Garden Sports (MSGS): MSGS is a 2.81% of the portfolio position purchased in Q2 2021 at prices between ~$170 and ~$192 and the stock currently trades below that range at ~$160. There was a ~20% stake increase in H2 2021 at prices between ~$154 and ~$201. Last two quarters had seen a ~12% trimming.
Comcast Corporation (CMCSA), Cardinal Health (CAH), H World Group (HTHT), JOYY Inc. (OTC:YYINZ) (YY), Liberty Braves (BATRK), Melco Resorts (MLCO), Oscar Health (OSCR), Paya Holdings (PAYA), Syneos Health (SYNH), Vimeo, Inc. (VMEO), and XPO Logistics (XPO): These small (less than ~2.20% of the portfolio each) stakes were kept steady this quarter.
Note: They have a ~6.5% ownership stake in Oscar Health and a ~8.4% ownership stake in Liberty Braves.
The spreadsheet below highlights changes to Southeastern’s 13F stock holdings in Q3 2022:
Mason Hawkins – Southeastern Asset Management’s Q3 2022 13F Report Q/Q Comparison (John Vincent (author))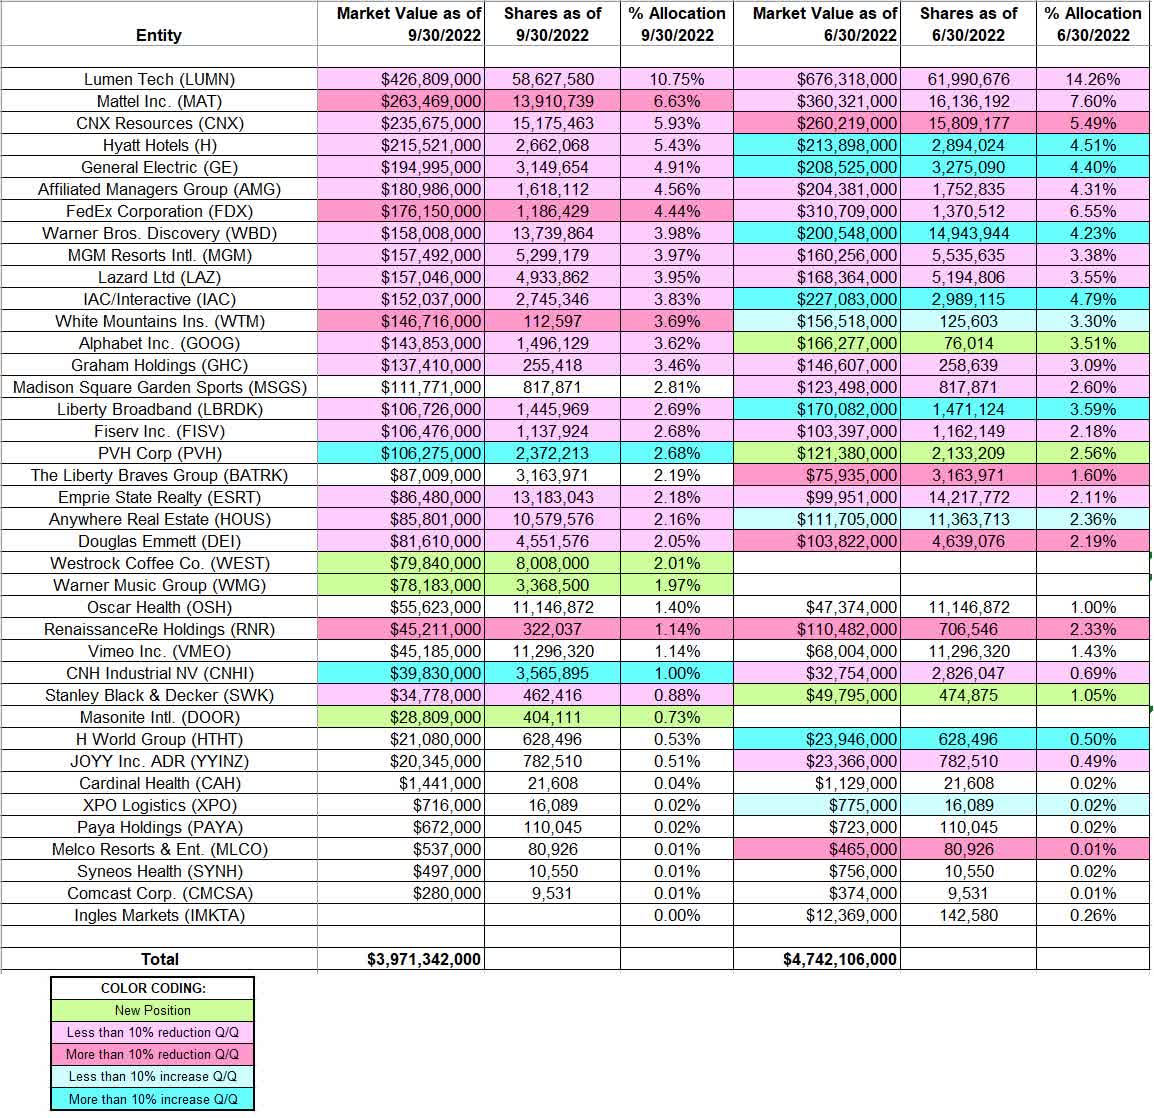
Source: John Vincent. Data constructed from Southeastern Asset Management’s 13F filings for Q2 2022 and Q3 2022.
Be the first to comment