

solarseven/iStock via Getty Images
Thesis And Background
Now is a challenging time for investors. Stock valuation is at a record high, bond yields are surging, a major geopolitical conflict is underway, and several crucial macroeconomic uncertainties are unfolding. As mentioned in our newly launched market service, we feel impelled to remind investors that at times like this, it is especially important to stay disciplined and stay with simple and proven methods that you truly understand.
In this article, we use our aggressive growth portfolio (“AGP”) to illustrate the method we use to seek aggressive growth. And we will use the ProShares UltraPro QQQ ETF (NASDAQ:TQQQ) and SPDR S&P Biotech ETF (NYSEARCA:XBI), both actual holdings in our AGP, to illustrate the inner workings of this method. The method is based on the following simple yet timeless concepts:
- Opportunistic equity-bond rebalance. We use an equity-bond index to A) monitor the adjusted yield spread between equity and bonds, and B) opportunistically allocate equity funds such as XBI. XBI’s valuation is currently at a secular bottom as you will see later in this article. As a result, its earnings yield relative to the risk-free treasury rate is at a wide level despite the surging treasury yield. As you can see from our holdings below, we are currently maintaining a target allocation of about 9.2% for XBI.
- Dynamic leverage. We use an algorithm to systematically adjust leverage based on volatility and market valuation to generate reliable long-term aggressive growth. We are currently maintaining a relatively low level of leverage now because of the elevated volatility. As you can see below, our leverage ratio (TQQQ target weight) is currently 8.3%. To put it under perspective, our ceiling for the leverage ratio is 25%.
Author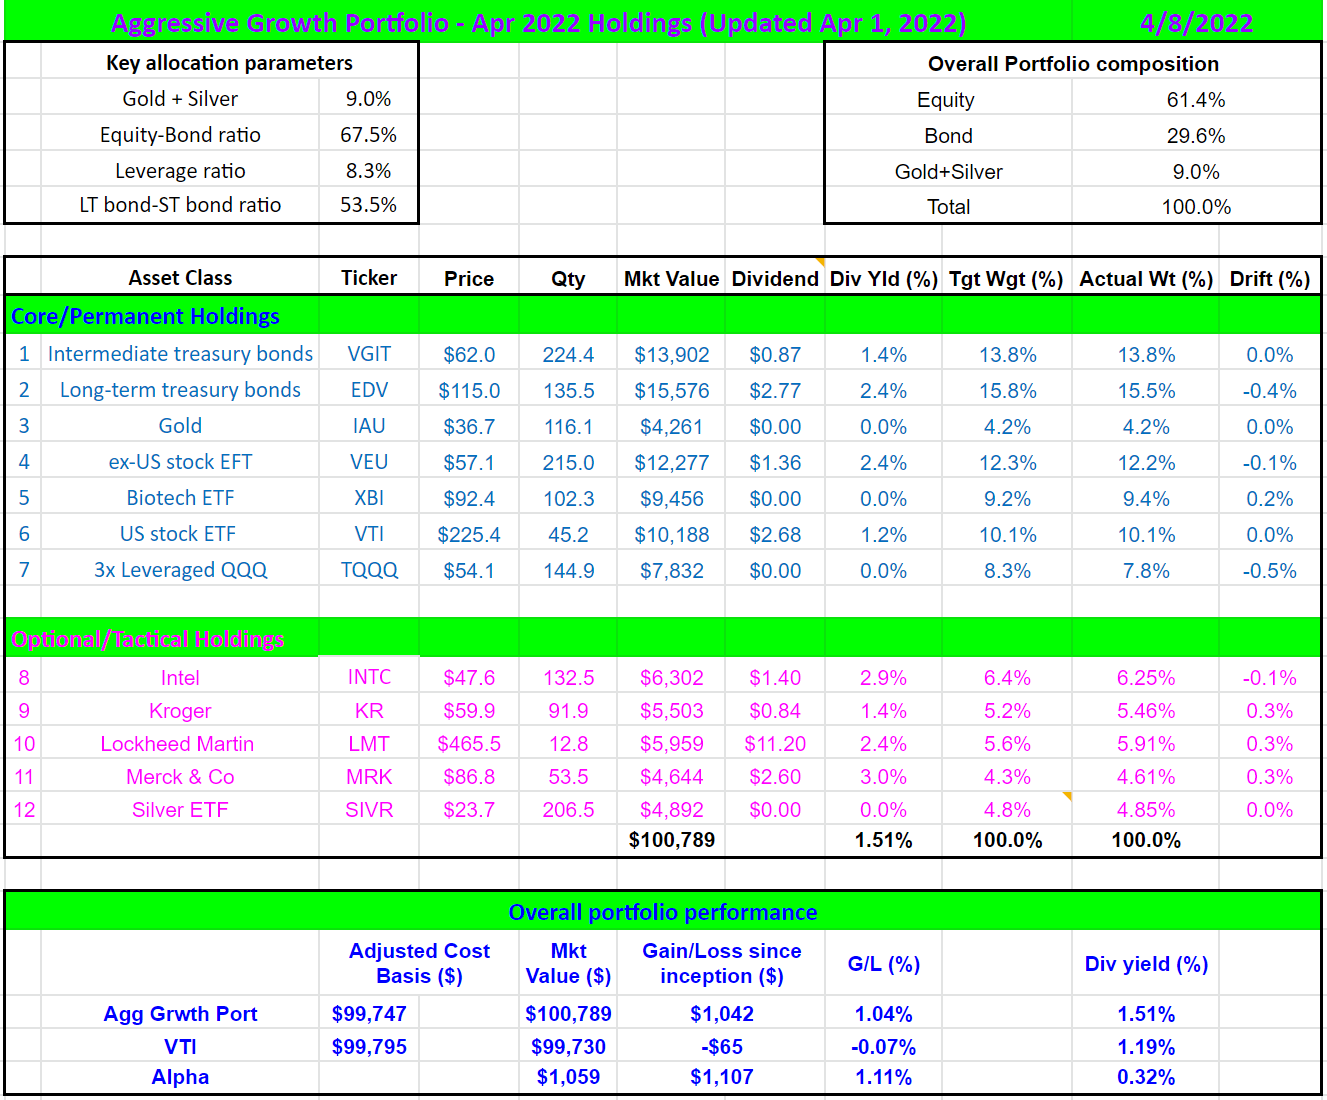
The next chart shows the performance of our AGP relative to the overall market since Feb 1, 2022, the date we officially published our AGP with our members. The long-term performance is reported later in this article. As you can see, as of Apr 1 (the day we performed our April maintenance), our AGP portfolio gained 2.06% since Feb 1, 2022. The overall market gained about 1.24%, lagging our portfolio in relative terms by about 0.83%.
Furthermore, you can see that our AGP not only outperformed the overall market, but it also has not lost money since Feb 1 on a monthly basis – despite all the turmoil that has transpired since Feb 1 (even a war)! The overall market, in contrast, suffered a loss of almost 4% in March.
Author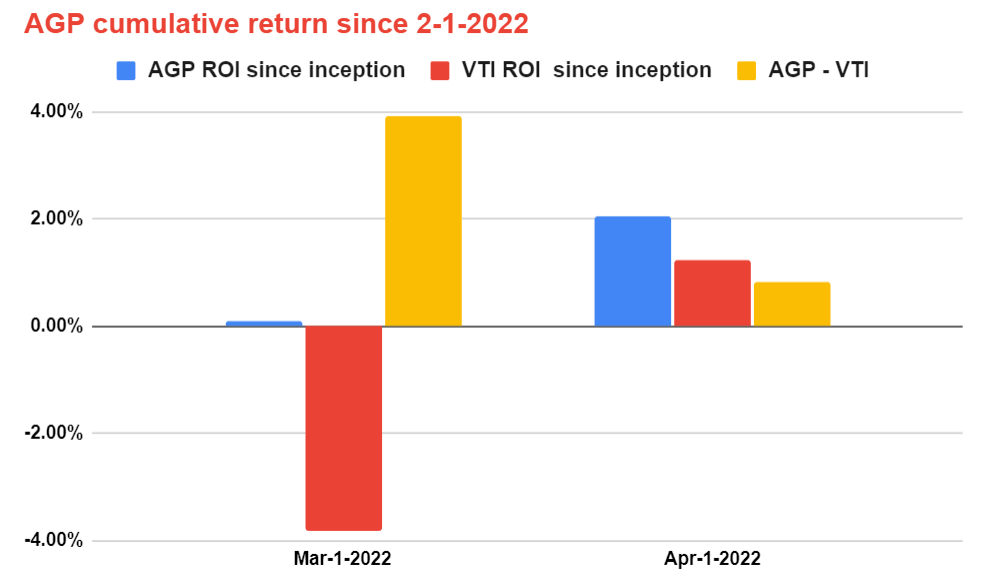
TQQQ And XBI: Basic Information
Here we first briefly recap the basic information of both funds before we move on to further details. TQQQ provides 3x leveraged exposure on a daily basis tracking 100 of the largest non-financial firms listed on NASDAQ. It is important to emphasize the 3x tracking is on a daily basis here, and the implications of this will be further elaborated on later. The fund currently has over $18 billion of assets under management, making it the largest leverage fund that I can find. It features a very tight spread for active trading.
In contrast, XBI offers exposure to the biotech sector, one of the most innovative sectors for the future. It focuses on smaller biotech companies, as can be seen below, it holds more than 150 companies with a median market cap of only about $1.4B. As a result, many of its holdings are targets for acquisitions and many have been acquired at a considerable premium. We also like its fundamental index method, which is based on an equal weight indexing approach instead based on market-cap.
A few highlights about these funds and why we use them as permanent holdings in our AGP portfolio:
- They both tap into the most innovative sectors in our economy. And as a result, you can see from the following chart that they have consistently outperformed the overall market. The recent correction of XBI provides an excellent entry opportunity as to be explained later.
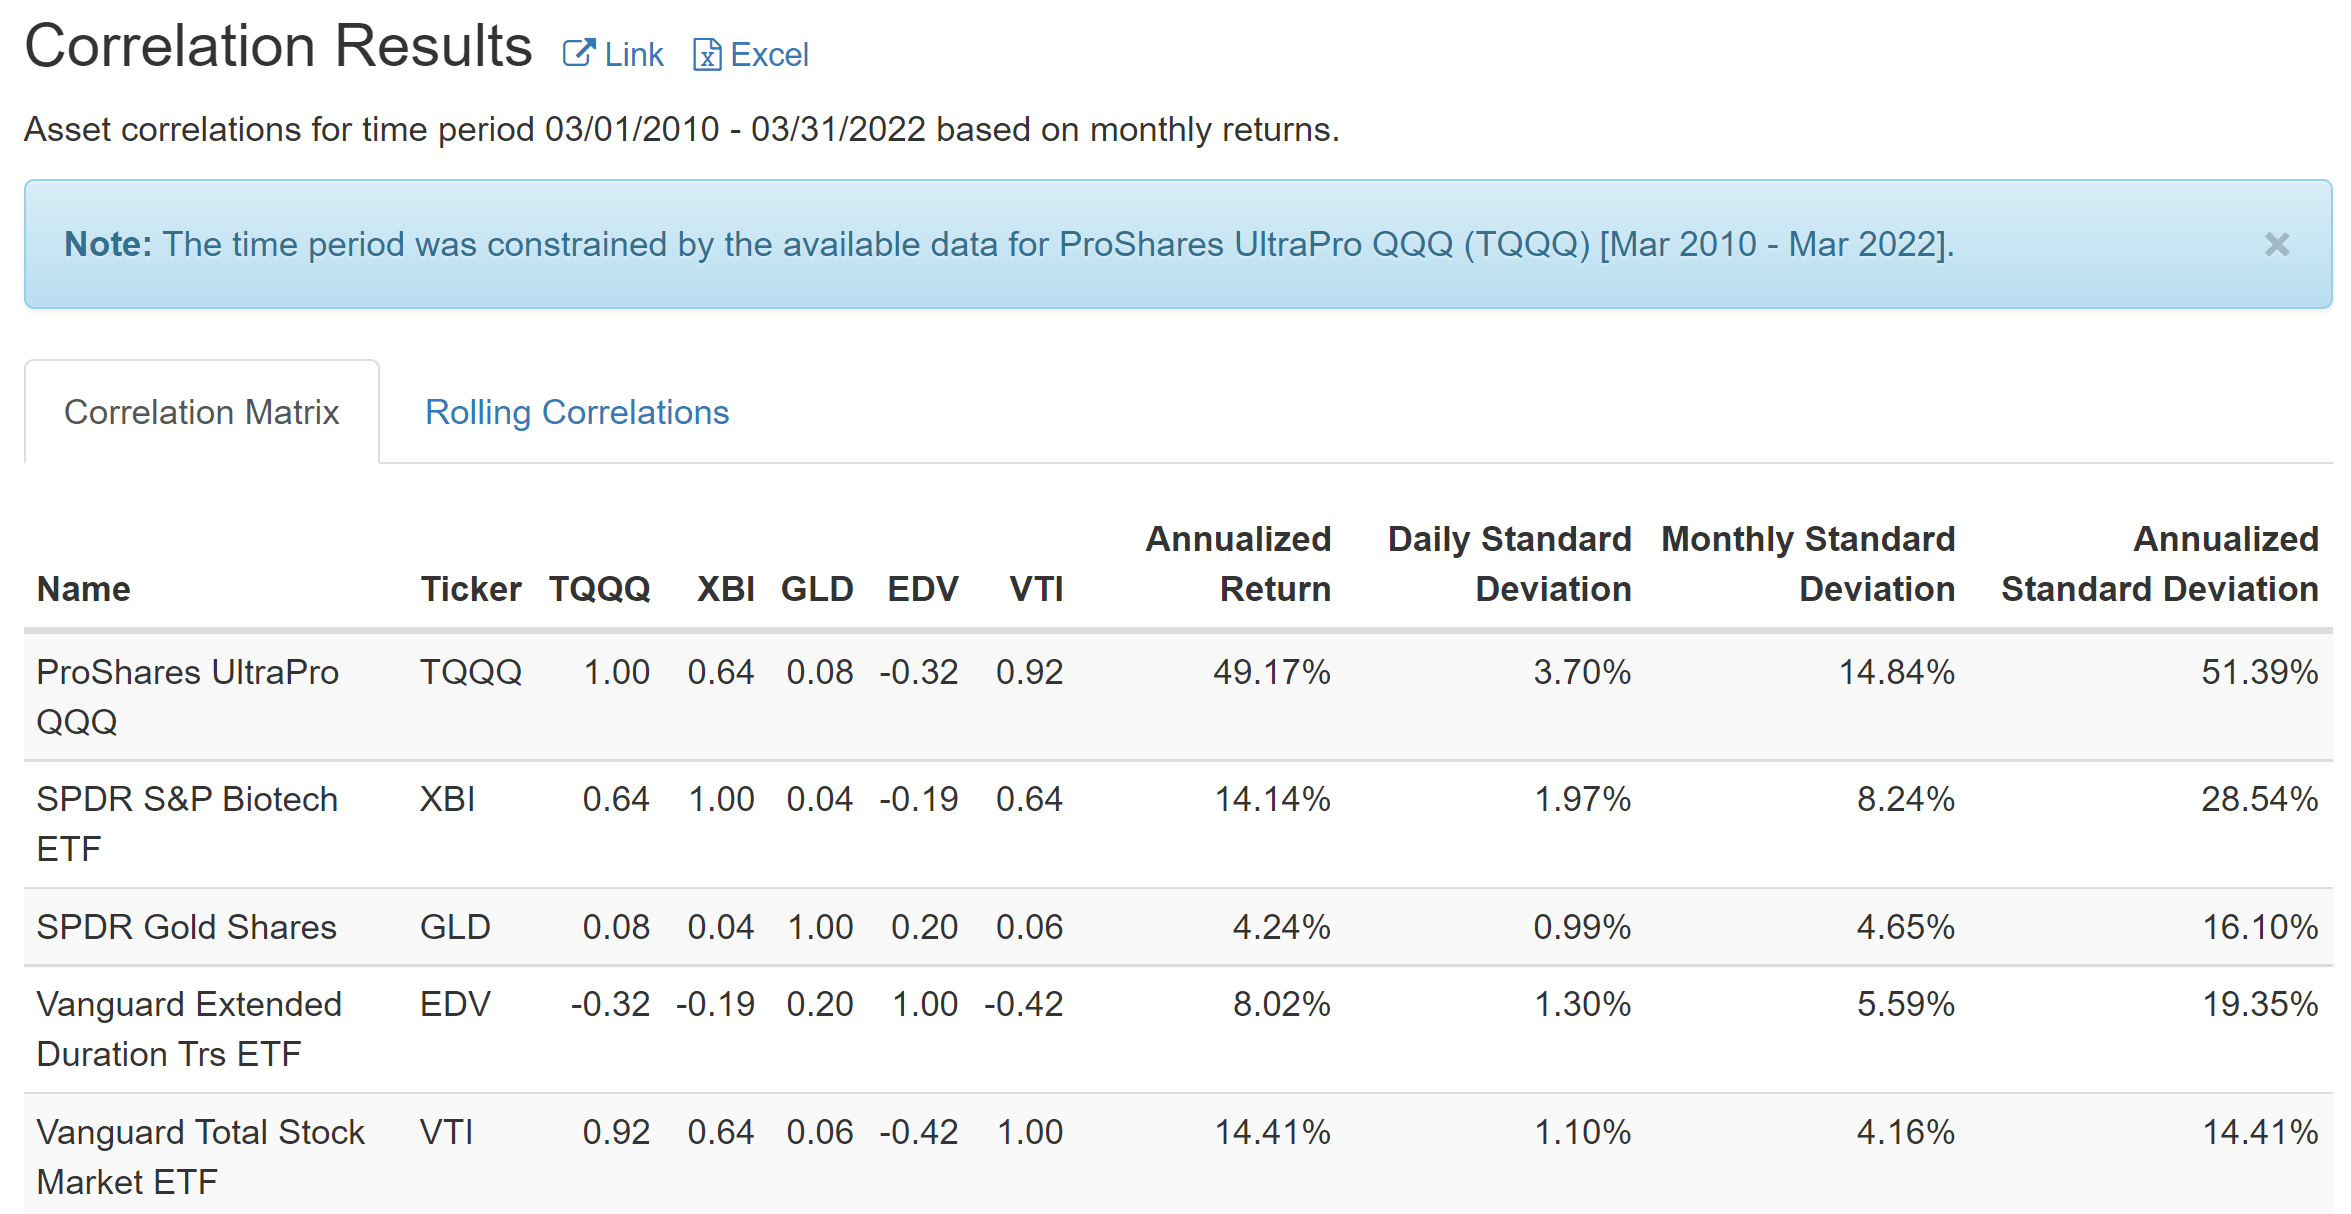
- Due to its focus on the bio-sector and the small-caps, XBI also features a relatively low correlation to the overall market. Its correlation is only about 0.63 relative to the overall market.
- Although investors do have to be aware of their price volatilities due to the use of leverage and/or their connected exposure. As you can see, both TQQQ and XBI have suffered substantially larger worst year performance, standard deviation, and maximum drawdowns compared to the overall market. This is why we have to be disciplined with their use and have to hold them together with other asset classes as hedges as you can see.
www.portfoliovisualizer.com www.portfoliovisualizer.com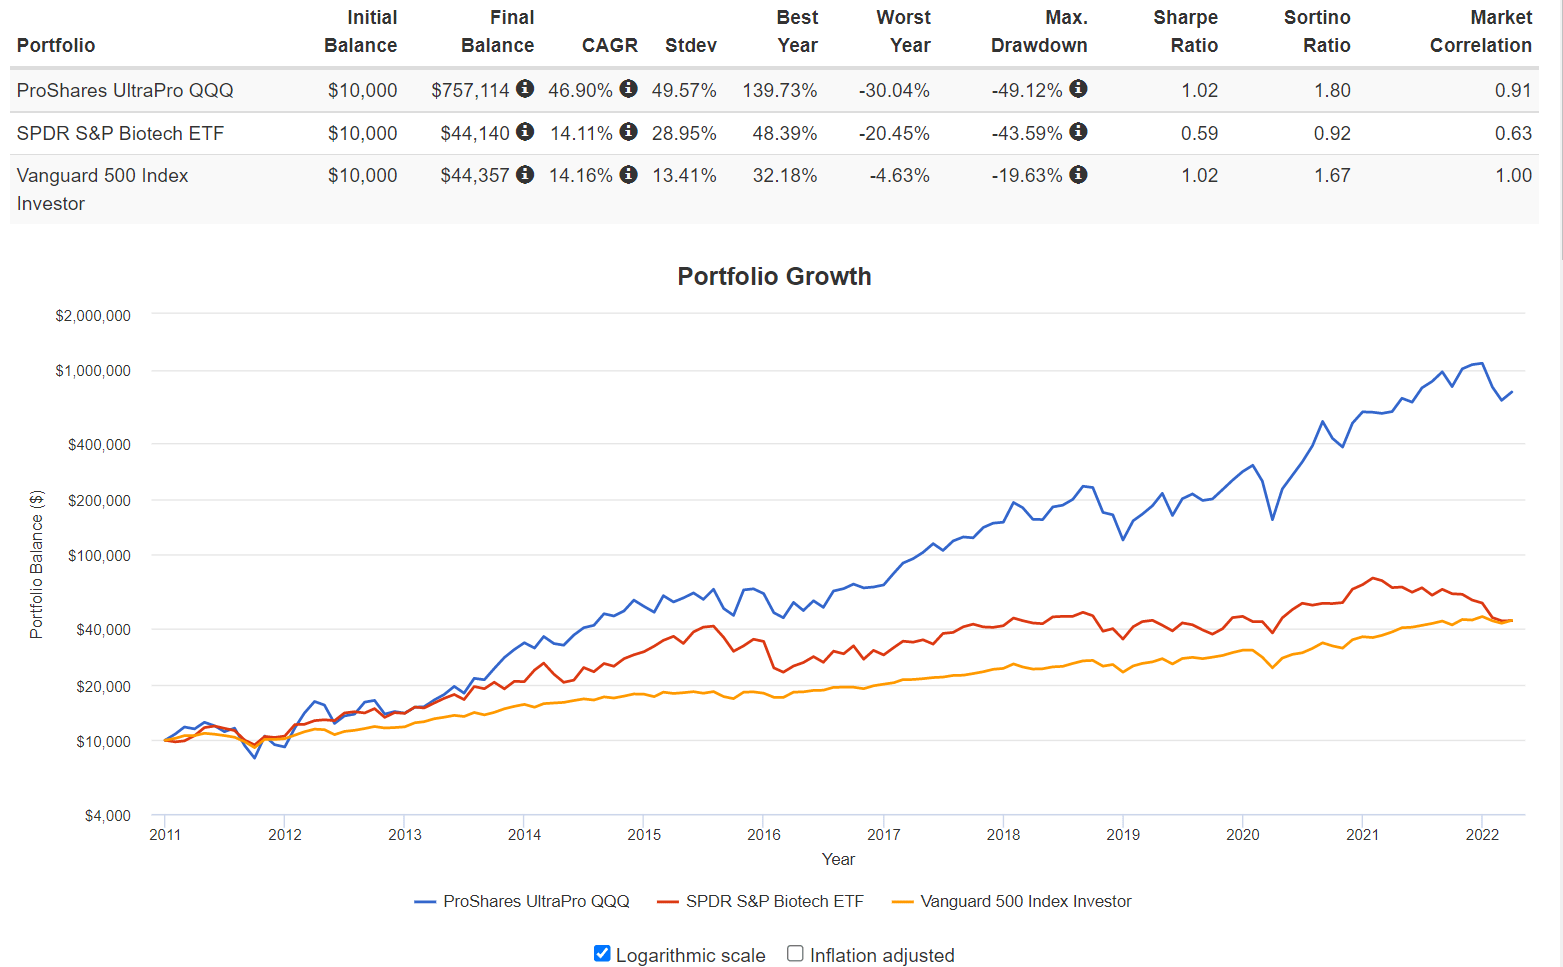
How Do We Use TQQQ To Seek Aggressive Growth?
Many of you reading this probably know about Ray Dalio’s All-Weather Portfolio (“AWP”). It is an approach to provide portfolio-level diversification using four different asset classes (stocks, bonds, commodities, and gold) in the following ratios.
- 30% US stocks
- 40% long-term treasuries
- 15% intermediate-term treasuries
- 7.5% commodities, diversified
- 7.5% gold
You can see details of our thoughts and reservations on the AWP in our earlier article. As a summary:
- First, it might be too conservative for many investors (with only 30% stocks).
- The fixed allocation does not make intuitive sense. As a recent example, during the 2020 March COVID-19 crash, treasury yields dropped to a level (0.6% for 10-year maturity) that Dalio himself considered silly to own government bonds. Yet if you stick to the original AWP, you would still be holding 55% of government bonds in your portfolio.
Recognizing the above issues, we have been researching ways to revise it to a version that is more applicable to us. And the methods we described here are the culmination of our own research, proven and vetted by our own experiences since about 2012. The key strategies are:
1. We do not hold commodities.
2. We use 30% as the floor for stock allocation and add to it based on the yield spread between the overall stock market and 10-year treasury yield.
3. We use leverage dynamically to achieve aggressive growth.
Here, we focus on the third bullet point and its application to TQQQ. We use the VIX index to measure the volatility of the market and adjust our leverage. We leverage less when VIX increases and more when the VIX decreases according to the blue curve. In practice, we also cap my maximum leverage at 25% as shown by the green line. More specifically, the blueline follows a 1.5th power-law relationship in the form of Leverage ~ 16/VIX^1.5. So that when VIX = 16, the leverage is 25%, i.e., the maximum is reached and 25% of our equity exposure will be leveraged.
In case you are wondering where we got these magical numbers, the rationale is twofold:
- VIX=16 is about the historical average of the market volatility index and we are comfortable cranking up to our maximum leverage level in the AGP when VIX is near or below the historical average.
- The 1.5th power-law gives us the level of sensitivity that we are comfortable with.
Author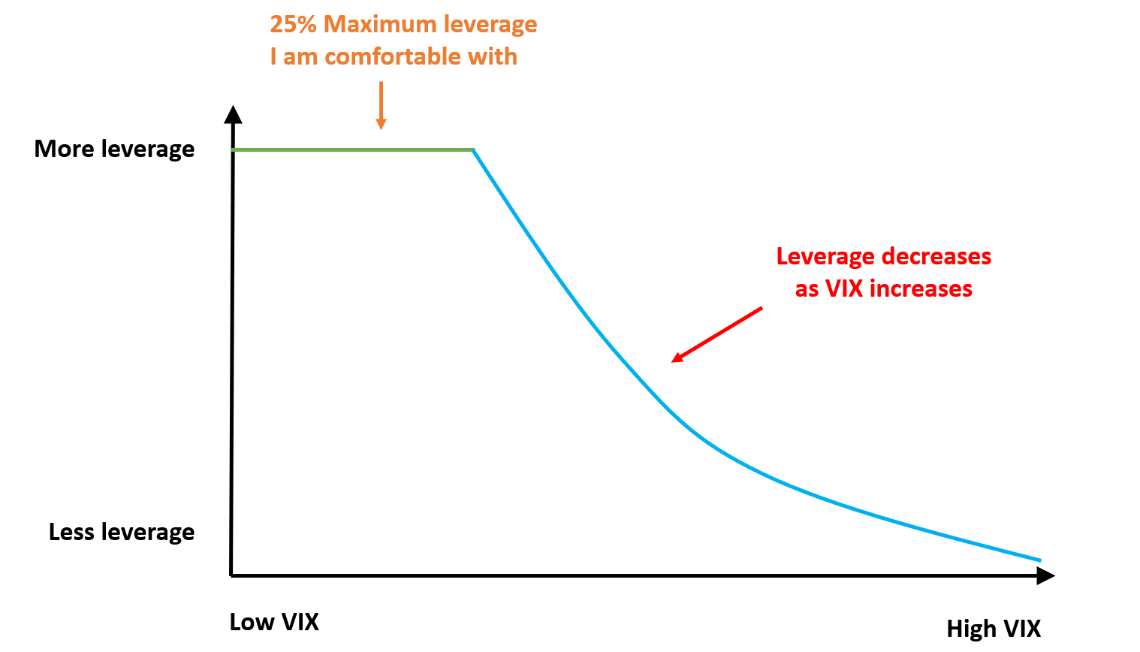
How We Use XBI In Our AGP?
As aforementioned, we dynamically allocate equity funds opportunistically based on the relative valuation of equity vs bond. In XBI’s case here, its valuation is currently at a secular bottom as you can see from the following charts. The first chart shows that its current PE ratio is about 12.x only and its price cash flow ratio is only about 11.7x. As a result, its earnings yield relative to the risk-free treasury rate is at a wide level despite the surging treasury yield.
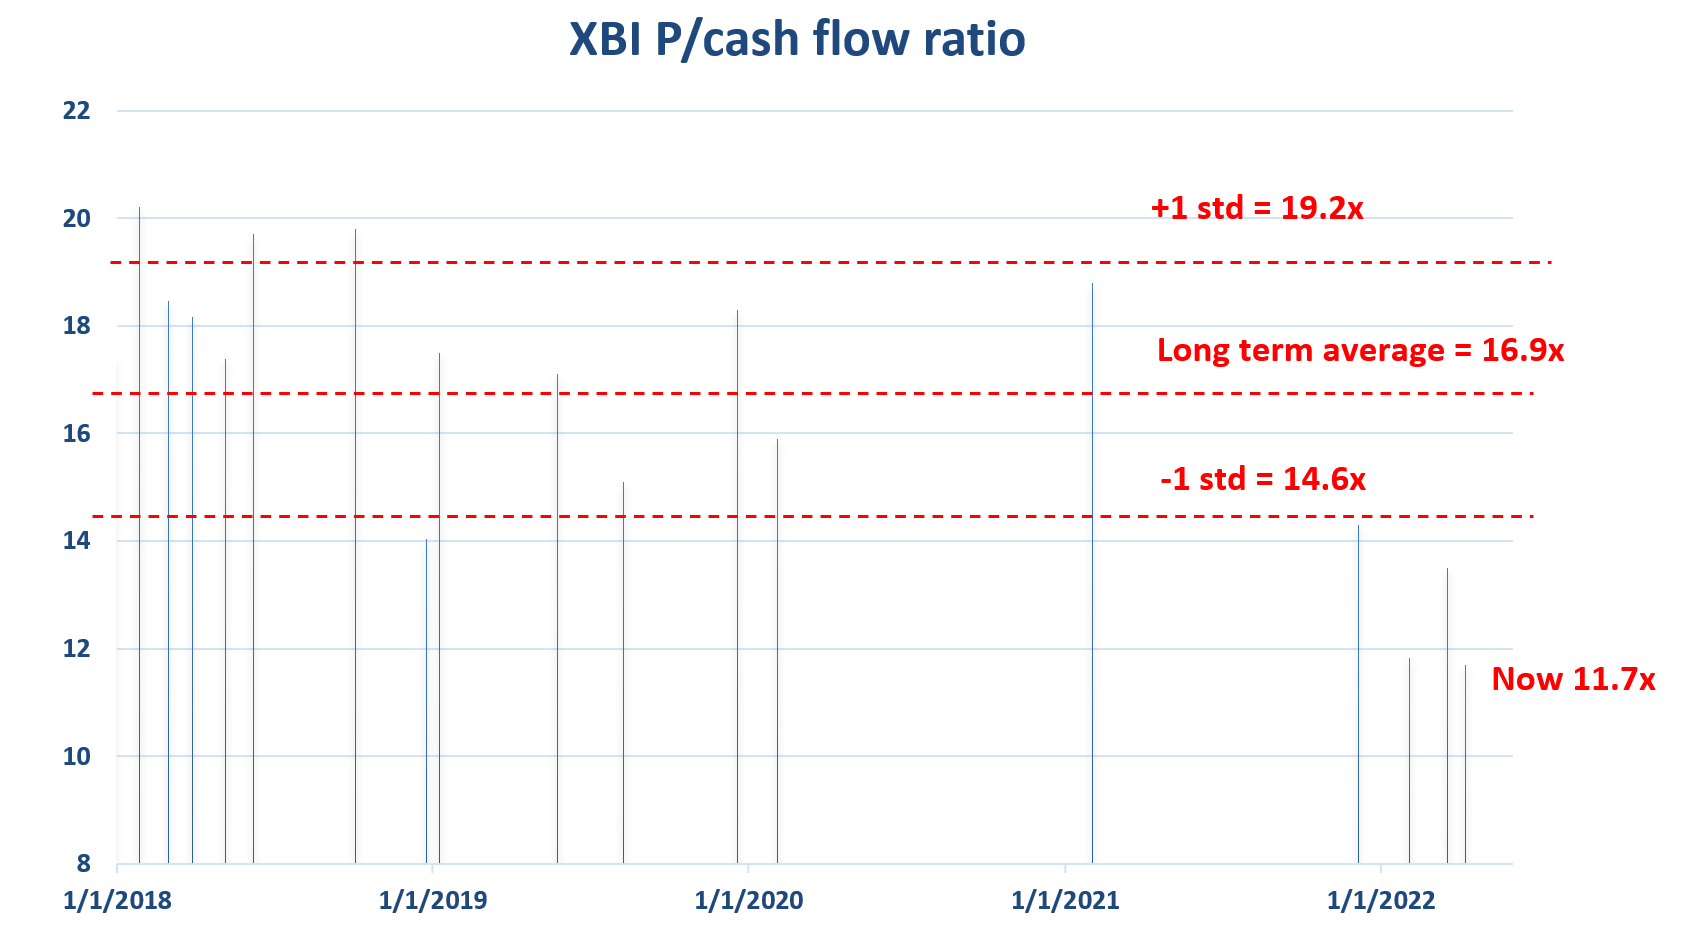
To put things under a broader perspective, the second chart shows my personal record of the price/cash flow ratio I’ve recorded since 2018 at some of the critical market junctures from the fund’s website. As can be seen, its long-term average is about 16.9x. And now it’s only valued at 13.5x. It is not only discounted from the historical average, it is discounted by more than 1 standard deviation.
www.ssga.com fund information Author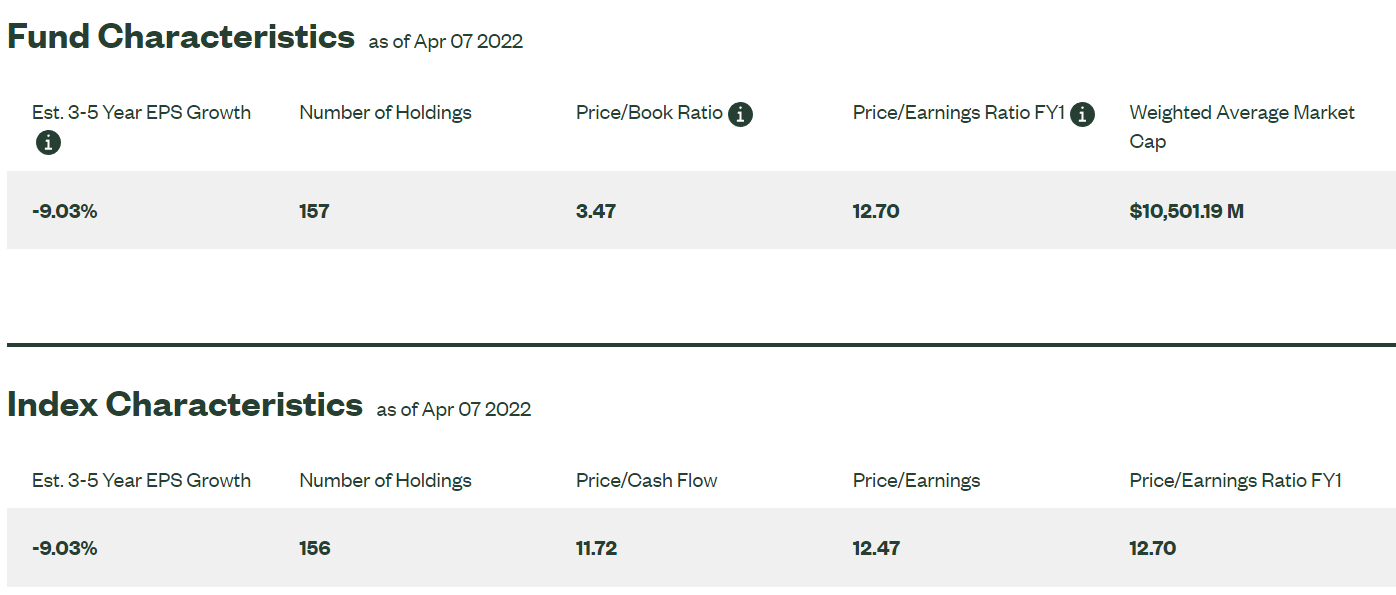
How Did Our AGP Perform In The Long Term?
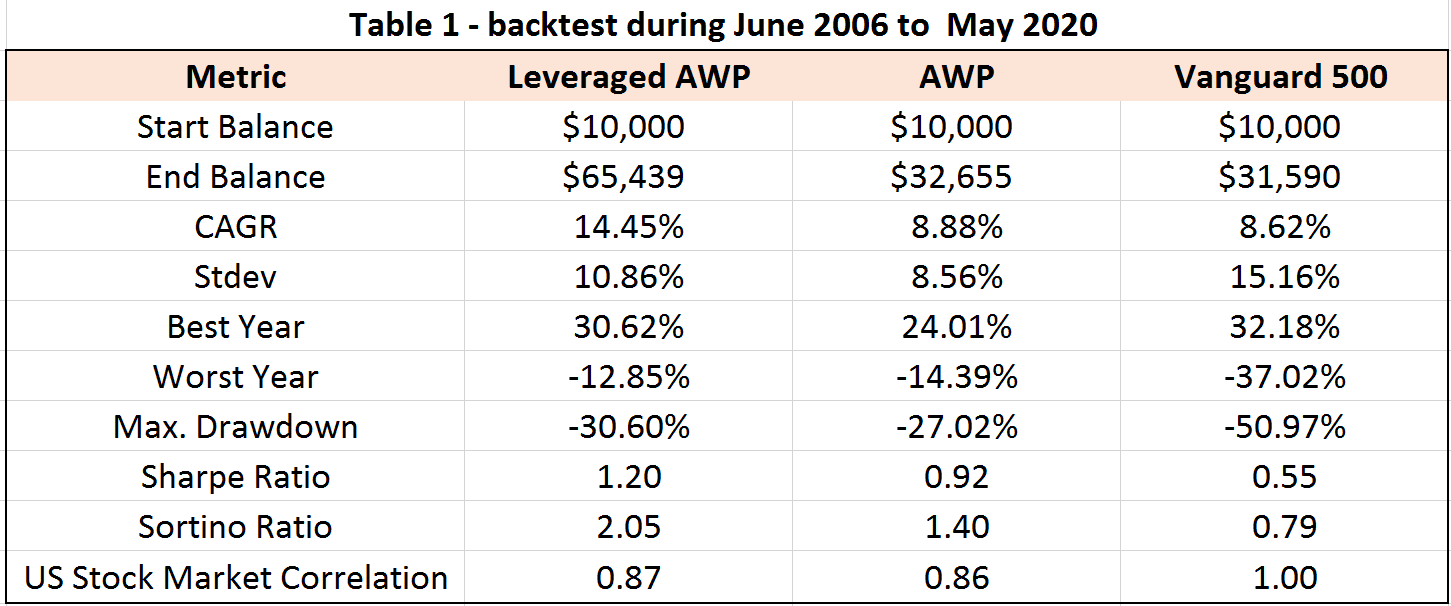
Before publishing it in our marketplace services, we have been holding these funds and applying the above approach to our own and others’ accounts (family members and close friends). The following chart shows the back-test result of our aggressive growth portfolio from 2006 to 2020. We have been actually implementing the strategy ourselves since ~2012 and our actual return is even better because of the success we’ve had with our tactical holdings.
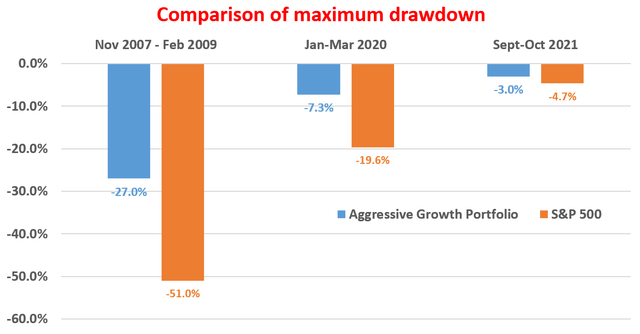
And the second chart compares the risks in terms of maximum drawdowns in three market events – the 2008 financial crisis, the 2020 COVID crash, and the more recent market jitter during September 2021. As seen, the leveraged AGP actually provided significantly lower risks, not only measured by drawdowns, but also by other metrics such as standard deviation, worst year loss, Sharpe Ratio, Sortino Ratio, et al. During the 2020 COVID crash, it “only” suffered a maximum drawdown of -7.3% (thanks to the hard landing of treasury bond yields and above all the disciplined approach), compared to about -20% form the S&P 500.
Simulation from Portfolio Visualizer, Silicon Cloud Technologies LLC Simulation from Portfolio Visualizer, Silicon Cloud Technologies LLC Simulation from Portfolio Visualizer, Silicon Cloud Technologies LLC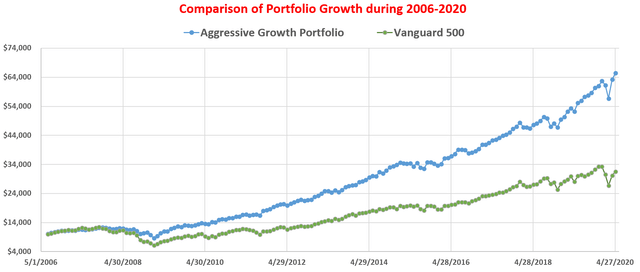
Conclusions And Risks
Both TQQQ and XBI offer convenient vehicles for investors to seek aggressive growth. In particular,
- They both tap into the most innovative sectors in our economy. And as a result, they have consistently outperformed the overall market in the long term.
- Although investors do have to be aware of their price volatilities due to the use of leverage and/or their connected exposure. This is why we have to be disciplined with their use and hold them together with other asset classes as hedges.
- In TQQQ’s case, we use the VIX index to measure the volatility of the market and adjust our leverage. We leverage less when VIX increases and more when the VIX decreases.
- In XBI’s case, we dynamically allocate its weight opportunistically based on its valuation. Its valuation is currently at a secular bottom (PE ratio about 12.x only and its price cash flow ratio about 11.7x). As a result, its earnings yield relative to the risk-free treasury rate is at a wide level despite the surging treasury yield.
Finally, we’d like to point out the risks before closing this article:
- As a leveraged fund, TQQQ suffers a) potential risks of a total loss (e.g., a 33.3% daily crash would lead to total loss since it is 3x leveraged), b) the higher fees, c) the loss of dividend, and d) the volatility drag. When the overall market is range-bound or suffers a one-way decline for an extended period of time, the leveraged asset would not only underperform but underperform it more than the nominal leverage implies (i.e., by more than 3x in the case of TQQQ).
- As for XBI, its short-term price volatility is a major risk. Investment in biotech small-cap companies in their early stage entails large volatility risks, especially in the short term. These stocks are notorious for their boom-or-bust binary outcome. XBI is also exposed to concentration risks, more so than TQQQ or QQQ, because the fund is exposed to only one sector. A negative development (such as a legislation change against the biotech sector) can have a targeted and direct impact on this fund.
- Lastly and most importantly, you should NOT pursue growth at all unless/until you have put aside enough funds to ensure your survival in the near term (that is why we maintain two separate portfolios ALL THE TIME ourselves).
Be the first to comment