

SvetaZi/iStock via Getty Images
Thesis and Background
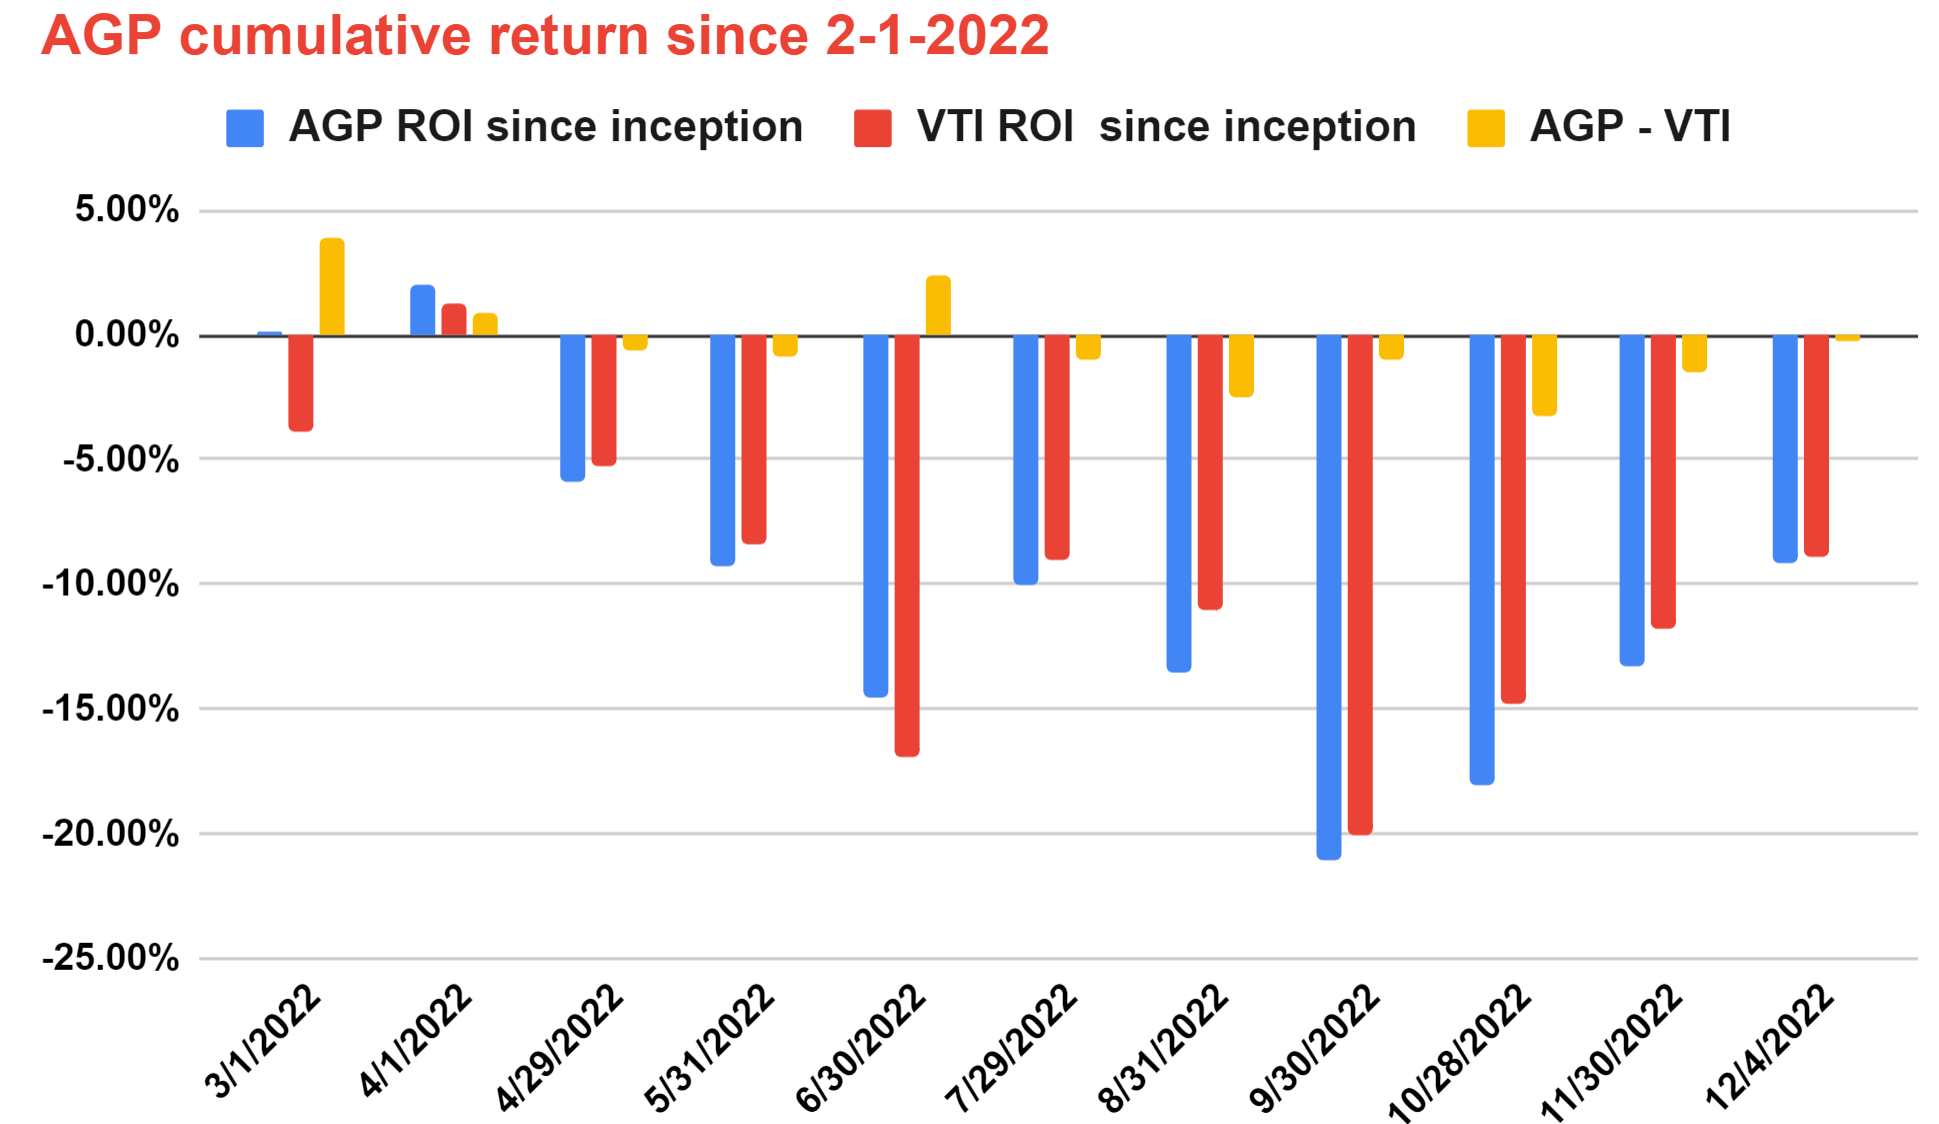
2022 has been a challenging time for investors, ourselves included, as you can see from the chart below. The first chart shows the holdings in our aggressive growth portfolio (“AGP”). It’s a real-money portfolio that we use to seek aggressive growth as the name suggests. And the second chart shows its cumulated returns since Feb 1, 2022, the date we started our marketplace service and started writing about this portfolio regularly to our members. A few highlights:
- As you can see from our holdings in the first chart, we have a sizable exposure to both the ProShares UltraPro QQQ ETF (NASDAQ:TQQQ) and SPDR S&P Biotech ETF (NYSEARCA:XBI). Currently, the allocation in our AGP toward XBI is about 9.49% and 9.90% for TQQQ.
- As you can see from the second chart below, our AGP has been outperforming overall in the earlier part of the year till June. As to be elaborated later, the heightened market volatility since June has been the main enemy of aggressive growth assets such as XBI and TQQQ. As seen, our AGP lost its lead in June and lagged in the overall market since then. As of this writing, the AGP suffered a total loss of -9.12% and the overall market -8.85% (represented by VTI), resulting in a small lag of 0.27%. Both performances are adjusted for dividends.
- The chart only provides data since Feb 1, 2022, even though we have been holding the AGP for almost a decade. The reason for providing data since Feb 1, the launch date of our marketplace service, is to provide data easily verifiable for our members.
Before going any further, I want to caution readers about the risks of both funds. Both funds have exhibited far large volatilities than the overall market due to their fund-specific features such as the use of leverage and concentrated exposure to small caps in the volatile biotechnology sector. Moreover, TQQQ, as a 3x leverage fund, suffers beta slippage or value erosion even whenever the holding period is longer than 1 day. As we dive in, we will elaborate on these risks, our strategies for using them, and also for exiting them. For investors new to leveraged ETFS, this FINRA article provides a balanced view of their applications and risks.
As we move forward into 2023, first and foremost, we urge our readers to stay disciplined no matter what happens. Especially with aggressive holdings like XBI and TQQQ, staying disciplined and sticking to strategies you really understand is the key to survival in the long term. It is also the simple road to beating the market – although not easy (it is never easy to stay disciplined with all the market hypes and fears). It is also important that I clarify the meaning of “long term” here given that you were just cautioned about the value erosion of holding leveraged ETFs for even more than 1 day. Long-term does not mean we hold TQQQ or XBI ALL the time. As to be explained later, we have clear criteria to add, reduce, and exit both positions and we monitor these criteria closely. Hence, long-term here means both funds have been always on our radar and we hold some amount of them from time to time.
For us, we follow two simple rules: the volatility index and the valuation. And in the remainder of this article, you will see that:
- The current market volatility hovers near the quietest level in a year, signaling us to increase allocation towards aggressive growth.
- And for XBI, its current valuation hovers around a secular low (P/cash flow around 12.4x and FWD P/E around 14.2x), providing an attractive return potential ahead.
Source: author and Seeking Alpha. Source: author and Seeking Alpha.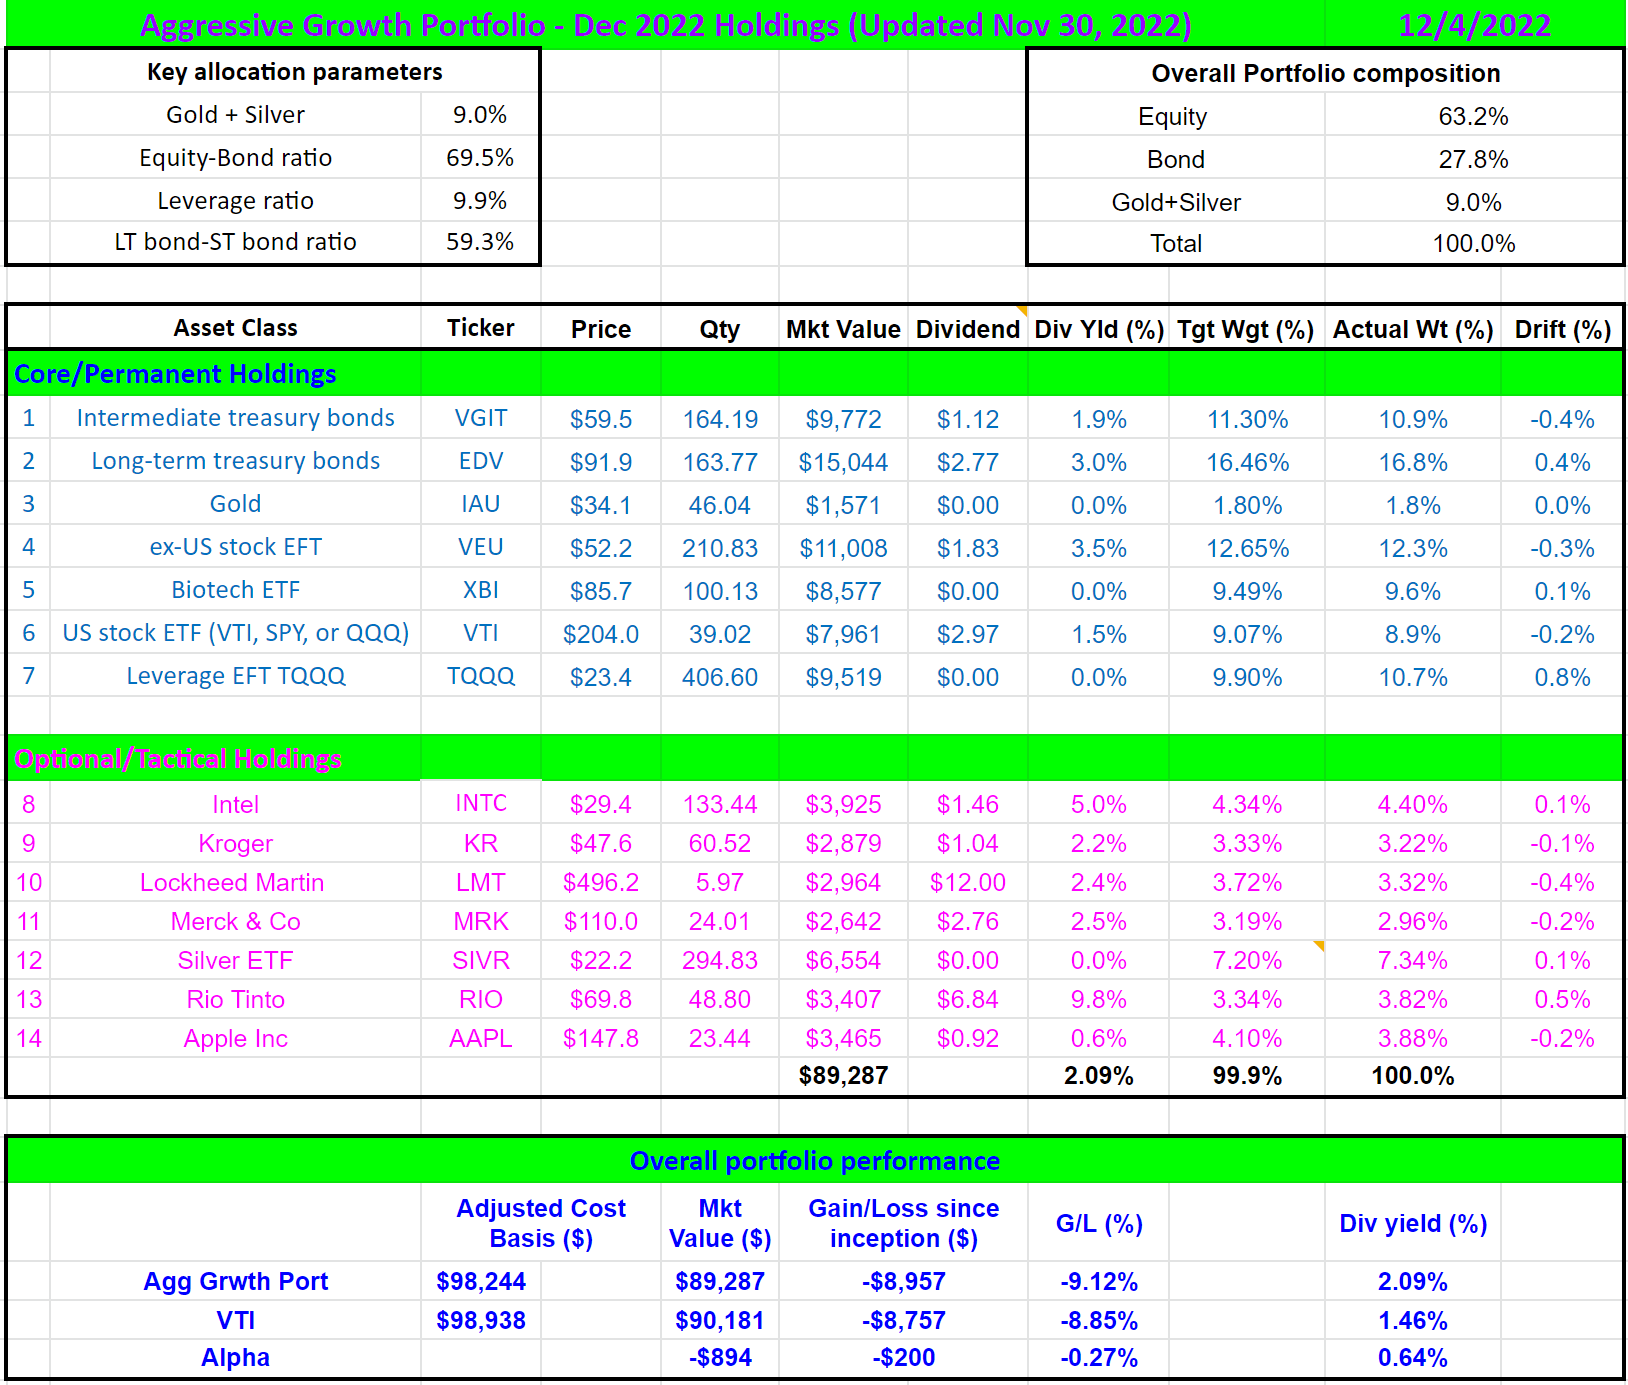
TQQQ and XBI: basic info
A quick intro to these funds in case there are readers new to these funds. Their fund descriptions are quoted below. These quotes are slightly edited with emphases added by me also.
XBI fund description: XBI seeks to provide exposure to the Biotechnology segment of the S&P TMI, which comprises the following sub-industries: Biotechnology. It seeks to track a modified equal-weighted index that provides the potential for unconcentrated industry exposure across large, mid, and small-cap stocks. It allows investors to take strategic or tactical positions at a more targeted level than traditional sector-based investing.
TQQQ fund description: This leveraged ProShares ETF seeks a return that is 3x the return of its underlying benchmark (target) for a single day, as measured from one NAV calculation to the next. Common uses for TQQQ include seeking magnified gains (will also magnify losses), getting a target level of exposure for less cash, and overweighting a market segment without additional cash.
For us, we use both of them to gain more targeted exposure to particular market segments as described above. Both XBI and TQQQ target the most innovative segments. XBI is a pure biotechnology fund and TQQQ is dominated by info tech stocks. As a result, both funds have consistently outperformed the SP 500 as seen in the chart below in the longer term. Although it is very important to point out that TQQQ’s outperformance during this particular period of time (2011 to 2022) was because of the overall upward trend of eh market. So that A) the effects of value erosion as aforementioned are relatively to start with, and B) these effects are dominated by the 3x upward gearing. Under different market conditions, TQQQ (or leveraged funds in general) could lag the overall market miserably. For example, in range-bound markets, TQQQ (or other leveraged ETFs) would post negative returns even though the underlying (say QQQ) just oscillates around the same average price. And in a one-way downward market, TQQQ would not only lose more than QQQ but would also lose more than 3x than QQQ (again due to the valuation erosion as to be detailed later).
Note that XBI follows an equal-weighted index strategy as described above, a strategy I prefer better than market-cap-based indexing when it comes to high-risk and venture-capital-type stocks. At a portfolio level, XBI also serves as an excellent diversification to other asset classes. As you can see from the second chart below, it features low or negative correlations against all other main asset classes easily accessible by ordinary investors: its correlation coefficient is only 0.64 relative to the overall market (represented by VTI), 0.64 to the overall tech sector (represented by TQQQ), 0.04 relative to gold, and -0.19 relative to long-term bonds.
Source: www.portfoliovisualizer.com Source: www.portfoliovisualizer.com

Our rules for the AGP
As detailed in our earlier article, we follow a few simple rules to pursue aggressive growth. First and foremost is to separate survival from growth following a barbell model. Then for growth, we follow the following strategies:
- Opportunistic equity-bond rebalance. We use an equity-bond index to A) monitor the adjusted yield spread between equity and bonds, and B) opportunistically allocate equity funds such as XBI. XBI’s valuation is near a secular bottom as to be elaborated in the next section and as a result, its current target allocation is nearly 10% as aforementioned.
- Dynamic leverage. We also use an algorithm to systematically adjust leverage based on volatility and market valuation to generate reliable long-term aggressive growth. And TQQQ is the fund we use for leverage.
The algorithm relies on the VIX and QQQ’s P/E multiple. The second factor is easier to explain: the cheaper the valuation of the underlying asset (represented by QQQ), the more TQQQ we hold. The first factor is a bit more complicated. The overall concept is to leverage more when VIX is high and vice versa. Although in practice, we added a few more tweaks as shown in the adjustment curves below. In particular:
- we cap our maximum leverage at 25%.
- we adjust our leveraged following a 1.5th power-law relationship with respect to the VIX index (i.e., our leverage scales as 16/VIX^1.5). As a result, when VIX is at 16, the max leverage of 25% is reached.
The same algorithm also determines when we exit our TQQQ position: either when the VIX is too high, or when QQQ’s P/E multiple is too high, or a combination of both. For example, if the P/E of the NASDAQ 100 index reaches ~40x (roughly the conditions toward the end of 2021 or the beginning of 2022), our allocation towards equity would be low (about 40% of our total AGP). Say at the same time VIX sits around 25. With the 16/VIX^1.5 rule, our TQQQ exposure would be about 12.8% of our equity exposure. So in the end, TQQQ’s allocation would be about 5% of our total AGP (40% equity allocation * 12.8% TQQQ relative weight = ~5%). And 5% is a threshold we closely monitor and decide if we should exit, again because it signals either high P/E, or high VIX, or both.
Source: author.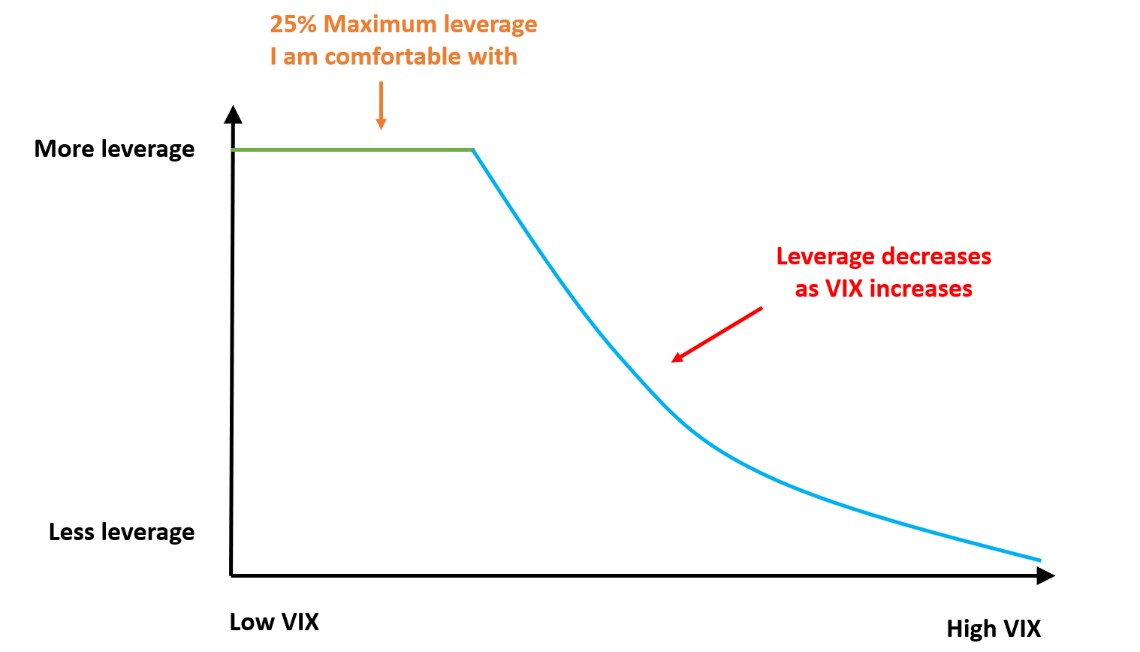
Against this backdrop, the next chart shows why we are allocating a sizable of our AGP to TQQQ (about 10% as aforementioned). As seen, the VIX index has decreased substantially in the past year, especially since June (when our AGP began to lag). To wit, the VIX index has spent most of its time hovering around the 30+ level in the 1H of 2022 and has spent many trading weeks even above the 35+ level. A VIX of 35 indicates extreme volatility, near the top 96% percentile of historical VIX. Now, the VIX index has subdued to the 19.08 level, which corresponds to about the 60% percentile only.
And this is also the reason why we pick the magic scaling factor of 16 in our above allocation curve. A VIX of 16 is about 50% percentile historically, and we are comfortable with a 25% leverage when the volatility is at or below its historical mean.
At the same time, the Nasdaq 100 index underlying TQQQ is trading at a reasonable or even attractive valuations too. QQQ’s current P/E is ~22x from Yahoo! finance data. If we use QQQ’s valuation to approximate that of the Nasdaq 100 index, a P/E of ~22x is among the lowest levels in the past 2~3 years as you can see from the second chart below.
All told, combined with the underlying P/E of QQQ (~22x only) and the subdued VIX of 19, we are allocating 9.9% of our AGP toward TQQQ, which corresponds to about 15% of our total equity allocation (compared to 25% ceiling). And we will keep monitoring both the valuation and VIX and provide updates when we see the need for major allocation changes.
Source: Author based on Yahoo data Source: siblisresearch.com/data/nasdaq-100-pe-ratio/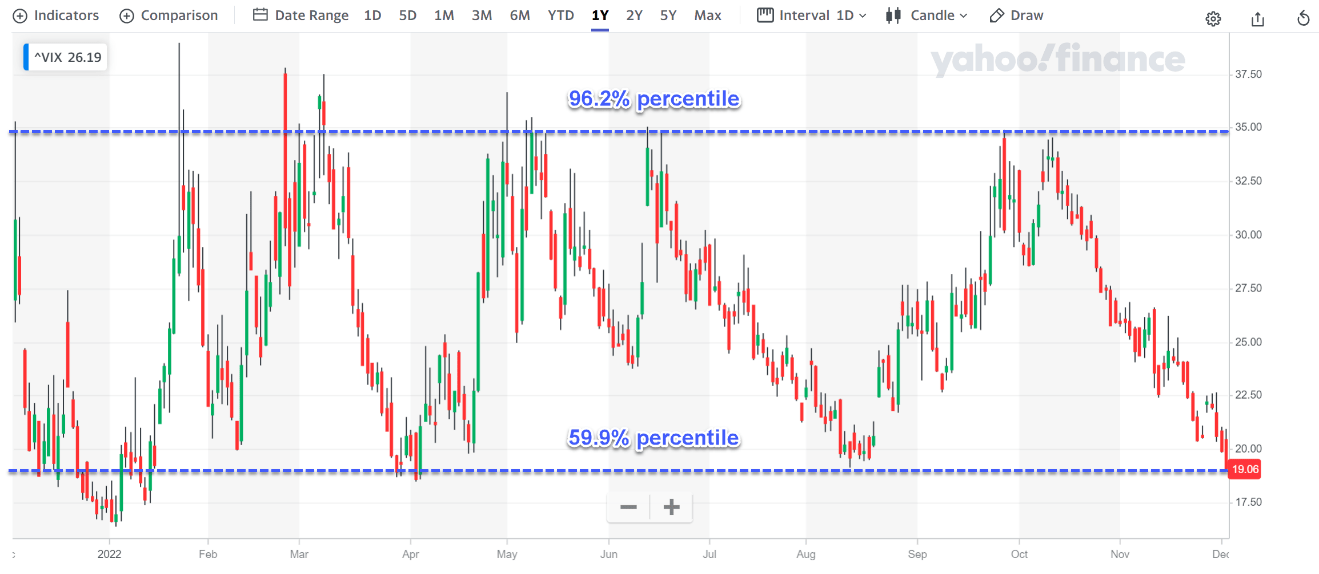

XBI’s current valuation is particularly attractive
Just like QQQ, XBI’s valuation is quite attractive too, perhaps even more so as seen in the charts below. As aforementioned, we dynamically allocate XBI’s exposure based on its valuation relative to bonds and other asset classes. Under XBI’s current conditions, its valuation is near a very attractive level in multi-years. Its current P/E ratio is only about 13.84.x and its price/cash flow multiple is even lower, only about 12.39x as you can see from the first chart.
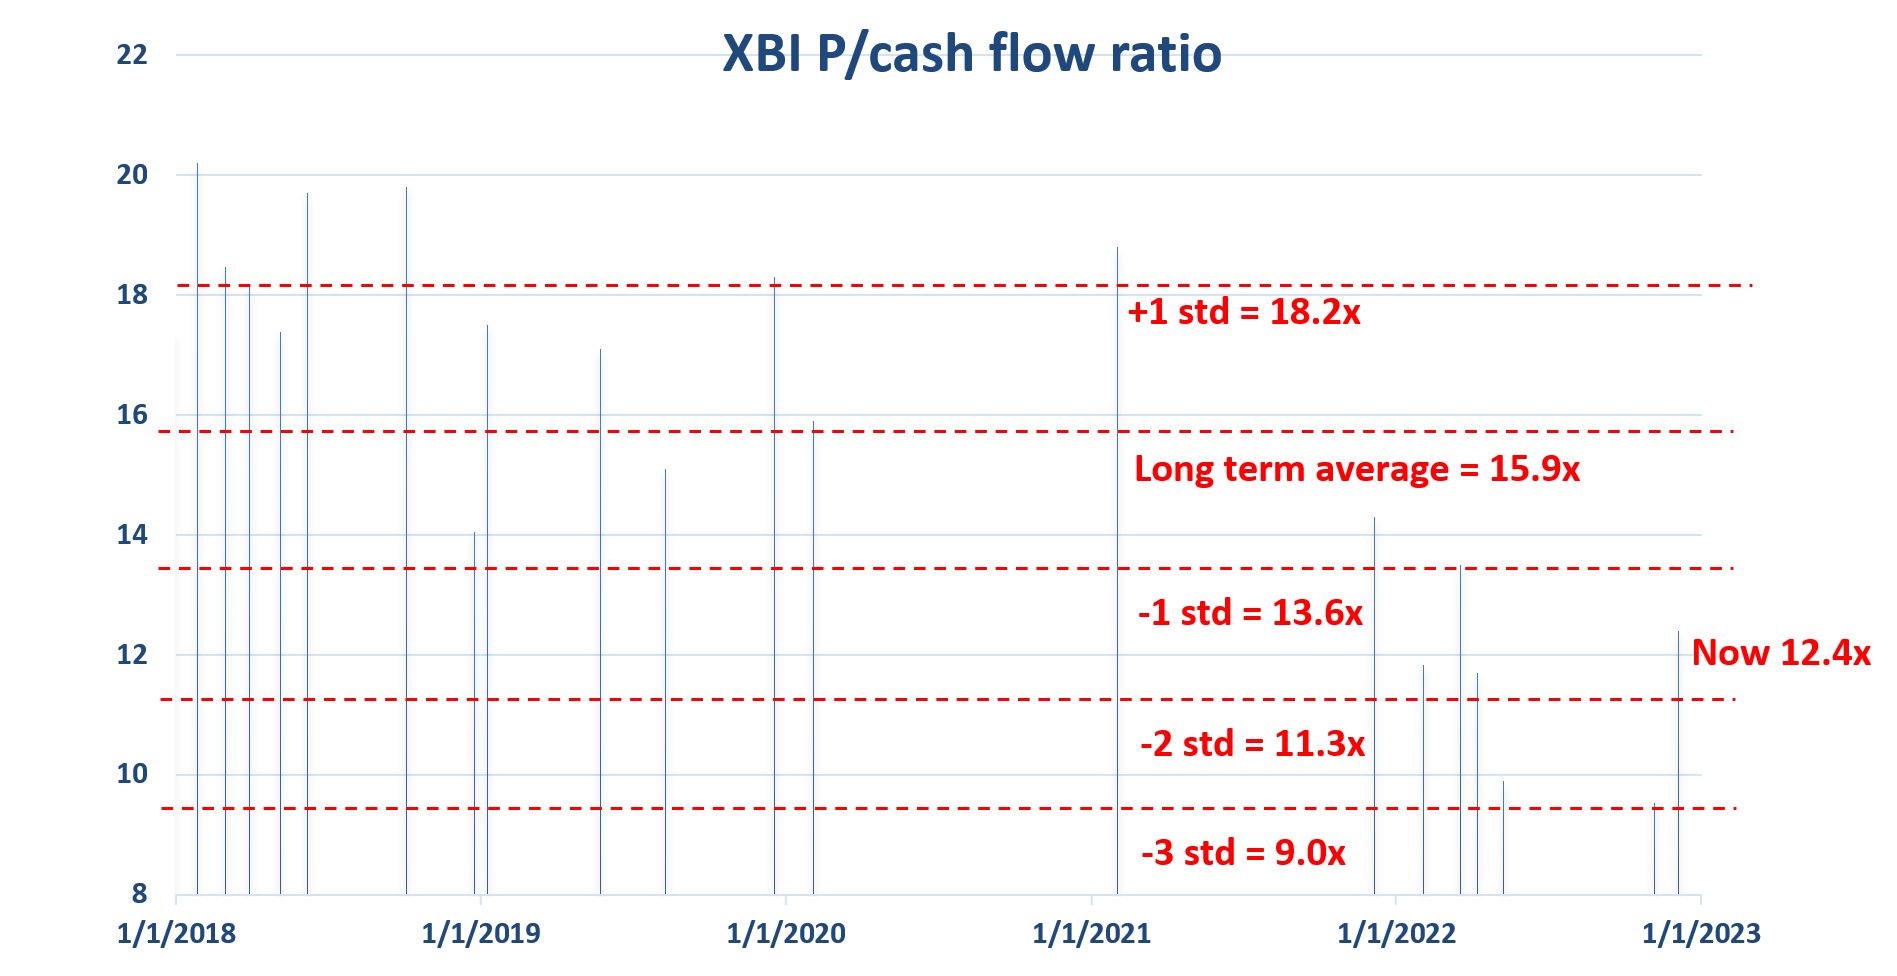
The second chart below shows our personal record of the price/cash flow ratio we have been recording over the years at some of the critical market junctures. As can be seen, its long-term average P/cash multiples are about 16.9x. And now it’s only valued at 13.5x. It is not only discounted from the historical average, but also by more than 1 standard deviation.
We rely on its simple valuation metrics such as P/E and P/cash ratio to decide when to add and when to trim (and by how much). Since we have been holding it and tracking its multiples for years. The following chart shows our record of its P/cash ratios we’ve recorded at some of the critical market junctures. As can be seen, its average is about 15.9x and the standard deviation is about 2.3x. Now it’s trading at 12.4x, translating into a discount of 22% below its historical average and also significantly below its 1-sigma level. This chart also shows our exit criteria. We would exit when the valuation is above 1-sigma (i.e., 18.2x).
Source: www.ssga.com fund information Source: Author based on fund information from www.ssga.com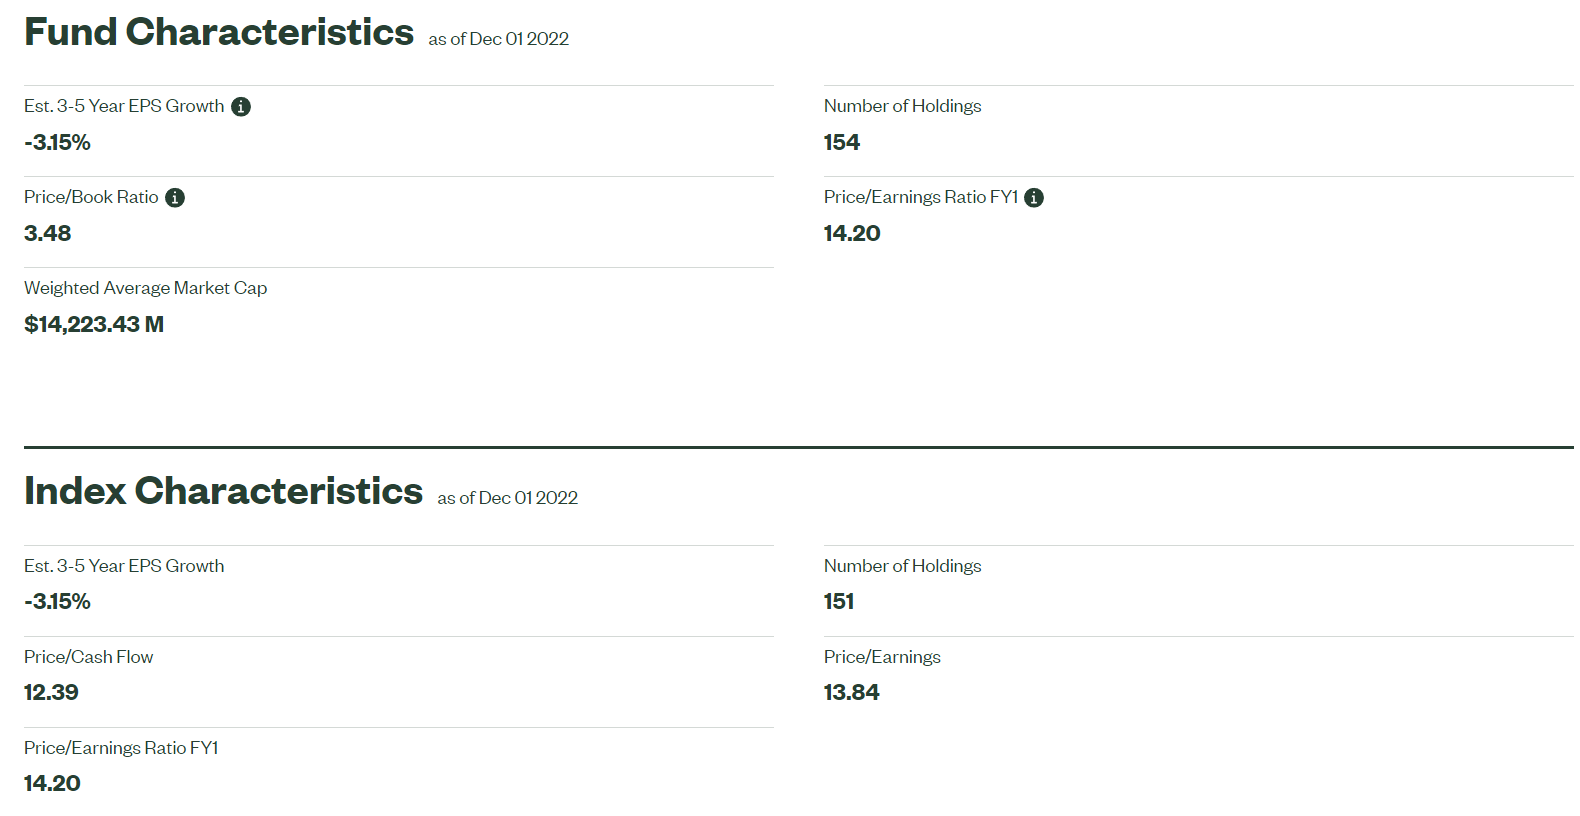
AGP’s long-term performance
As aforementioned, we have been holding the AGP for more than a decade now. And the long-term performance of the AGP portfolio is summarized in the three charts below. These charts have been described in detail in our other articles. This article, entitled “All Weather Portfolio On Steroids – Dynamic Leveraging”, provides the most details. Here I will just point out a few key observations:
- The results shown in the chart only included the ETF funds and not the individual stocks (too tedious to track those). Our actual returns are actually even better than what’s shown here thanks to the success we’ve had with our tactical stock picks.
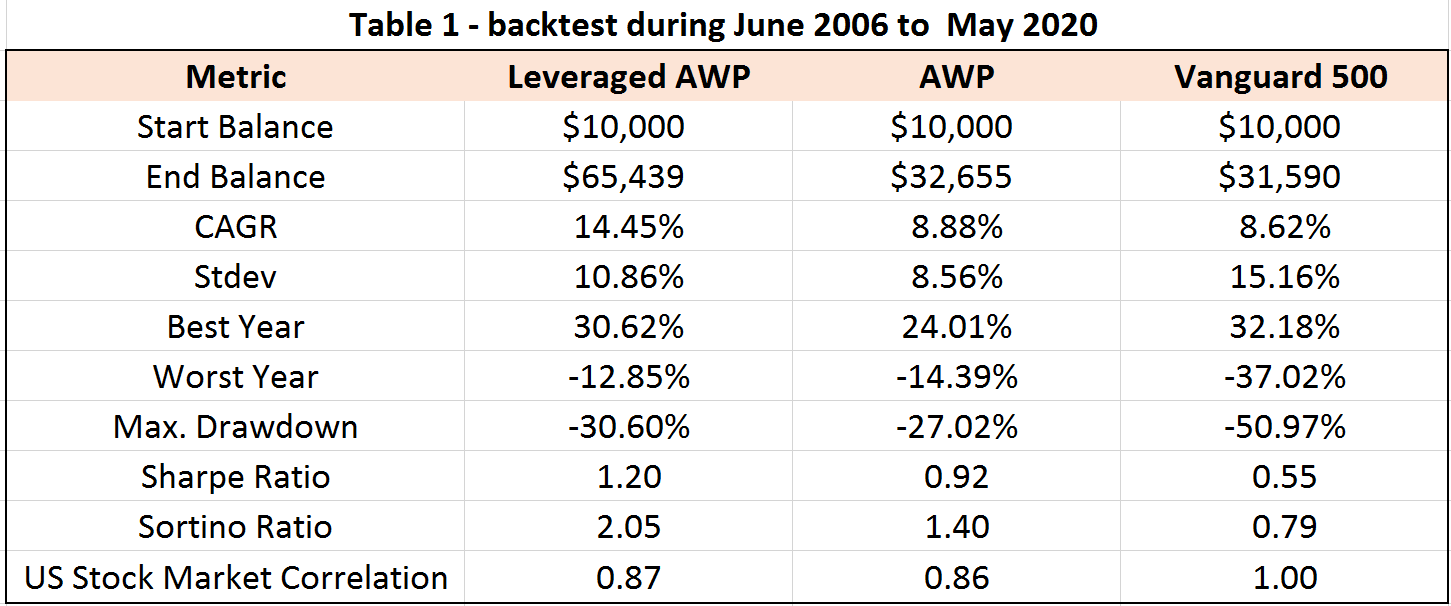
- The second chart compares the performances and risks of the AGP (aka, the leverage All Weather Portfolio, AWP) to the normal and unleveraged AWP and also the S&P 500. As seen, the leveraged AGP actually provided significantly lower risks measured by drawdowns, standard deviation, worst year loss, Sharpe Ratio, Sortino Ratio, et al. As a recent example, during the 2020 COVID crash, it “only” suffered a maximum drawdown of -7.3% (thanks to the hard landing and the strong rallies of our treasury bond holdings), compared to about -20% from the S&P 500.
Source: Author, with simulator from Portfolio Visualizer, Silicon Cloud Technologies LLC Source: Author, with simulator from Portfolio Visualizer, Silicon Cloud Technologies LLC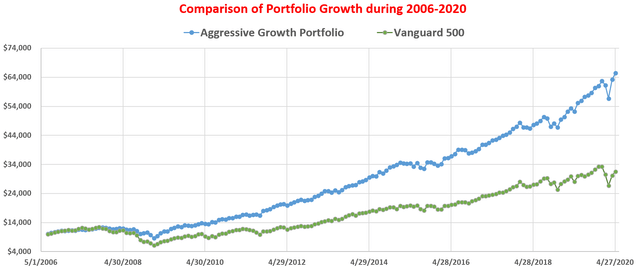
Risks and final thoughts
Finally, risks. As detailed in our earlier writing:
- As a leveraged fund, TQQQ suffers a) potential risks of a total loss (e.g., a 33.3% daily crash would lead to total loss since it is 3x leveraged), b) the higher fees, c) the loss of dividend, and d) the volatility drags.
- XBI entails large concentration risks, more so than TQQQ or QQQ, because the fund is exposed to only one sector. A negative development (such as a legislation change against the biotech sector) can have a targeted and direct impact on this fund.
In particular, the volatility drags associated with TQQQ could cause value erosion in the longer term. All securities, whether they are leveraged or not, suffer volatility drags as detailed in our article comparing SPY and UPRO. The root of the drag is purely mathematical – if an unleveraged security’s price goes up 2% on day 1 and then goes down by 2% on day 2, its price would NOT return to its original price by the end of day 2. It would go DOWN by 0.04%. And applying leverage magnifies such drags as cautioned in the fund description below:
Due to the compounding of daily returns, holding periods of greater than one day can result in returns that are significantly different than the target return and ProShares’ returns over periods other than one day will likely differ in amount and possibly direction from the target return for the same period. These effects may be more pronounced in funds with larger or inverse multiples and in funds with volatile benchmarks.
To conclude, as we move into 2023, I see growth funds such as XBI and TQQQ becoming attractive for at least two reasons.
First, the current VIX index hovers near the lowest level in a year (about 19x) and is also close to the historical average level. Historically, our experiences show that lower VIX levels have correlated with favorable returns on assets seeking aggressive growth. Looking forward, we see good reasons for the volatility to stay at a more subdued level than 1H 2022. The Fed rates are reaching their target levels in our view, thus removing a tremendous amount of uncertainty from the macroeconomic conditions. There are also signs that the inflation has also peaked from the most recent data.
And second, both XBI and QQQ (used to represent TQQQ’s underlying) are trading at reasonable or attractive valuations. QQQ’s current P/E of 22x is among the lowest levels in the past 2~3 years. And XBI’s current valuation (P/cash flow around 12.4x and FWD P/E around 14.2x) is about 22% discounted from its historical average.
Above all, we urge our readers to stay disciplined no matter what happens in 2023, especially with aggressive funds like XBI and TQQQ. Stick to strategies you really understand (do not have to be the same as ours). The key is that you have to truly understand them. You won’t be able to stick to strategies that you do not fully understand when times get tough.
Happy investing in 2023!
Be the first to comment