


KanawatTH/iStock via Getty Images
Written by Nick Ackerman, co-produced by Stanford Chemist. This article was originally published to members of the CEF/ETF Income Laboratory on April 15th, 2022.
Tortoise Power and Energy Infrastructure Fund (NYSE:TPZ) is a rather unique approach in the closed-end fund space to investing in energy infrastructure. The fund is split between investing in equity and fixed-income positions. Before the last couple of years, energy investments struggled for several years. In 2020, most investors know that the price for a barrel of oil went negative for a brief period. The more conservative approach with having a meaningful allocation to bonds meant TPZ held up relatively better. However, as we would suspect, during the raging energy market through 2021 and the start of 2022, we see performance underperform their heavier equity peers.
This fund still could represent an attractive option for investors who want to be invested in the energy space but perhaps want to take some of the risks off the table. The fund is sporting a deep discount, but has been reducing this discount materially over the last couple of years as well. The fund has also aggressively hiked its distribution to shareholders rather recently. It still isn’t at pre-2020 market crash levels but is heading in the right direction.
The Basics
- 1-Year Z-score: 0.67
- Discount: -13%
- Distribution Yield: 8.68%
- Expense Ratio: 1.65%
- Leverage: 18.80%
- Managed Assets: $132.3 million
- Structure: Perpetual
TPZ is a fairly standard closed-end fund when it comes to its investment objective; it “seeks high level of current income, with secondary objective of capital appreciation.” To achieve this, the fund has “exposure to power and energy infrastructure fixed income securities as well as dividend-paying equity securities.” The fund highlights two important points for investments in the energy space that often get brought up; due to the CEF structure. That is, there is no K-1 and no UBTI. That means the fund can be more appropriate for an IRA with fewer potential headaches.
The fund was launched in 2009. So it was able to ride up the initial bull market in the energy space – and really the entire market overall rebounding from the 2008/09 GFC. That being said, it never really was ever too large of a fund. At just around $132 million in AUM today, it can be harder for larger investors to take large positions as liquidity is lower.
Some of these assets are thanks to the fairly moderate amounts of leverage employed by the fund. Despite the moderate amount of leverage, leverage still adds additional risks that investors should consider. Additionally, during an interest rate hiking cycle, the borrowings leverage expenses are expected to rise. That’s because the borrowings are based on 1-month LIBOR plus 1.10%.
The fund’s expense ratio is 1.65%. This could be seen as fairly high relative to other CEFs. However, it seems that energy funds tend to run higher expense ratios. When including leverage expense, the expense ratio comes to 2.47%.
Performance – Attractive Discount
To compare the fund’s performance over the years, we can use a couple of other Tortoise funds for comparisons. There is Tortoise Energy Infrastructure Corp (TYG), which changed in 2020 to include more renewable exposure. However, it still remains largely an equity fund. We can also use Tortoise Pipeline & Energy Fund (TTP) to compare how TPZ performed with its allocation to fixed income. Worth noting is that TYG isn’t structured as a regulated investment company. Instead, it is a C-Corp structure.
TYG is also Tortoise’s oldest closed-end fund, at least in existence today from what I can see. TPZ is the second oldest, and TTP launched in 2011. TYG and TTP also underwent reverse splits in 2020. TPZ has avoided that.
Over the last decade, we can see that TPZ has come out on top. Really, it was the only fund of these three that produced positive results at all in this period. This helps highlight how poorly energy funds had been performing for most of the past decade.
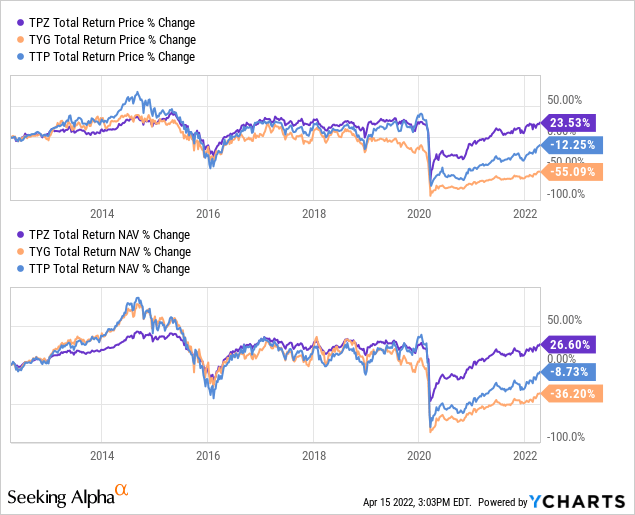
Ycharts
To see a different perspective, we can track to see how the funds did during the March 2020 sell-off. The dates below reflect performance from February 19th, 2020, to March 23rd, 2020. Again here, we see basically what we would expect. TPZ is once again coming out on top in both total share price, and NAV returns.
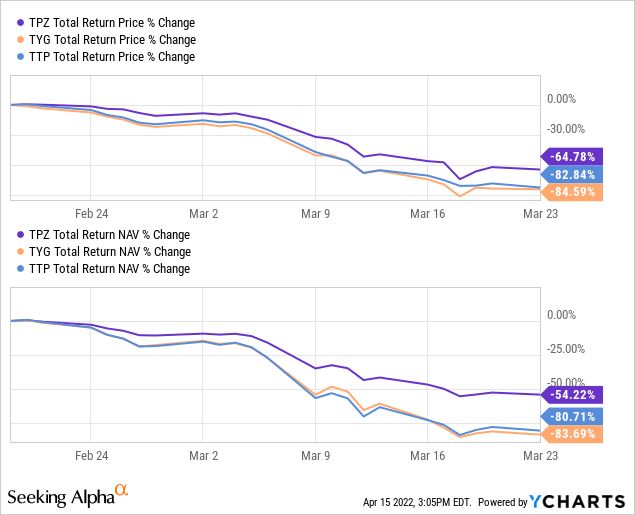
Ycharts
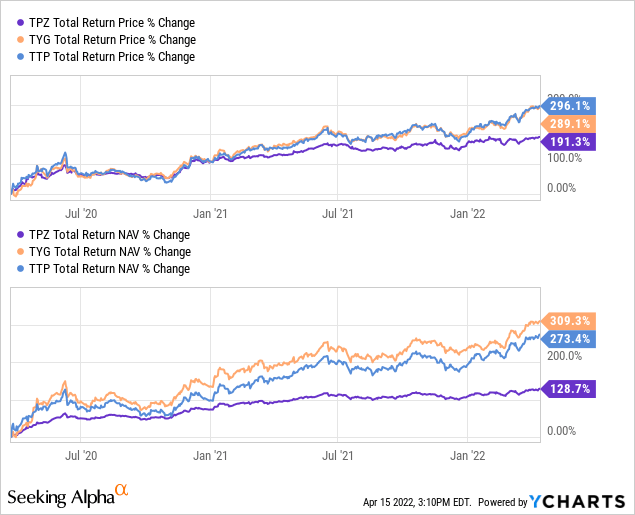
Now, one final chart comparing this trio. This would be from March 23rd, 2020, to today (April 15th, 2022). Keep in mind that TYG had transitioned into a more flexible fund and isn’t a pure-play fossil fuel energy play anymore.
Ycharts
This is where we see TPZ hasn’t kept pace with these two. Although, as we highlighted, it held up relatively well during the sell-offs – and it even provided some positive returns in the last decade instead of losses.
What makes TPZ attractive at this time is the funds discount. TYG and TTP certainly are attractive in this regard, too, in my opinion. For TPZ, the fund is still trading below its decade-long average discount.
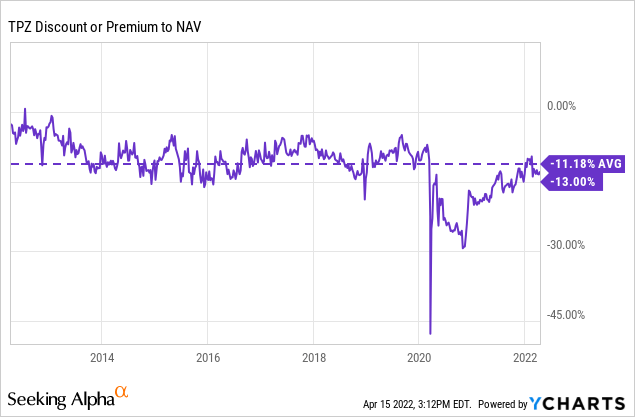
Ycharts
Distribution – Appealing 8.68% Yield
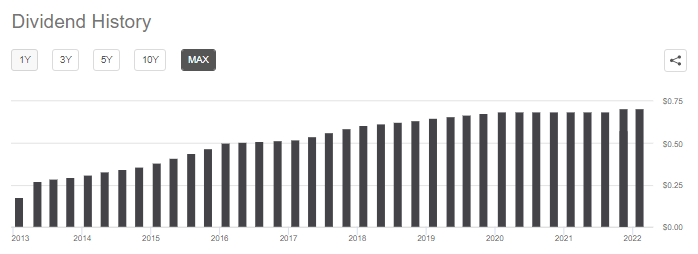
Thanks to the more conservative nature of the fund, it was able to hold onto its distribution level until the bitter end. Ultimately, having to cut in 2020 but had been fairly consistent previously. The only time it was adjusted before this was around 2014 to 2016. It received a small bump, but was then subsequently reduced back down to the prior level.
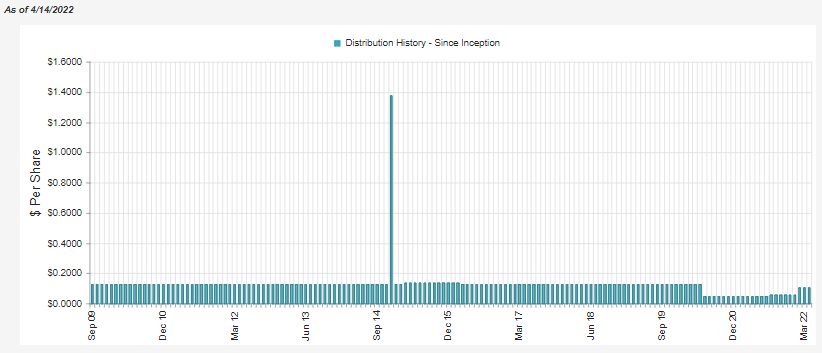
TPZ Distribution History (CEFConnect)
The fund has recently been bumping the payout back up to shareholders. The latest $0.105 announced for the month works out to a distribution yield of 8.68%. On a NAV basis, it works out to 7.55%. A lot of energy funds were cutting during 2020, but in my opinion, Tortoise has been the most aggressive in boosting the payout back up. In the end, it might not recover its previous highs as it pays out most of its earnings. However, that’s exactly what CEFs are designed to do – to provide significant ‘income’ by paying out their gains and income to shareholders.
In terms of the distribution coverage, the fund’s net investment income comes in quite light. Especially considering it is a fund with a meaningful sleeve of fixed-income investments.
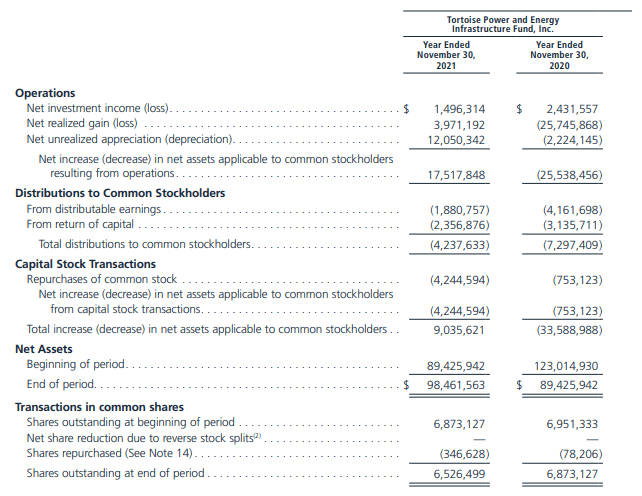
TPZ Annual Report (Tortoise)
However, this is where some investors could get tripped up because they would see this, and the analysis would end there. Since it still holds a sizeable allocation to MLPs, there is a meaningful amount of “less return of capital on distributions” that we need to add back in to figure out the net distributable income level.
That comes to $3,476,864 for the fund’s prior 2021 fiscal year. Throwing that in with the fund’s NII, we come to $4,937,178. With that being the case, we see that coverage comes to 117% of the ‘income’ generated from the underlying holdings. That doesn’t count any capital appreciation potential the fund might have in the positions, either.
For tax purposes, the fund’s largest characterization was nondividend distributions (return of capital). This was followed by total ordinary dividends and then some qualified dividends. That puts this fund a bit on the fence in terms of if an investor wants to include it in a taxable or tax-sheltered account. The fund regularly generates ROC distributions due to its underlying MLP holdings. However, this can vary significantly from year to year. It also pays out a meaningful amount of ordinary income due to interest received from the fixed-income investments.
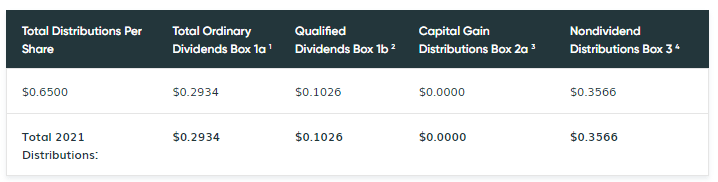
TPZ Tax Classifications (Tortoise)
TPZ’s Portfolio
Besides the more defensive nature of the fixed-income sleeve of the portfolio, one other area that keeps TPZ a bit more conservative is the higher allocation to natural gas infrastructure. Though crude oil seems to get all the headlines and moves the energy market, natural gas managed to stay in positive territory through 2020.
Natural gas has also been noted as the bridge fuel until renewable energy is sustainable. Thus, we should see demand for natural gas stay relatively stronger for longer. At least, demand shouldn’t fall as much as for oil. The chart below is from the IEA. It predicts demand for oil, natural gas and coal going out to 2050 based on several scenarios.
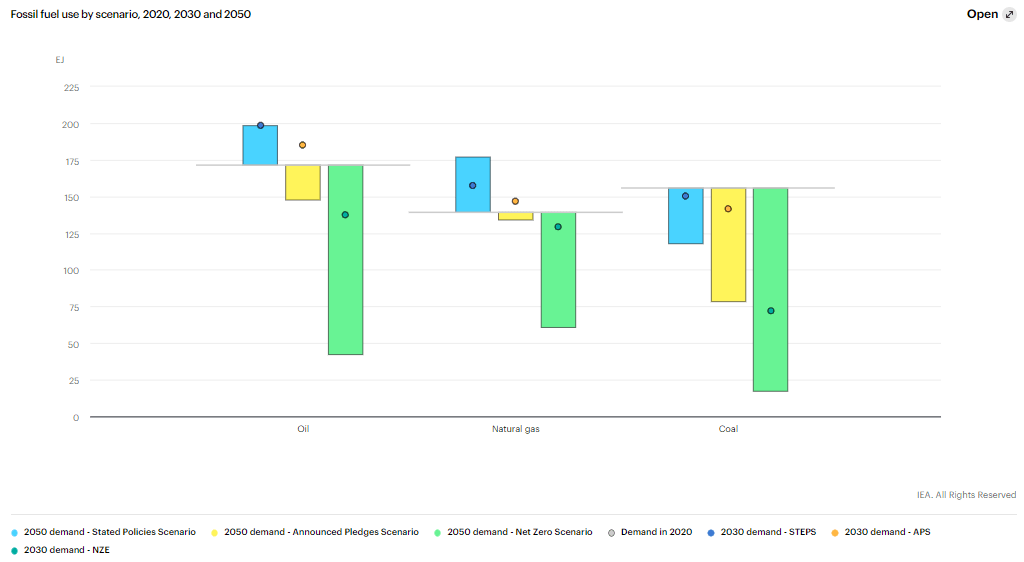
Energy Demand 2050 Projections (IEA)
Of course, the truly hardcore ESG folks out there (no offense) say it shouldn’t be referred to as such. So that topic is definitely up for debate.
All of this is relevant because 69% of TPZ’s portfolio is allocated to natural gas infrastructure. We also see that TPZ holds a small allocation to renewables and power infrastructure. So this fund isn’t necessarily locked in to invest in only fossil fuel investments.
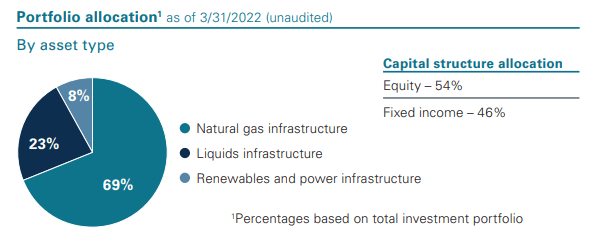
TPZ Portfolio Allocation (Tortoise)
We can also see that equity is around 54% of the fund, and fixed income fills in the other 46%.
Taking a look at the fund’s top ten holdings as of March 31st, 2022, gives us an indication that the fund holds a rather small number of holdings overall. The top ten account for just over 43% of the entire portfolio. This is reinforced by the number of holdings listed on CEFConnect as coming in at 50. While I don’t generally use CEFConnect for portfolio characteristics, as they are often wrong, this still gives us a general idea.
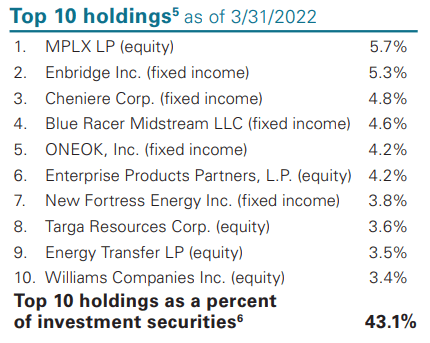
TPZ Top Ten (Tortoise)
A full list of their holdings is also available. In that list, it provides us with a bit more detail on the fixed-income positions. More specifically, the coupon rate and maturity dates. The Enbridge (ENB) holding, for example, is a 5.5% yield that matures on July 15th, 2077. With that information alone, we can do some searching and find some further details.
MPLX (MPLX) comes in as the largest position. We just touched on MPLX with our very recent update on Cushing NextGen Infrastructure Income Fund (SZC). Indeed, MPLX is a popular name amongst the energy/infrastructure funds. MPLX is a name that had survived through 2020 without having to trim its distribution. In fact, it had continued to raise the payout more recently once again.
MPLX Distribution History (Seeking Alpha)
Of course, the biggest reason to invest in MPLX is probably for the higher yield. At the current price, it works out to an 8.19% yield for investors.
Conclusion
I believe that TPZ could be a great fit for some investors. While the fund is still going to be quite volatile due to the energy exposure overall, it could be considered more conservative due to the fixed-income exposure the fund carries. This is a rather unique approach in the CEF space from the energy funds. They are primarily invested mostly in equity positions otherwise. The fund’s discount is quite attractive at this time, along with the attractive distribution yield that is well covered.
Be the first to comment