

pandemin
Investment thesis
TotalEnergies (NYSE:TTE) is placed well ahead of its competitors to be one of the leading players in the energy transition. Its very conservative capital allocation and prudent cash disbursement will shield its balance sheet and compensate possible adverse geopolitical and recession risks that could impact the price of oil and gas. We see a clear gap between the price and the value of TotalEnergies’ stock from several perspectives, including peers, historical, fundamental and quality. We see a great BUY opportunity for investors before Mr. Market closes the gap, with an Intrinsic Value between €123 and $99 (74% to 119% of potential upside).
Business description
Business model
TotalEnergies is a global energy company that produces and markets fuels, natural gas and electricity. It operates via three main business segments: Integrated Gas, Renewables & Power (iGRP), Exploration & Production (E&P), Downstream, which includes Refining & Chemicals and Marketing & Services.
The iGRP segment, encompassing integrated gas (including upstream and midstream LNG) and low carbon electricity businesses, accounts for approx. 10% of total revenues. The Exploration & Production segment brings in nearly 20% of revenues whereas the Downstream collects nearly 70% of total revenues. In particular, the Refining & Chemicals comprises the activities of refining, petrochemicals and specialty chemicals, and includes other activities such as oil supply, trading and marine shipping, whereas the Marketing & Services segment includes global activity of petroleum products supply and marketing.
The company, based in France, derives more than 40% of its total revenues from Europe and the remaining 60% mainly from US, Canada and Australia.
Strategy
TotalEnergies aims at moving towards an environmentally sustainable business model and transition itself towards new forms of energy. The ambition is to achieve the net zero by 2050, with considerable reduction in all three scopes of emissions. In particular, Scope 1 and 2 emissions are those generated directly by the company’s operations, such as, for instance, production of oil, gas, electricity storage, etc. as well as company’s transformation, like refining, liquefaction, etc. Scope 3 emissions, on the contrary, are those generated by the customers of the company when using its products. In details, TotalEnergies’ strategy is articulated across three main pillars: i) adapt the refining capacities and sales by focusing on the highest ROI oil projects and increase the production of renewable fuels; ii) expand in the production of renewables gases (like biogas and low carbon hydrogen) to favour the energy transition; iii) become the world leader in the electricity market by increasing the investment in renewables and by developing an integrated model.
TotalEnergies 2022 Strategy and Outlook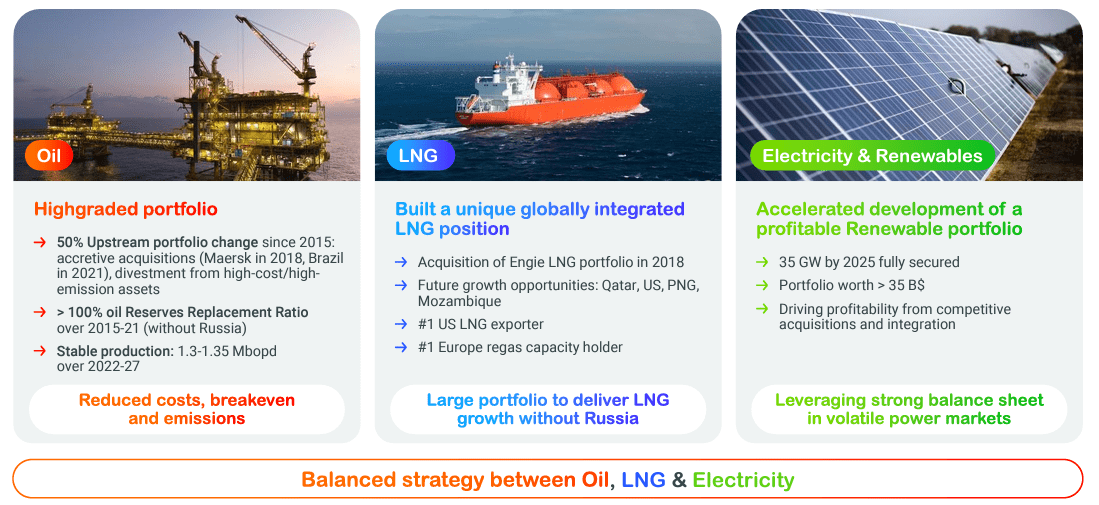
In May 2022, TotalEnergies managed to increase its US renewables portfolio by 25GW thanks to the acquisition of 50% stake in Clearway Energy Group (CEG) (TotalEnergies to buy 50% stake in Clearway Energy for $1.6bn) for $1.6billion.In particular, CEG’s listed and operational subsidiary, Clearway Energy (CWEN), holds approximately 5,000 MW of wind and solar generation projects and nearly 2,500 MW of natural gas generation facilities.
Market outlook
Heightened risk of recession and central banks’ tightening cycle may reduce aggregate spending and economic activity, leading to weaker oil and refined-product consumption, thus being detrimental for oil prices. Against this background, we do think that, at aggregate level, the lack of structural investment in oil and gas exploration is expected to counterbalance the abovementioned factors and keep the market in a supply deficit.
The already limited spare capacity in the oil market has been further impaired by the pandemic. Rystad Energy, in fact, estimated the need for nearly
[…] $100billion a year of additional investment to balance the markets, rebuild the spare capacity and offset the natural decline (approx. 4%/y).
Rystad Energy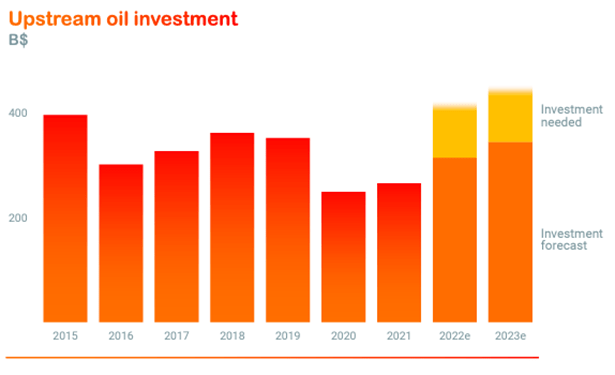
Moreover, the Russia-Ukraine war and the resulting European energy crisis is further underscoring the role of natural gas as a key transition fuel. In this respect, the increasing LNG demand in Europe and the resulting market imbalances are set to continue to drive LNG price to new highs.
TotalEnergies 2022 Strategy and Outlook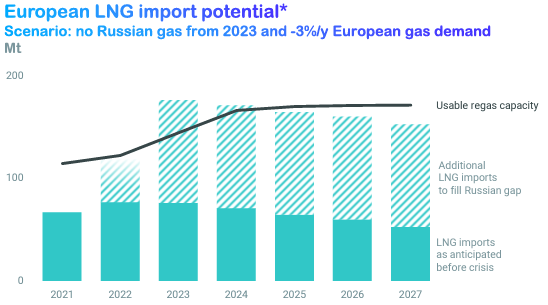
Solar and wind power energy sources are boosting the power market globally, with Europe and USA accounting for nearly 40% of solar and wind capacity growth. According to IEA, compared to a total investment of $700billion a year in renewable power and electric network at present day, approximately $1,500billion are needed from 2023 onwards in order to achieve the committed carbon neutrality.
IEA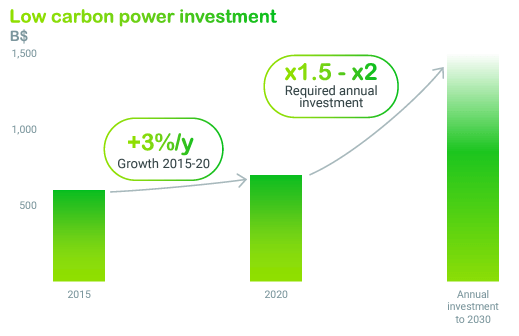
The COVID-19 crisis and the oil collapse forced big energy companies to reshape their capital-allocation frameworks, with capital spending offering the greatest leverage to manage cash. TotalEnergies has been very disciplined in the capital allocation compared to its peers, with the management that has privileged value over volume growth and applied stringent investment criteria for project approvals. As a result, in 2020, the company cut annual capex by 30%, and it is expected to keep them flat or up slightly in the upcoming years ($14-18billion/year), favouring growing LNG demand, energy transition businesses and carbon reduction programs.
TotalEnergies 2022 Strategy and Outlook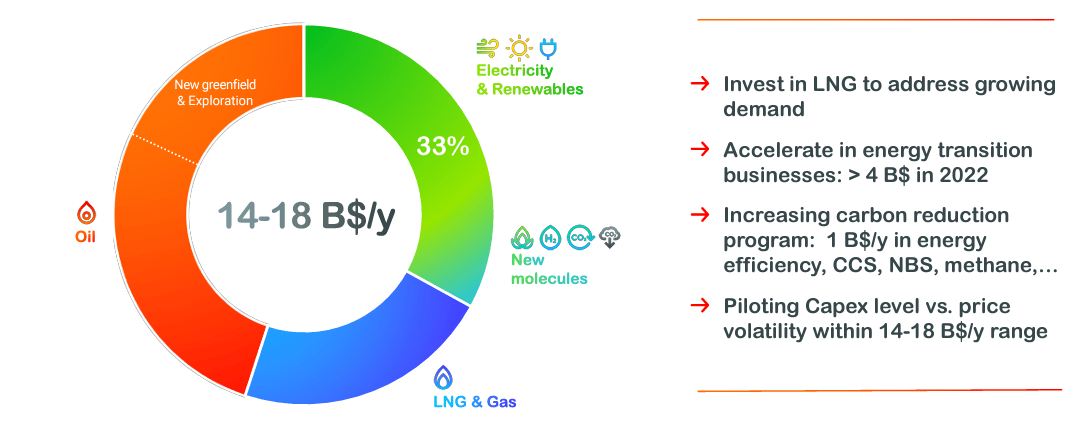
Financial analysis
Profitability
In 3Q2022 TotalEnergies confirmed its record high adjusted earnings, featuring a strong delivery across all business segments, but with the integrated gas outperforming the others thanks to the extreme volatility in the prices of that period. The company reported a net income of $6.6bilion, including $3.1billion impairment on Russia operations.
During the company’s financial results presentation, the CEO Patrick Pouyanné further detailed the figures:
The iGRP segment reported record adjusted net operating income of $3.6billion this quarter, up $1.1billion form the second quarter, and cash flow of $2.7billion, driven by an average LNG selling price up more than 50% compared to the previous quarter and by the strong performance of its trading activities. The Company continue to implement its growth strategy by taking a stake in the North Field South LNG project in Qatar. In Electricity & Renewables, TotalEnergies completed the acquisition of 50% of the Clearway Energy Group in the United States and announced a significant acquisition in Brazil.
Exploration & Production posted adjusted net operating inc0ome of $4.2billion and cashflow of $6.4billion, despite a decrease in production this quarter, mainly due to unplanned shutdowns at Kashagan. TotalEnergies started production at the Ikike filed in Nigeria, launched the Begonia project in Angola and the Fenix project in Argentine, and announced a significant gas discovery in Cyprus.
Downstream benefited from strong distillate margins, generating an outstanding adjusted net operating income of $2.4billion and a cash flow of $2.9billion.
In this favourable environment, taking into account income and production taxes of $26billion worldwide, the Company is implementing a balanced value-sharing policy with an exceptional one-month salary bonus for the 21022 financial year in the amount of €0.69/share, equal to the first and second 2022 interim dividends and an increase of 5% form the interim and the final dividends paid for the 2021 financial year, and set the ex-dividend and payment dates for the interim special dividend of €1/share in December 2022.
GuruFocus GuruFocus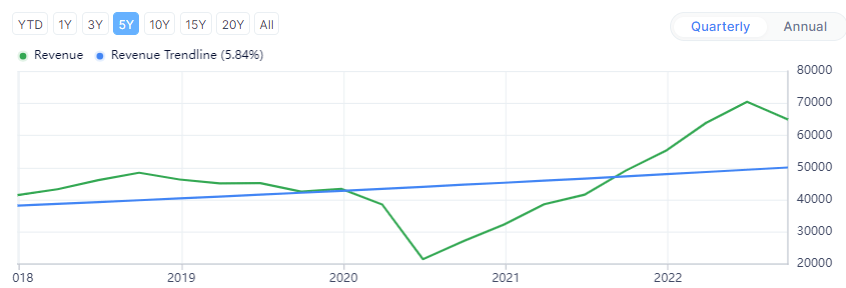
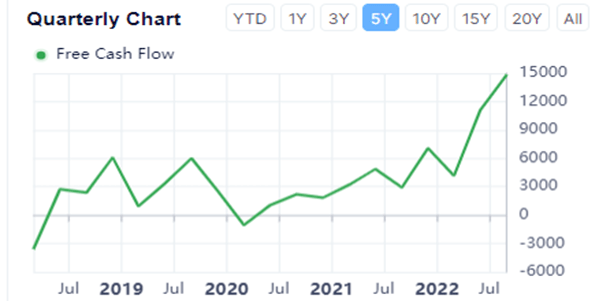
In details, TotalEnergies printed Total Revenues of $64.96billion (+32.39% YoY) while year-to-date FCF were equal to $38 billion (+80% YoY). Cash from Operations stands at $53.4billion. In terms of FCF margin, it is equal to 11.9% while the sector median stands at 6.6%, whereas the Return on Total Capital is equal to 16.9% compared to a sector median of 8.2%. These figures, in our view, witness how TotalEnergies’ continuous growth and operations efficiency are going to be an important competitive advantage, with respect to the other majors, and place the company ahead of the group in the energy transition race.
Seeking Alpha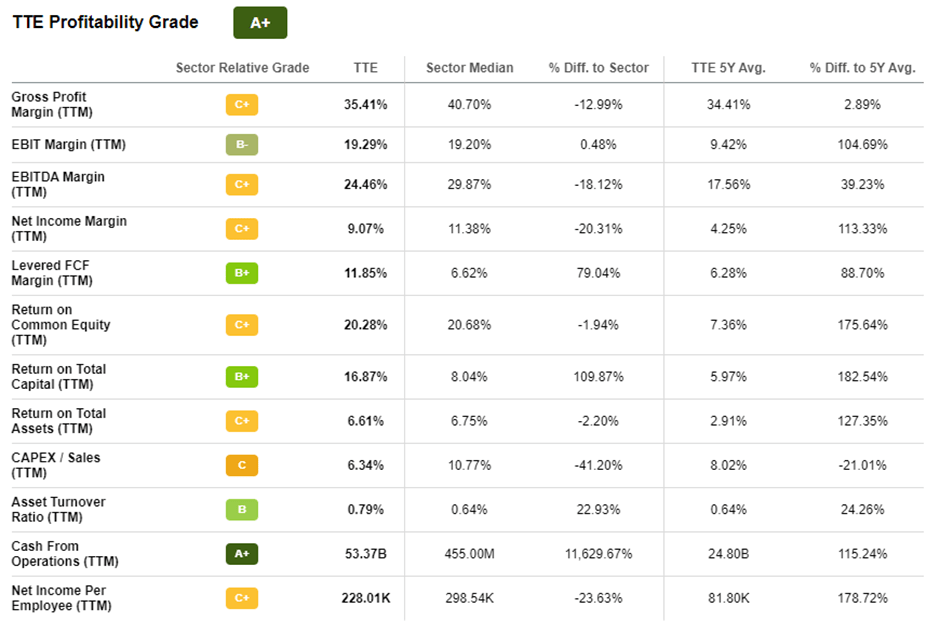
Financial strength
The prudent balance sheet steering of the management has allowed the company to wheatear the pandemic thanks to a historic high cash generation which has achieved a net debt equal to zero.
DGP Capital Management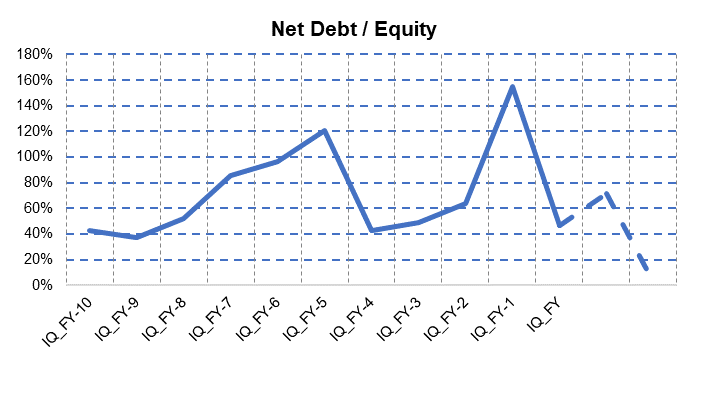
Furthermore, TotalEnergies’ operating cash flow is surging to a record high on the back of supportive commodity prices and yielding a strong financial framework, facilitating higher spending and the extension of its relatively modest buyback pace. The management guided a cash allocation strategy entailing a 35%-40% cash payout, with a considerable acceleration in shareholder returns via record buybacks and dividends (TotalEnergies was the only European major not to cut its dividend during the pandemic and the first one to pay a dividend higher than pre-pandemic levels).
TotalEnergies 2022 Strategy and Outlook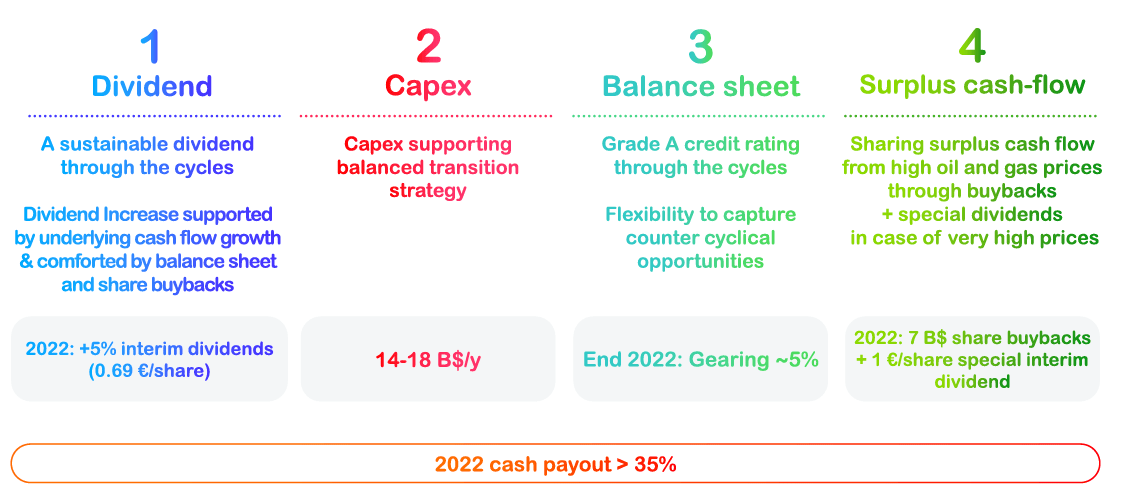
Stock performance
The surge in oil and gas prices drove energy companies to outperform major indexes and gain market share in the S&P500.
Seeking Alpha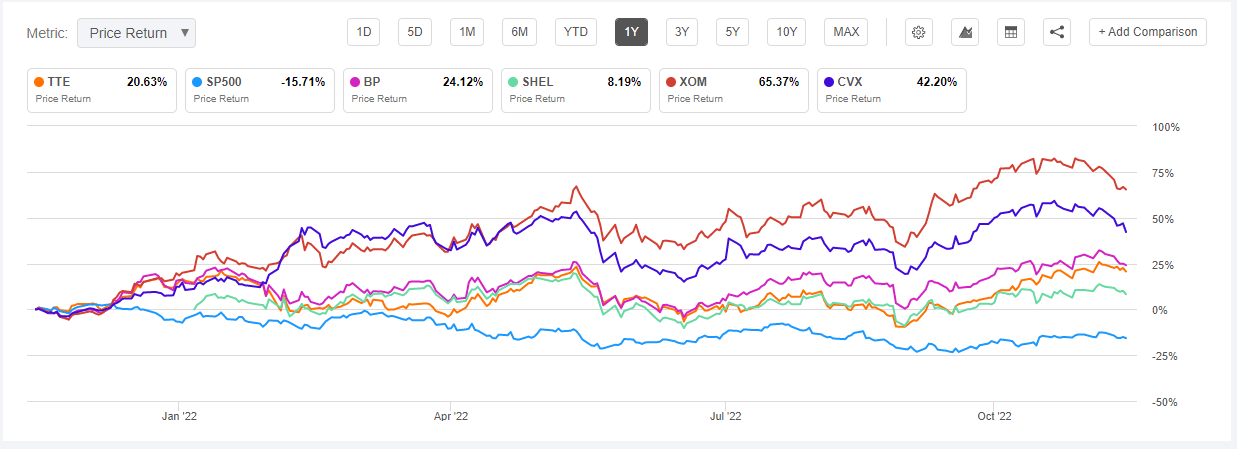
US majors have so far outperformed their European peers in our view thanks to more resilient structural investments, less government intervention and stable cash distributions.
Winds of recession and inflations spikes may weigh in 2023 on commodity prices and oil majors’ earnings and we do believe that prudent balance sheet steering coupled with wise debt-reduction are going to be the key successful factors to insulate earnings and CFFO.
TotalEnergies also offers the highest dividend yield (4.8%) among its peers, with a historically high Dividend Coverage Ratio (3.7x) and FCF/Dividend (1.8x).
Seeking Alpha
Valuation
Let’s start by looking at the multiples, in particular, for the energy sector, we prefer to use EV/EBITDA and P/FCF.
With respect to the former, the gap between European and US majors’ valuations has widened in 2022: Chevron currently trades at 5x 2023 Ebitda, a slight premium to Exxon Mobil (4.2x) and ConocoPhillips (4x), but a wide gulf to the Europeans, with TotalEnergies, BP and Shell, trading respectively at 2.5x, 3.8x and 3.5x 2023 Ebitda. Applying a median of 4.1x and a Margin of Safety of 25%, which is meant, as an overall windfall tax, to mirror the reduction of TotalEnergies’ investment in the North Sea, we get a price of €88/share (48% discount on 2022 EBITDA).
When looking at the second multiple (P/FCF), we can observe an even greater discount on TotalEnergies, which is trading at 3.9x 2023 FCF. Conversely, Chevron trades at 8.9x, Exxon Mobil at 7.4x, ConocoPhillips at 8x, BP at 4.1x and Shell at 7.4x. Applying a multiple of 7.1x and the same Margin of Safety (25%), we get a price of €104.7 (97% discount on 2022 FCF).
At a first sight, many might be inclined to conclude that such multiple gaps reflect the fact that European governments have been more active in creating withholding and solidarity taxes due to elevated profit (TotalEnergies to cut U.K. North Sea investment by 25% after windfall tax). On the contrary, our internal analyses show that, historically, those headwinds have never reached a magnitude to justify such a discount compared to the peers, as also highlighted in the above results that still include, for sake of prudence, a hefty Margin of Safety mirroring a very conservative tax assumption.
The deep discount at which TotalEnergies multiples are currently trading can also be grasped by looking at the historical evolution, since 2016, of the EV/EBITDA and P/FCF compared to the Brent oil price.
Bloomberg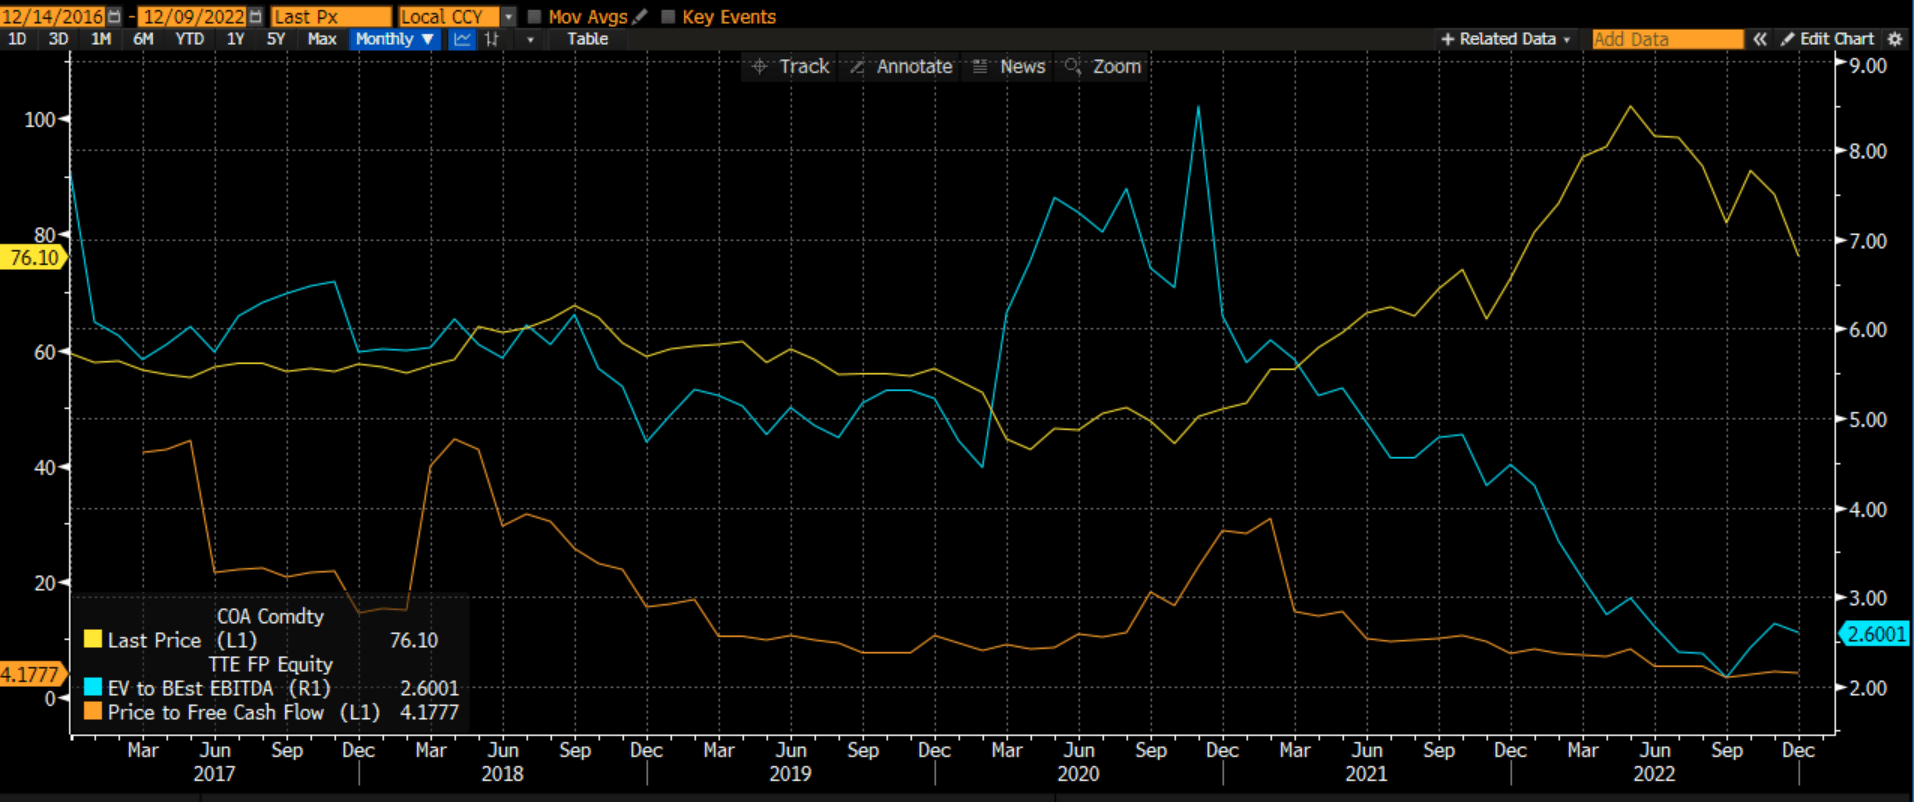
Let’s move now to the assessment of the Intrinsic Value of TotalEnergies.
At DGP Capital Management, we take quite a huge effort in analysing companies’ financial statements in order “to clean” them from possible accounting loopholes, which stem from accounting rules originally designed for debt investors, rather than equity ones, and are often “beautified” by companies to boost their earnings. Such exercise aims at focusing on the true economic results of companies and, in greater details, points at deriving i) the ROIC which is then compared to the WACC to understand if the company is able to generate values above its cost of capital; ii) the Economic EPS; and iii) the Economic FCF.
In particular the latter constitutes the basis for our calculation of the Intrinsic Value. With respect to the TotalEnergies, we used: as discount factor rate a WACC of 8.8%, as a terminal rate 1% and as a Margin of Safety 25% (for the reasons explained above). This results in an Intrinsic Value equal to €123, compared to €56.8 at which the TotalEnergies is currently trading (119% discount)
DGP Capital Management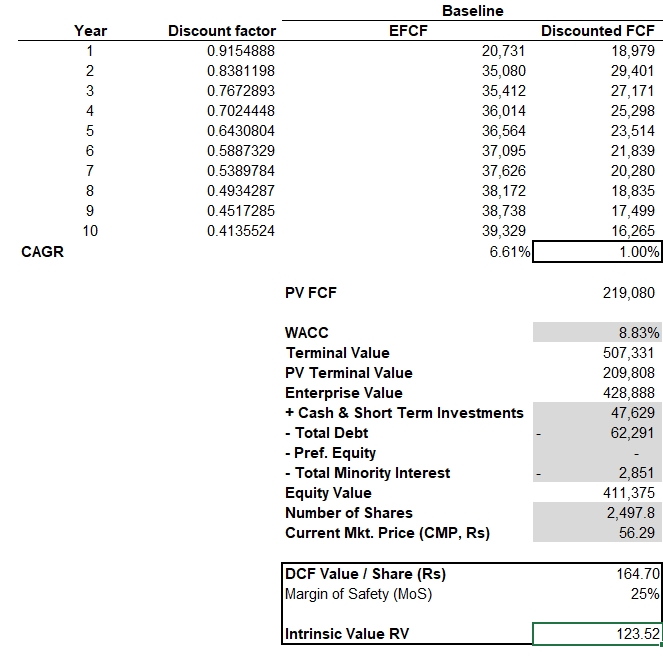
Investment risks
The business is highly competitive, influenced by geopolitical risks and macro events. Moreover, the transition to renewables forms of energy is set to heavily impact the more traditional business models in the sector which have not moved towards an environmentally sustainable for of business and switch to new forms of less intensive carbon footprint activities.
In this respect, we do believe that TotalEnergies is placed ahead of its competitors in terms of actual results to achieve the net-zero emission target. Furthermore, as also witnessed by the pandemic period, its very conservative capital allocation and prudent cash disbursement will shield its balance sheet and possibly provide some compensating effects to possible adverse geopolitical and recession risks that would seriously impact the price of oil and gas.
At DGP Capital Management, we adopt a value investing approach, cognisant of the fact that assessing the value of a company entails assessing its business model, its industry and its competitive environment to understand what a company is really worth. In doing so, we like to keep things simple (to the extent possible, ça va sans dire), as analyzing the company’s business for us means sticking to a “quality selection” process and studying its financial statements to have a guestimate of the earnings power and cash flows. We are not interested in getting the figure right “at the second digit after the comma”, as we think it is almost impossible to forecast how a stock will be priced in the short term as well as because we think that having a longer time horizon than Wall Street is THE competitive advantage.
The Margin of Safety that typically value investors apply is meant to account for faults in the analysis that either relates to the company’s quality or to its potential growth. However, there might be also exogenous tail events (many thanks Nassim Nicholas Taleb), linked to the macroeconomic and geopolitical factors that could severely alter the picture and therefore the “game” we decided to play as value investors. At DGP Capital Management, we always look to challenge our assumptions and projections and try to figure what can really go wrong (the so-called 3 sigma event, if you want). In this respect, the PV-10 is a non-GAAP measure, which the SEC requires to be published by every oil company, which considers the future cash flows, computed according to a specific methodology, discounted at 10%. Such discounted cash flows calculation can be used, coeteris paribus, to compare the value of the proven reserves held by companies in a gone concern scenario and therefore assumed to be an extreme stressed valuation in the analysis.
Let’s therefore assume that TotalEnergies is going to be in serious trouble and forced to shut down everything. The company will be left with anything but the proved reserves. According to the United States Securities & Exchange Commission (SEC) Rule 4-10 of Regulation S-X as amended by the SEC Modernization of Oil and Gas Reporting release
Proved reserves are estimated using geological and engineering data to determine with reasonable certainty whether the crude oil or natural gas in known reservoirs is economically producible under existing regulatory, economic and operating conditions.
With reference to the Form 20-F 2021 hydrocarbon proved reserves are equal to 12,062 Mboe, of which 5,050Mb of Oil and 7,012Mboe of Gas. The average Brent price in the past 10 year has been $77bbl while of Natural Gas has been nearly $6/MMBtu. TotalEnergies, as reported in the Form 20-F 2021, gives priority to oil projects with low technical costs and a low breakeven point, $30/bbl, which is the price we will use in this analysis for oil, whereas for Natural Gas we will use as a breakeven price $2.8/MMBtu as discussed by McKinsey (Global gas outlook to 2050). Putting all the pieces together, the hydrocarbon proved reserves of TotalEnergies are therefore worth nearly $237.4billions for oil (5.05Mb * [$77/bbl-$30bbl]) and $22.4billions for gas (7.01Mboe * [$6/MMBtu-$2.8/MMBtu]). Considering zero debt and 2.5billions of share outstanding, we end up with proved reserves which are worth $104/share or €99/share (74% discount).
Conclusion
In our view, TotalEnergies stock is a BUY given the very solid balance sheet, net zero debt and wise capital allocation which will position the company ahead of its competitors in the energy transition. Mr. Market is currently pricing at discount TotalEnergies both compared to its peers as well as to its historical multiples, which is offering value investors a great buy opportunity. In our analysis, we have shown from several perspectives, even in case an extreme tail event were to occur, the gap we perceive between the price and the value of TotalEnergies’ stock. The lack of structural investments in global exploration and development since 2015 will continue to support oil and gas price in the years to come as a result of supply imbalances which is too early to think that will be compensated by a growth in renewables sufficient to absorb all energy demand of the developed countries.
Be the first to comment