

zorazhuang
While the Tortoise Pipeline & Energy Fund (NYSE:TTP) may offer an attractive 8.5% distribution yield, the fund has poor long-term performance. It also has an expensive 3.66% total expense ratio. Investors interested in energy infrastructure should look at larger funds like the ALPS Alerian MLP ETF (AMLP) which provides a similar distribution yield, with better long-term historical returns and much better liquidity.
Fund Overview
The Tortoise Pipeline & Energy Fund is a closed-end fund (“CEF”) that invests primarily in North American pipeline and other energy infrastructure companies. This is a small fund with only $87 million in assets as of September 30, 2022.
Strategy
The TTP fund’s strategy is to invest in the equity securities of pipeline and other energy infrastructure companies. Pipeline companies engage in the transportation of natural gas, natural gas liquids (“NGLs”), crude oil, and other refined petroleum products. Energy infrastructure companies own and operate a network of assets that transport, store, distribute, gather, and process petroleum products. The fund may invest up to 25% of total assets in MLPs.
The TTP fund may employ covered call writing strategies to generate additional income, and may employ leverage to enhance returns.
Portfolio Holdings
Figure 1 shows TTP’s asset allocation as of September 30, 2022. 62% of the fund’s assets are invested in natural gas infrastructure assets, and 30% are invested in other liquids infrastructure.
Figure – TTP asset allocation (tortoiseecofin.com)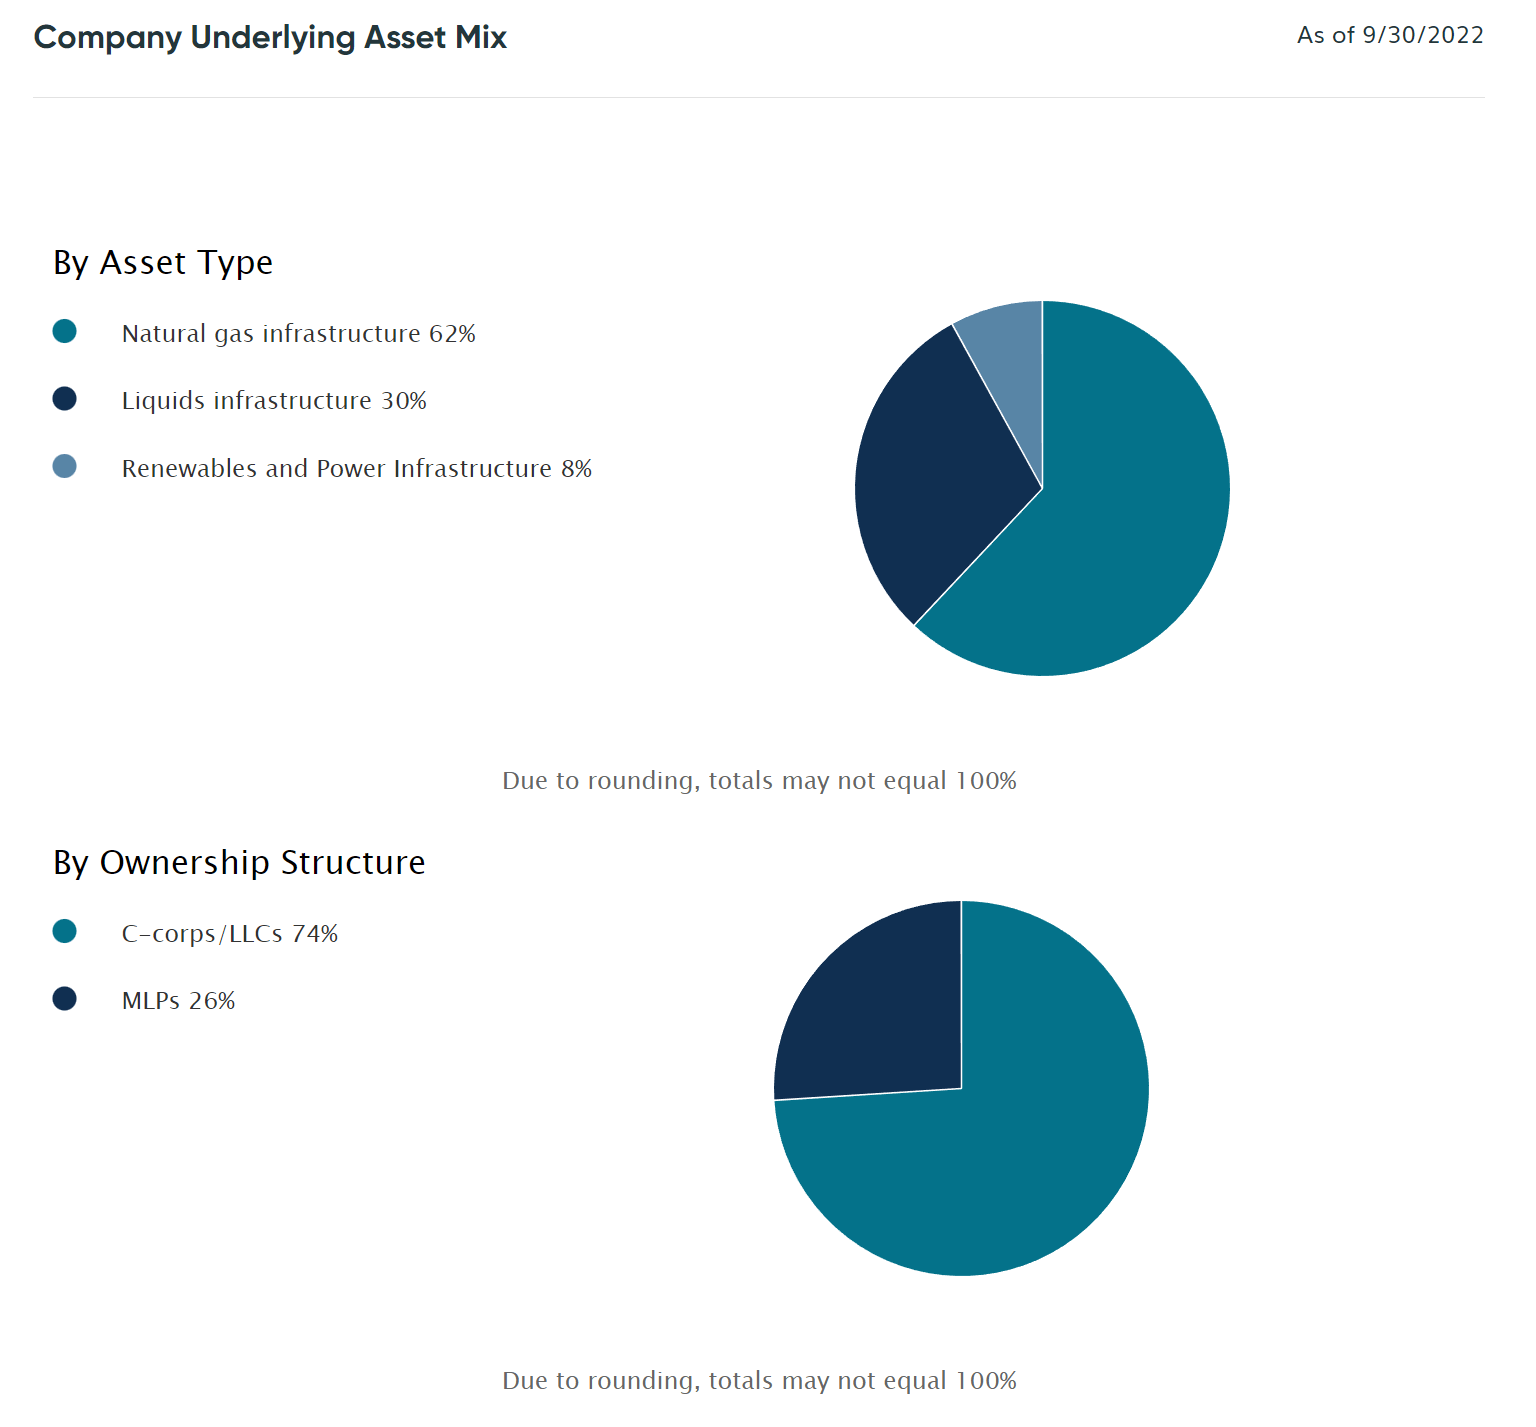
The fund’s top 10 holdings account for 66% of the fund’s assets (Figure 2).
Figure 2 – TTP top 10 positions (tortoiseecofin.com)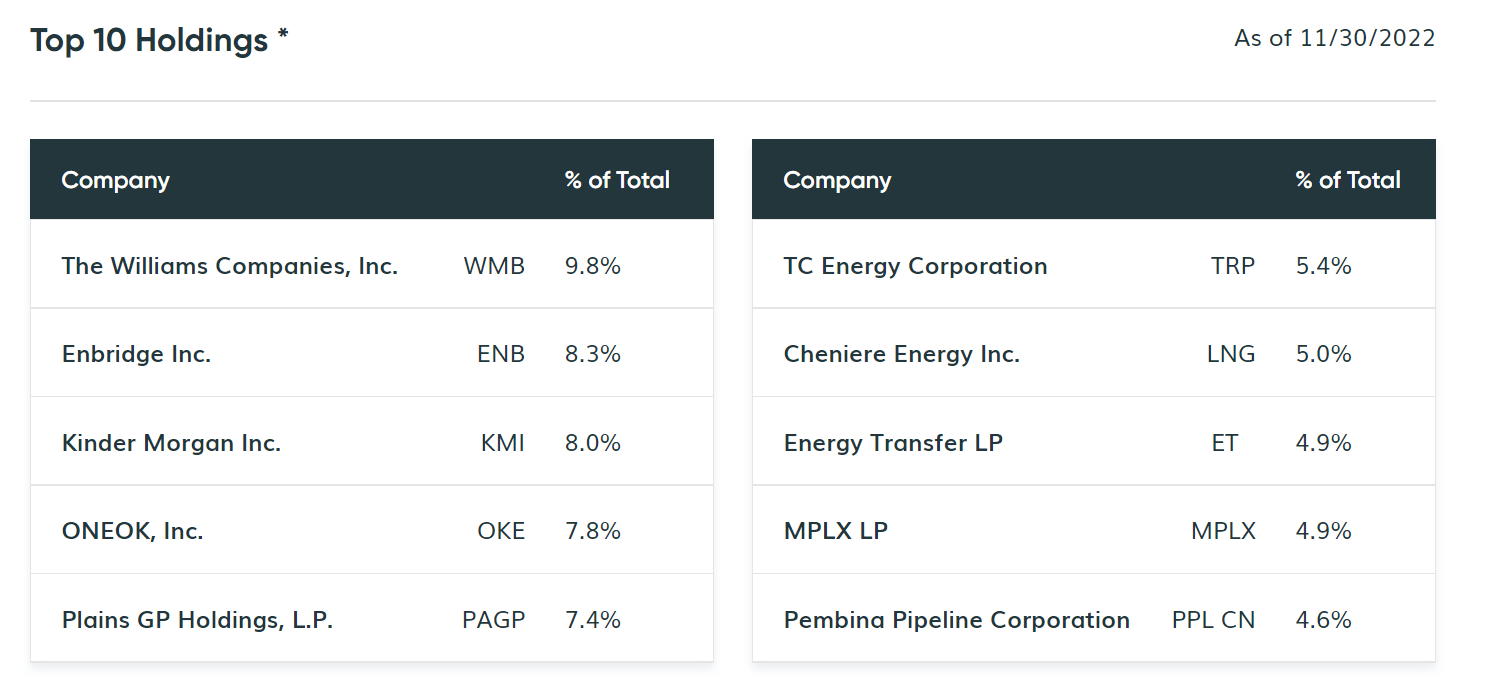
Returns
The TTP fund has delivered strong short-term performance on the back of energy’s outperformance in the past few years. YTD to November 30, 2022, the TTP fund has returned 33.2%. However, if we zoom out, TTP’s long-term performance has been poor, with 3/5/10Yr average annual returns of -7.9%/-8.5%/-3.9% respectively (Figure 3).
Figure 3 – TTP historical returns (tortoiseecofin.com)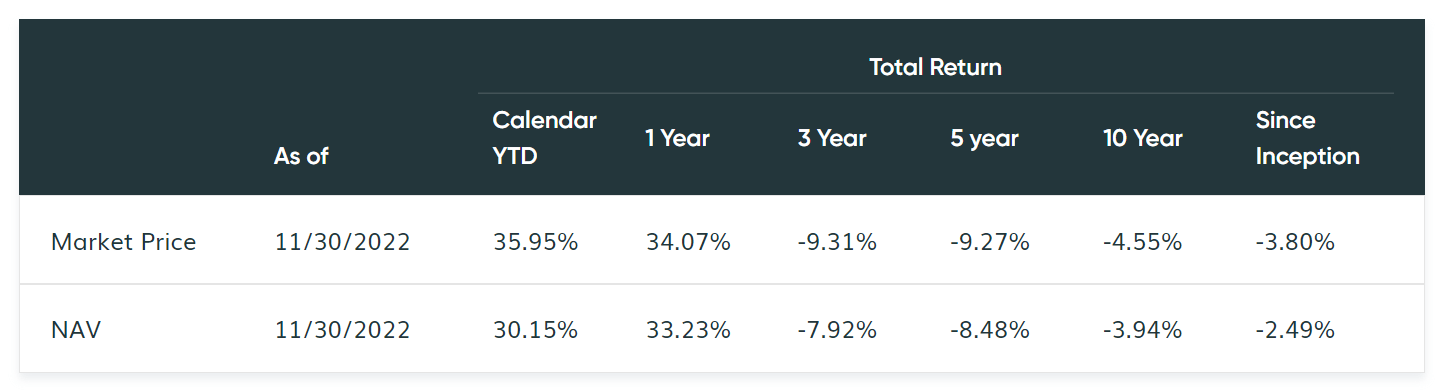
Distribution & Yield
The TTP fund pays an attractive $2.36 / share trailing 12-month distribution or 8.5% current yield. The fund’s distribution is paid quarterly.
TTP’s distribution has more than doubled in the past year, from $1.06 in 2021 to the current $2.36 level. However, the distribution rate is down dramatically from a few years ago (Figure 4).
Figure 4 – TTP historical distributions (Seeking Alpha)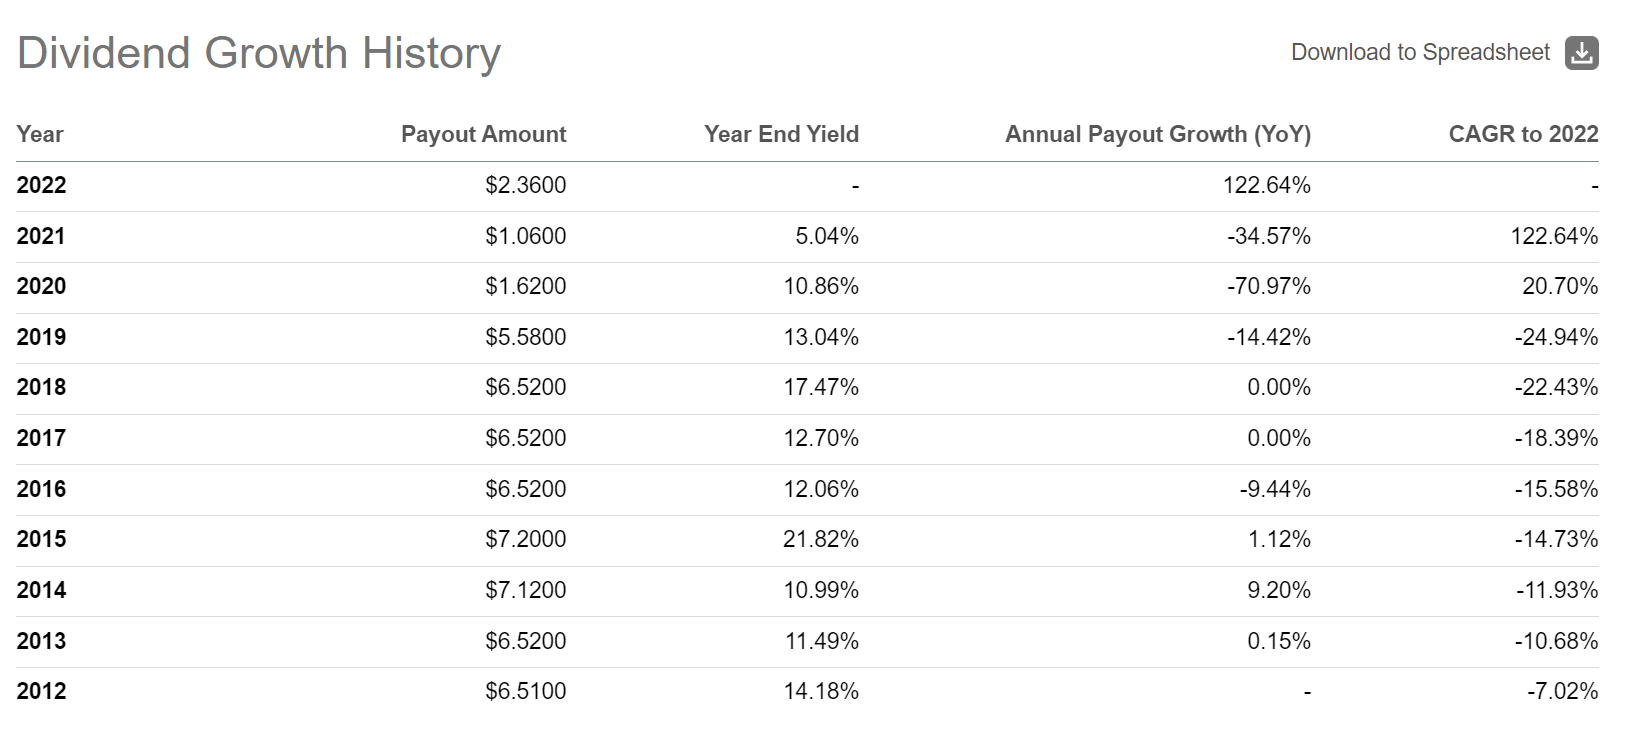
Looking at TTP’s latest Section 19a report, TTP’s distribution is 1/3 funded through realized capital gains, ~2/3 through return of capital, and minimally through net investment income (Figure 5).
Figure 5 – TTP’s YTD distribution source (TTP November 2022 Section 19 notice)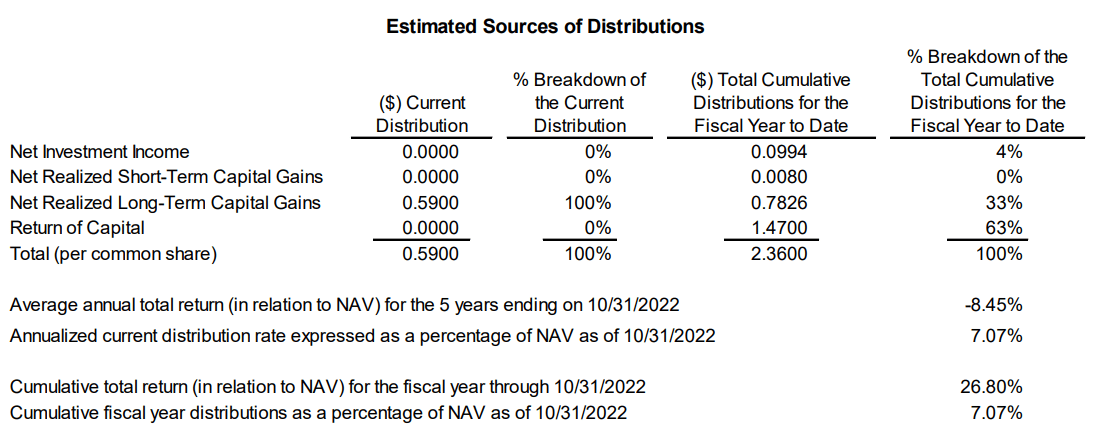
This result is puzzling, as many pipeline companies pay a large dividend. For example, TTP’s largest holding, The Williams Companies, Inc. (WMB), has a 5% forward dividend yield. Dividends received should count towards the fund’s net investment income.
Within the Fund’s prospectus, we see this disclosure: (author highlighted important passage)
We expect that the source of the cash payments we receive from our investments will constitute investment company taxable income, as well as long-term capital gains or return of capital from such investments. Investment company taxable income includes, among other items, dividends, operational income from MLPs, interest and net short-term capital gains, less expenses. Long-term capital gains reflect the realized market price received in the sale of an investment security in excess of its cost basis, less net capital losses, including any capital loss carryforwards. Since, as a RIC, we may invest up to 25% of our Total Assets in MLPs, a portion of distributions received from our investments may be sourced as return of capital. This may be due to a variety of factors, including that the MLP may have significant non-cash deductions, such as accelerated depreciation. However, since we may only invest up to 25% of our Total Assets in MLPs, our Adviser does not anticipate a significant portion of the Fund’s distributions to stockholders will be characterized as return of capital; rather, it expects the significant sources of such distributions to be investment company taxable income and net capital gain.
It is unclear why over 60% of the fund’s YTD distribution is sourced through return of capital. In fact, if we look historically, almost all of the fund’s distributions have been sourced from return of capital, contrary to what was stated in the prospectus (Figure 6).
Figure 6 – TTP historical financial highlights (TTP 2021 Annual report)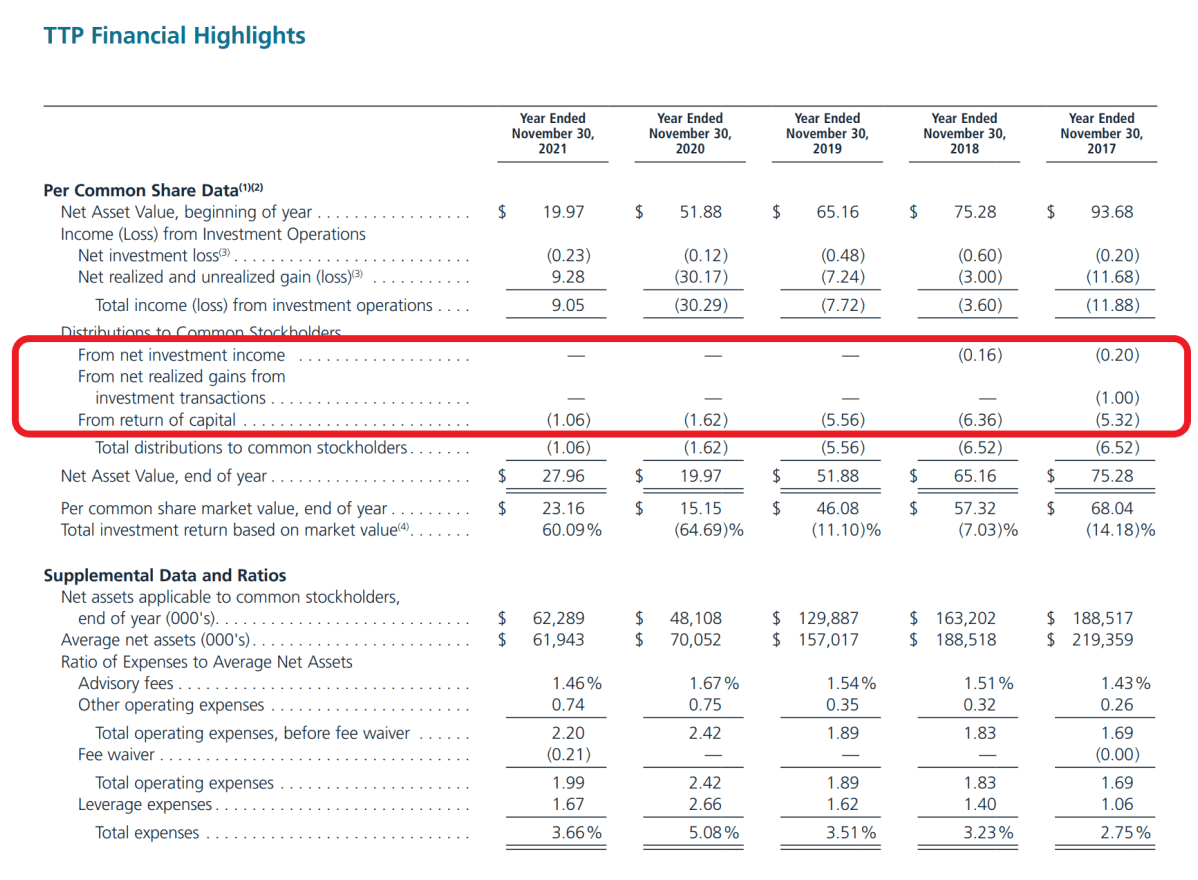
Investors are advised to consult a tax professional to clarify the tax status of TTP’s distributions.
Fees
Although the TTP fund charges a modest management fee of 1.1% of managed assets, this translates into a total expense ratio of 3.66% for Fiscal 2021 when we factor in leverage expenses and other operating expenses (Figure 6 above). Historically, total expenses were as high as 5.08% in 2020.
TTP vs. AMLP
With a 3.66% total expense ratio, TTP appears to be an expensive way to access the energy infrastructure asset class. An alternative may be the ALPS Alerian MLP ETF (“AMLP”) which pays a 7.7% trailing 12-month yield and only charges a 0.85% expense ratio.
Comparing between TTP and AMLP using Portfolio Visualizer, using the period November 2011 to November 2022, we can see the AMLP ETF is superior on most metrics. AMLP has a higher returns CAGR of 1.4% vs. -1.3% for TTP. As well, AMLP’s volatility is only 29.1%, vs. TTP’s 38.7% (Figure 7).
Figure 7 – TTP vs. AMLP (Author created using Portfolio Visualizer)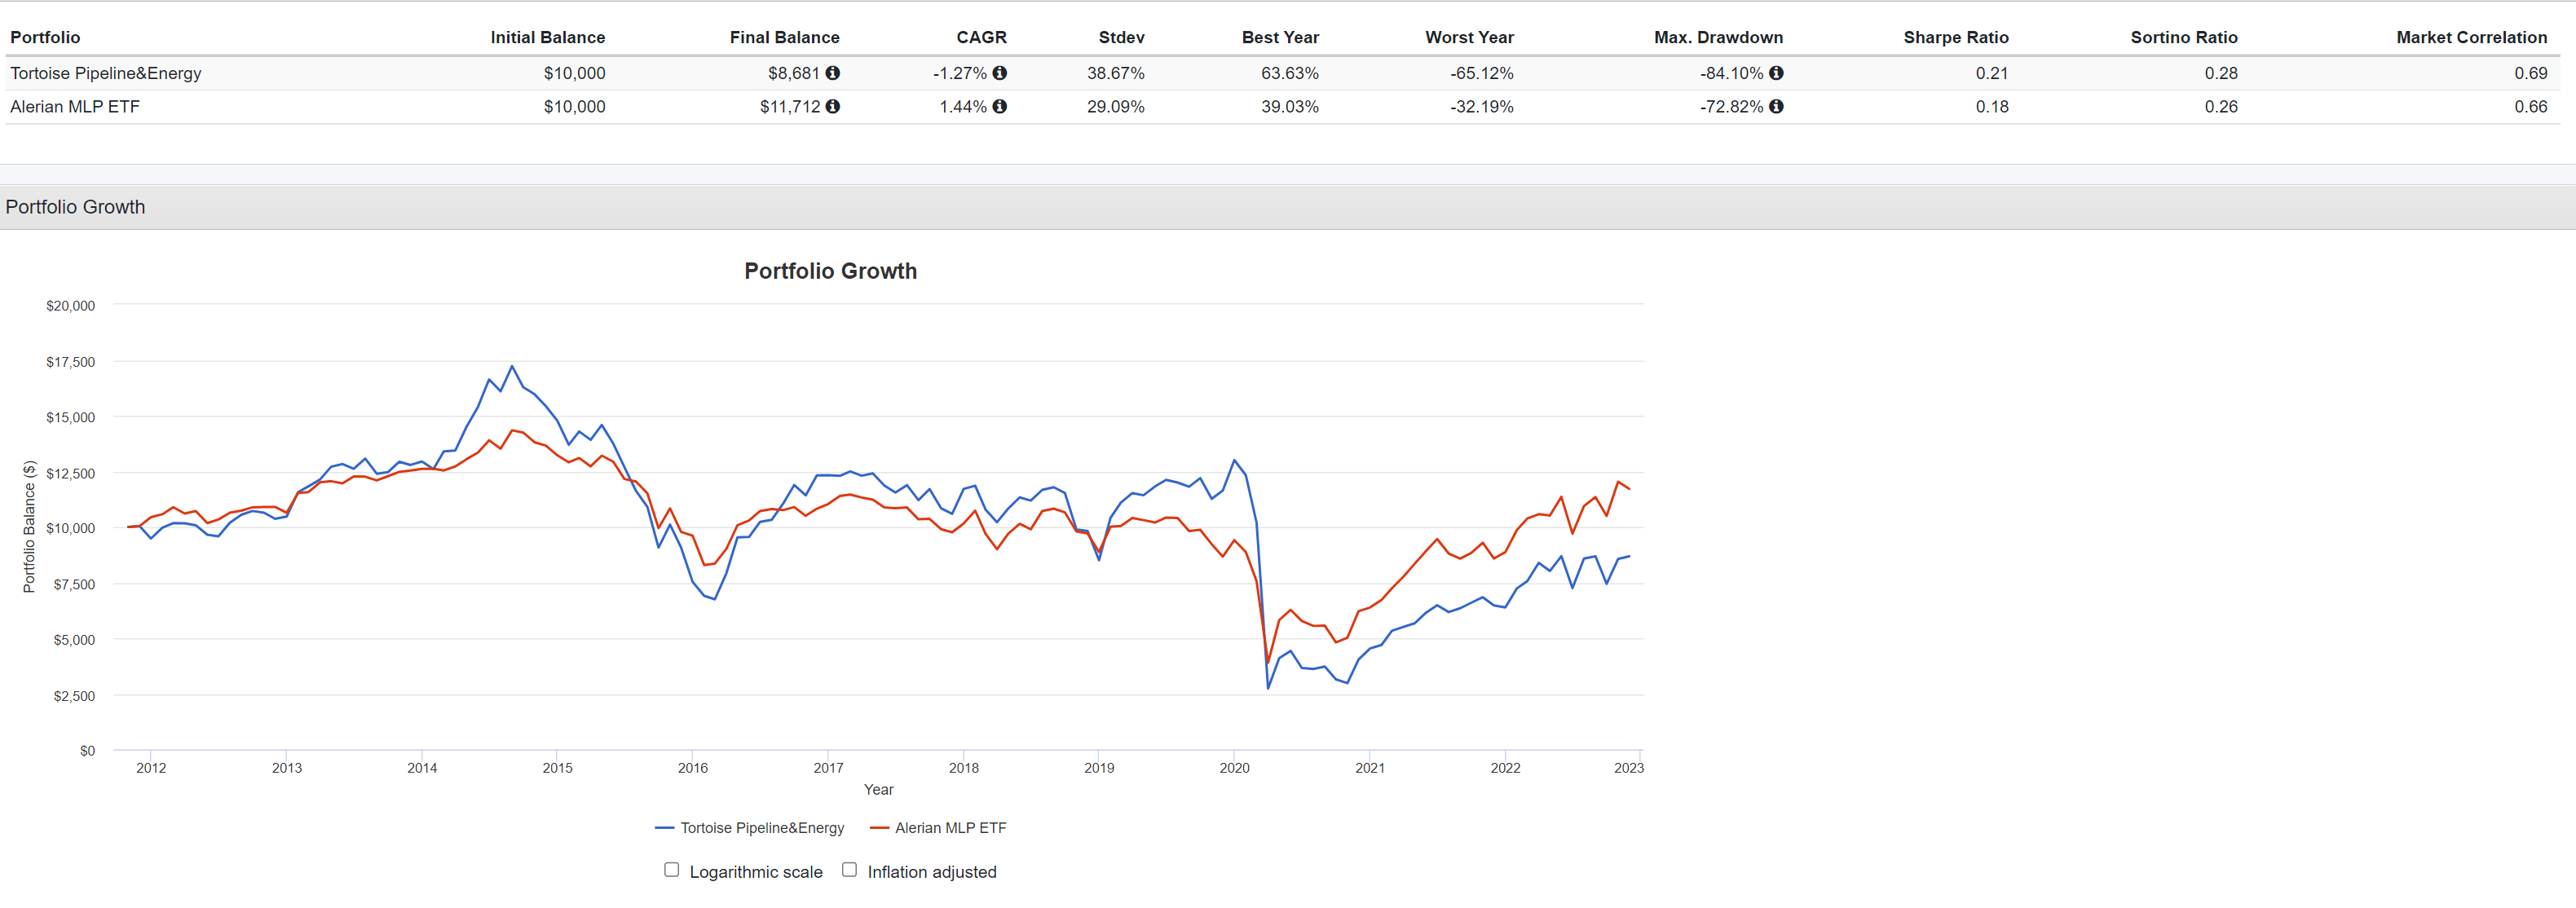
While TTP has superior short-term returns (TTP YTD returns of 33.2% to November 30, 2022 vs. 31.8% for AMLP), TTP trails far behind AMLP on longer-term return metrics (Figure 8).
Figure 8 – AMLP returns (morningstar.com)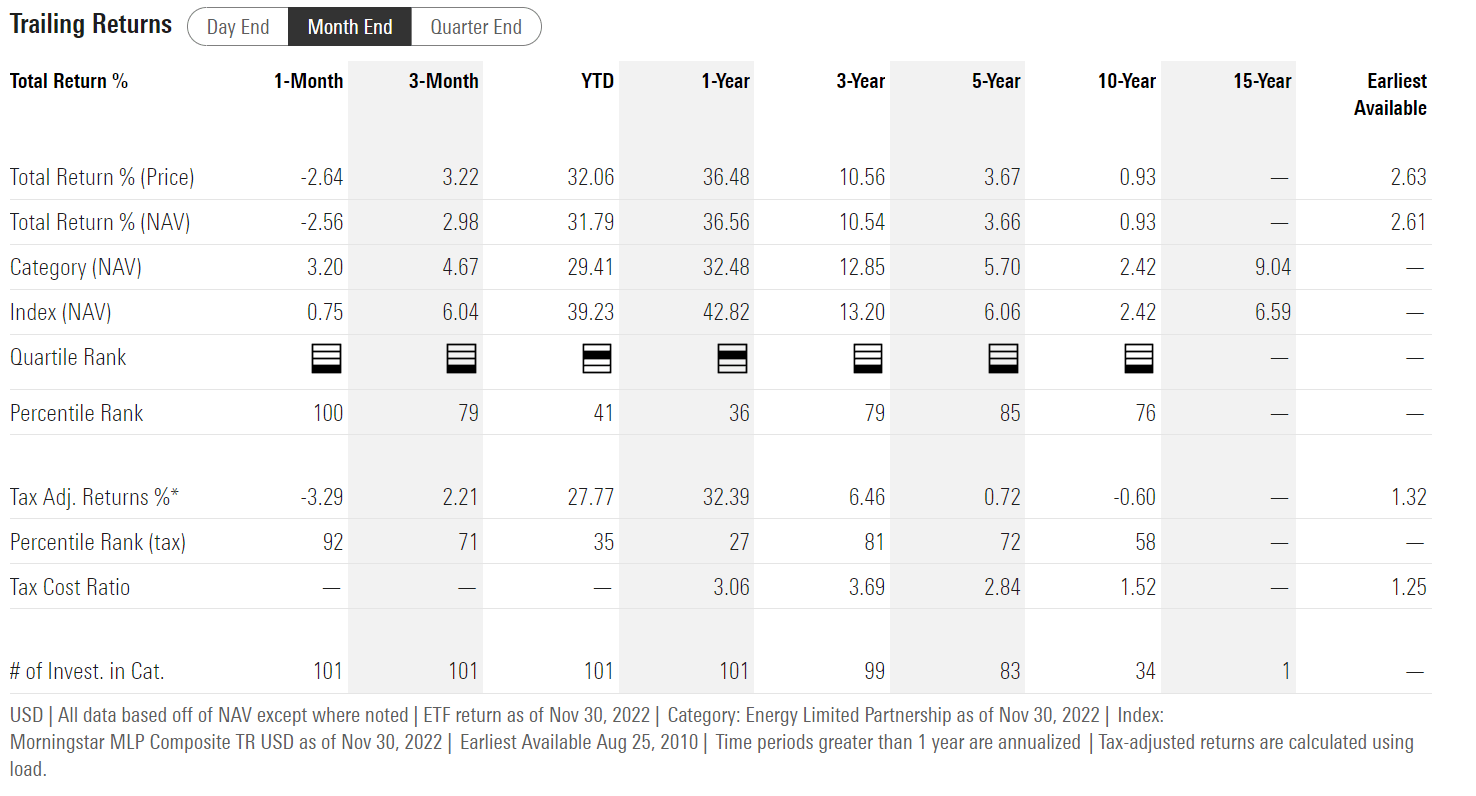
Finally, investors should be mindful of TTP’s small fund size, which negatively impacts the fund’s liquidity. The TTP fund only trades an average of 18,000 shares a day or ~$500k. It has a wide bid / ask spread of $0.50, or 1.8% of the last close (Figure 9).
Figure 9 – TTP is highly illiquid (nasdaq.com)
Contrast that with the AMLP, which trades 1.9 million shares per day or over $70 million dollars, with a penny bid/ask spread (Figure 10).
Figure 10 – AMLP trades over $70 million per day with a penny bid/ask spread (nasdaq.com)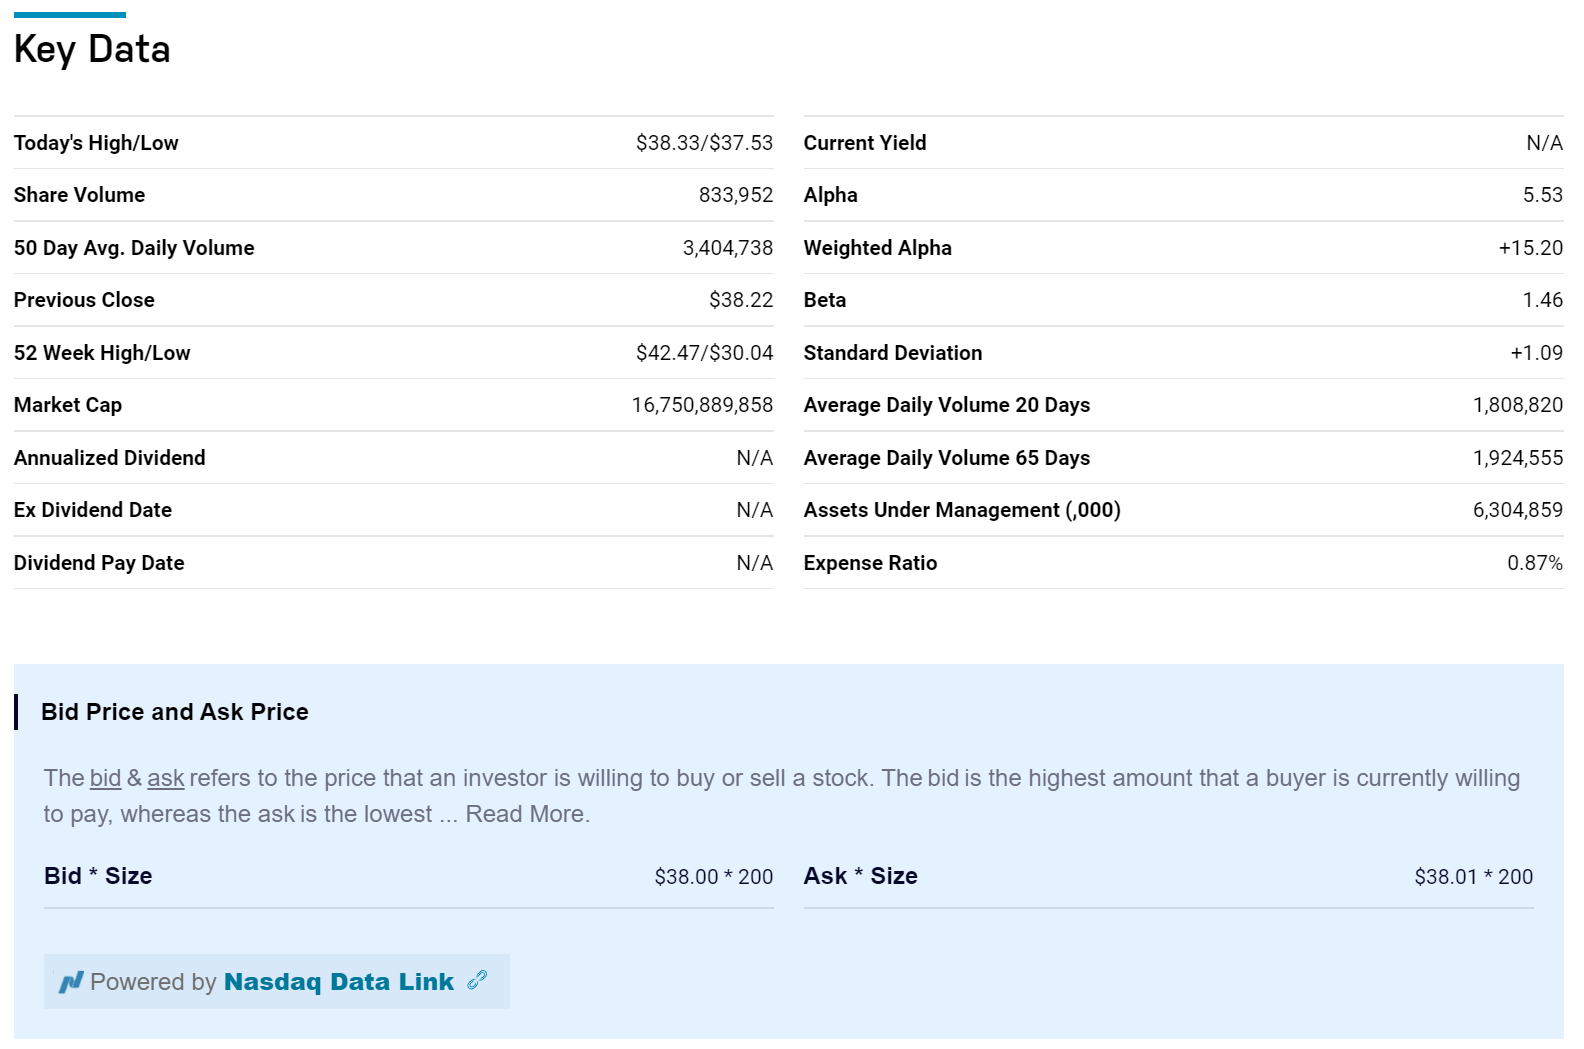
Conclusion
While the Tortoise Pipeline & Energy Fund may offer an attractive 8.5% distribution yield, I find the fund’s historical performance underwhelming. It is also a very expense fund, with a 3.66% total expense ratio. Investors interested in energy infrastructure should look at larger funds like the AMLP, which provides a similar distribution yield, with better long-term historical returns and much better liquidity.
Be the first to comment