

DejanKolar/E+ via Getty Images
Epiphany #1
Life was peachy before the financial crisis started to really bite hard during 2008. I was senior counsel to a Washington DC based law firm. My wife and I had put aside some retirement savings (helped along by a windfall real estate investment, the proceeds of which we fortuitously invested at the bottom of the internet bubble). I was already contemplating transitioning my career to teaching and writing once we could afford the salary cut. I thought that would be a snap once our portfolio was large enough for us to live comfortably on annual 4% withdrawals.
It’s funny what can happen when your 4% withdrawal-sustaining portfolio suddenly drops by 50%. By 2009, I had completely put aside any notion of ever quitting private practice, but extraneous circumstances don’t cease to intervene simply because you’ve adapted and reformulated your plans. The law firm where I worked started to crack under severe economic pressure. Secretaries were first to go. Then came row after row of empty lawyer’s offices and unlit hallways. By the time the firm discontinued offering free snacks in the photocopy room to save money, the final writing on the wall was already dry. The firm was ultimately forced to dissolve, but by then the choice to quit private practice felt like it was out of my hands. Why? I’ll be perfectly honest. My legal resume is schizophrenic. On the one hand, I have a stellar academic record from Yale Law School and impressive work experience at the U.S. Department of Justice and two of the top five private law firms (in my case, Cravath Swaine and Moore, and Sullivan and Cromwell). On the other hand, I’ve moved jobs frequently enough to raise a red flag (to say nothing of the full body tattoo work that mismatches the conservative atmosphere at most law firms). So began my early retirement and nascent writing career.
Around that time, I came across an article on Seeking Alpha with a deceptively simple concept: it’s tough to go bankrupt if you never consume principal, and you can live indefinitely on stable dividend income without requiring the stock market to cooperate with your timing. I’ve never bothered relying on stock prices ever since reading that article and shifted my focus towards dividend growth and compounding our portfolio income.
Epiphany #2
Circumstances, however, quickly taught me the number-one lesson when it comes to living off dividend income: you need to actually GET the dividend income.
Still ebullient from Epiphany #1, it’s only natural that I became attracted to the highest-yielding corners of the market – leveraged MLP funds, mortgage REITs, business development companies, and even a few struggling shipping stocks. It didn’t take long before my income-obsessed strategy produced a couple of “two-for-one specials.” By which I mean the bad kind of two-for-one special. The kind of two-for-one special where a company slashes its dividend and the stock price violently collapses as a result.
Eventually I learned that it is better to accommodate your spending to your portfolio income than to try to do it the other way around. Today, there’s only one type of company I care to own: those that produce and deliver the highest quality goods and services. Companies with low (or zero) debt, consistent and substantial profit margins, reasonable dividend payout ratios, proven dividend growth histories and low payout ratios. Companies that put the power of compounding to good effect by reinvesting profits back into the business. I learned that in order of importance, quality precedes income when it comes to investing. But that wasn’t the most important lesson.
Once my focus turned away from stock prices and towards reliable portfolio income growth, I discovered an attitude shift. Whenever stock prices dropped, I found that our portfolio income growth surged because I earned higher yields on each new dollar of savings I invested. My fear of falling stock prices practically evaporated. And on the other hand, whenever rising stock prices hoisted up the value of our portfolio, I certainly didn’t complain. In a word, investing became a sort of perpetual win/win situation irrespective of market conditions. No wonder the stock market became one of my happy places (but still no contest with a hike along the oceanside cliffs of Sintra on a misty day).
Guincho Beach (Author’s photo)
But here is the really important part. As hard as it is to become good at doing things that you hate to do, it’s even harder not to become good at doing the things that you love to do. Once you develop a rational investment framework devoid of fear and endorphins (like my market “win/win” framework), you’ll become happier. Of course happiness is a welcome goal in and of itself, but I think that over time, you’ll probably find that your risk-adjusted portfolio performance will start to improve once you start to genuinely enjoy the process of investing. Maybe there are some market efficiency theorists out there who disagree with that statement. In response, let me invoke the wisdom of the great Yogi Berra: in theory, practice and theory are the same thing. In practice, they ain’t.
Epiphany #3
I believe that the overwhelming bulk of investment returns unfold over decades, not days. That’s exactly why I believe in long-term, passive index investing. My third major investing epiphany came in the form of a thought experiment.
Owning a fund like the Vanguard S&P 500 Index Fund (VOO) is precisely the same thing as owning all of the 500 underlying individual stocks (minus the fees). If I owned shares of VOO, I would not bother following news stories or studying all (or even any) of the 500 companies in the index. I might not even look at the top 40 largest holdings which comprise over 45% of the entire index. It would make no sense for me to behave differently if I owned all 500 individual stocks, or a sufficient diversified subset thereof. That’s when it struck me: I can gain every single benefit of passive long-term index funds by owning nothing but individual stocks – as long as I don’t trade, rebalance excessively, or otherwise get in the way.
Better yet, I can overlay my own index criteria. More on that later.
The Most Important Epiphany of All
There is absolutely no doubt in my mind whatsoever. The most important investment epiphany for me was this: make a financial plan for your entire lifetime. Let me give a simplified example of what I’m talking about – and please feel free to download and copy this sample spreadsheet and refer to it as you read along.
Step One: Start by picking three or four well-known public companies that pay dividends. Input those into the spreadsheet (which automatically updates every few moments to show the current stock prices). Input a number of shares for each position. Then look up the dividend information and manually input that into the spreadsheet.
Google Spreadsheet (Google Finance)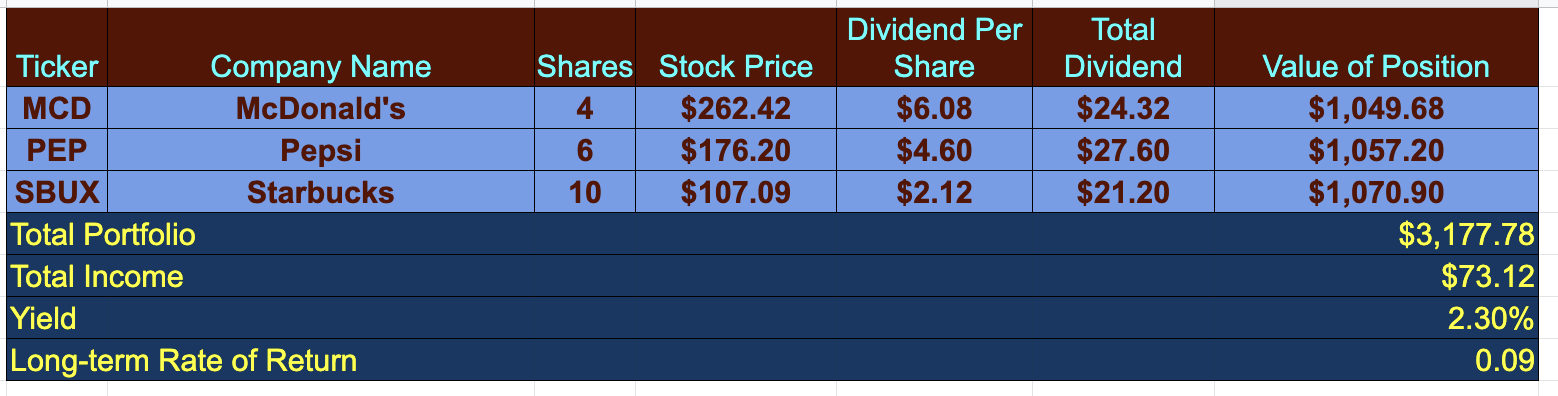
Step Two: Backtest the portfolio on PortfolioVisualizer.com to see the long-term average rate of return. In this example, the historical rate of return comes to nearly 18%. Become pessimistic and conservative. Use HALF THAT AMOUNT as your assumed future long-term rate of return.
Portfolio returns (Portfoliovisualizer.com)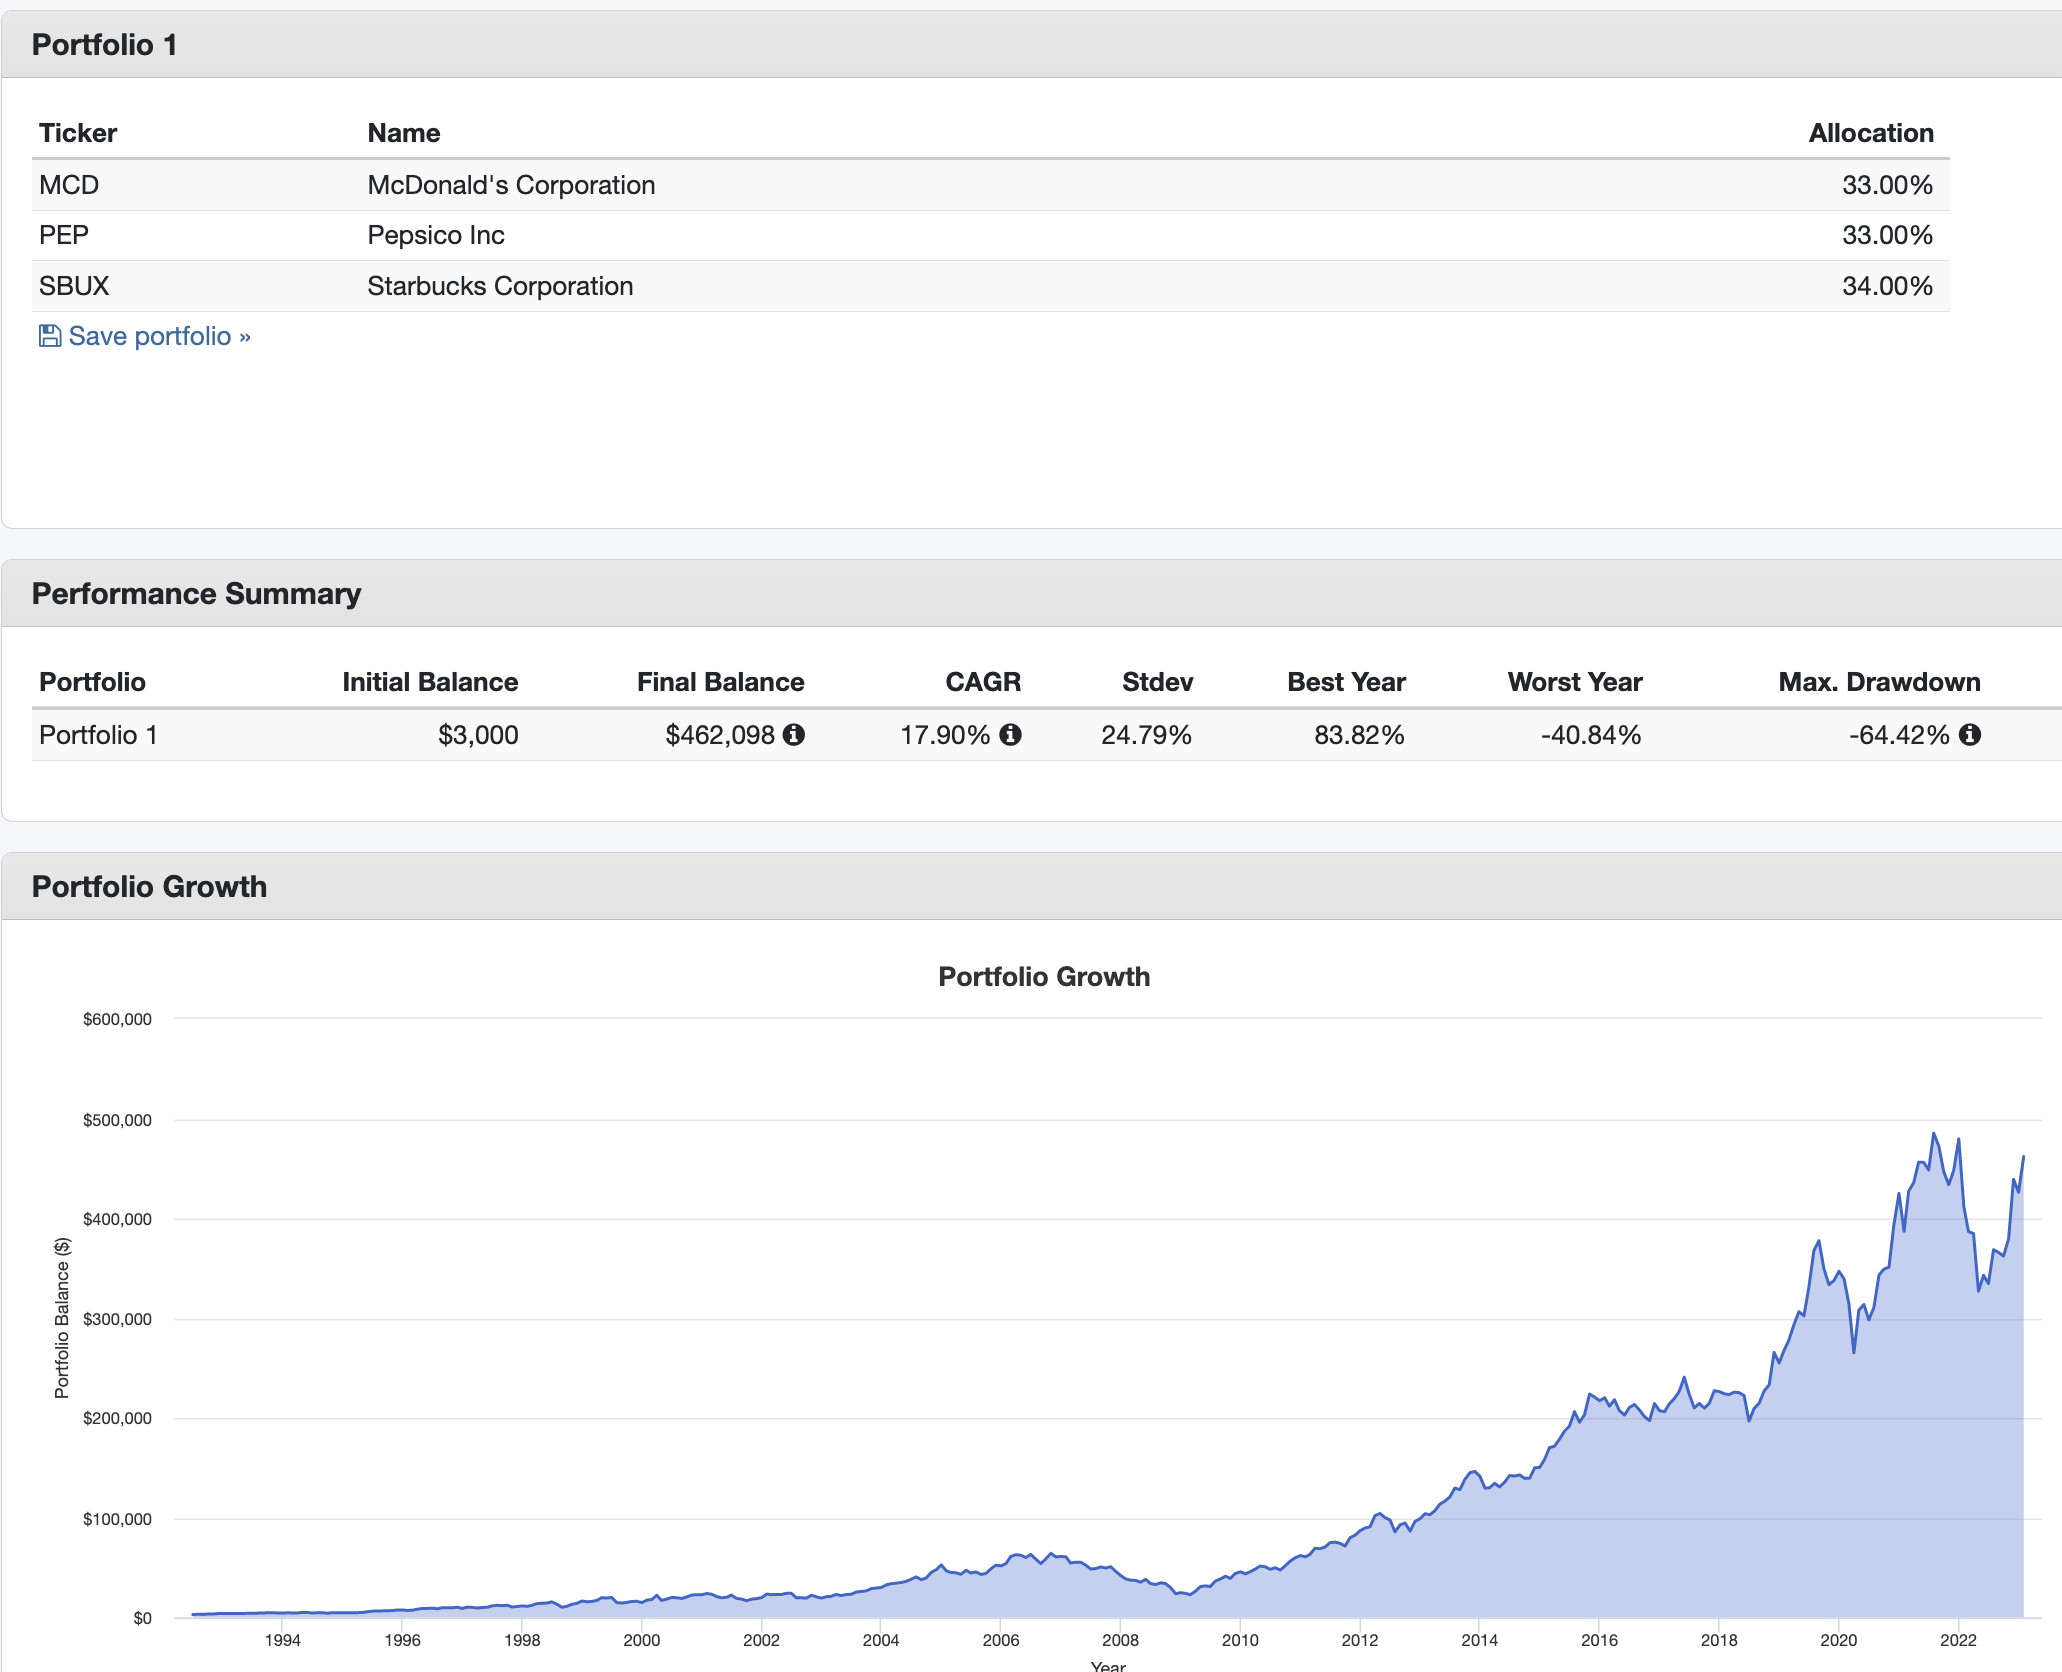
Step Three: Now go to the second page of the spreadsheet which integrates all that real-time portfolio data into a lifelong financial plan. Simply enter in seven basic variables: inflation rate, your age, your salary, your spending, your tax rate, your retirement age and your total projected lifespan.
Spreadsheet inputs (Google Finance)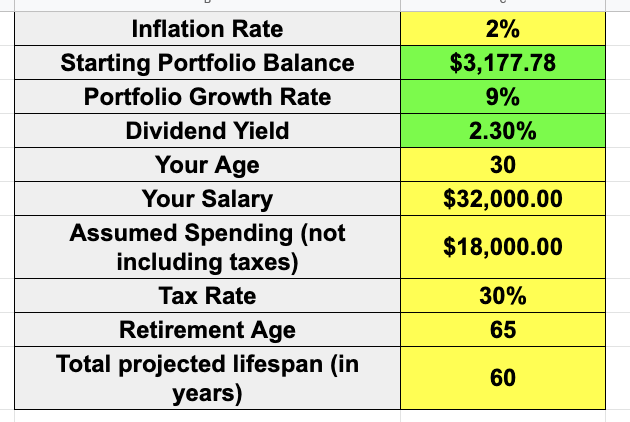
Step Four: Every few moments while the markets are open, the spreadsheet will use these assumptions to calculate your future net worth year by year throughout your entire lifetime. On the assumptions in this example, you’d end up with $16,703,638 by age 90, which has a present value of $5,090,972 today. Astounding, isn’t it? Especially once you consider the modest beginnings of the financial story in this example.
Lifetime Financial Map (Google Finance)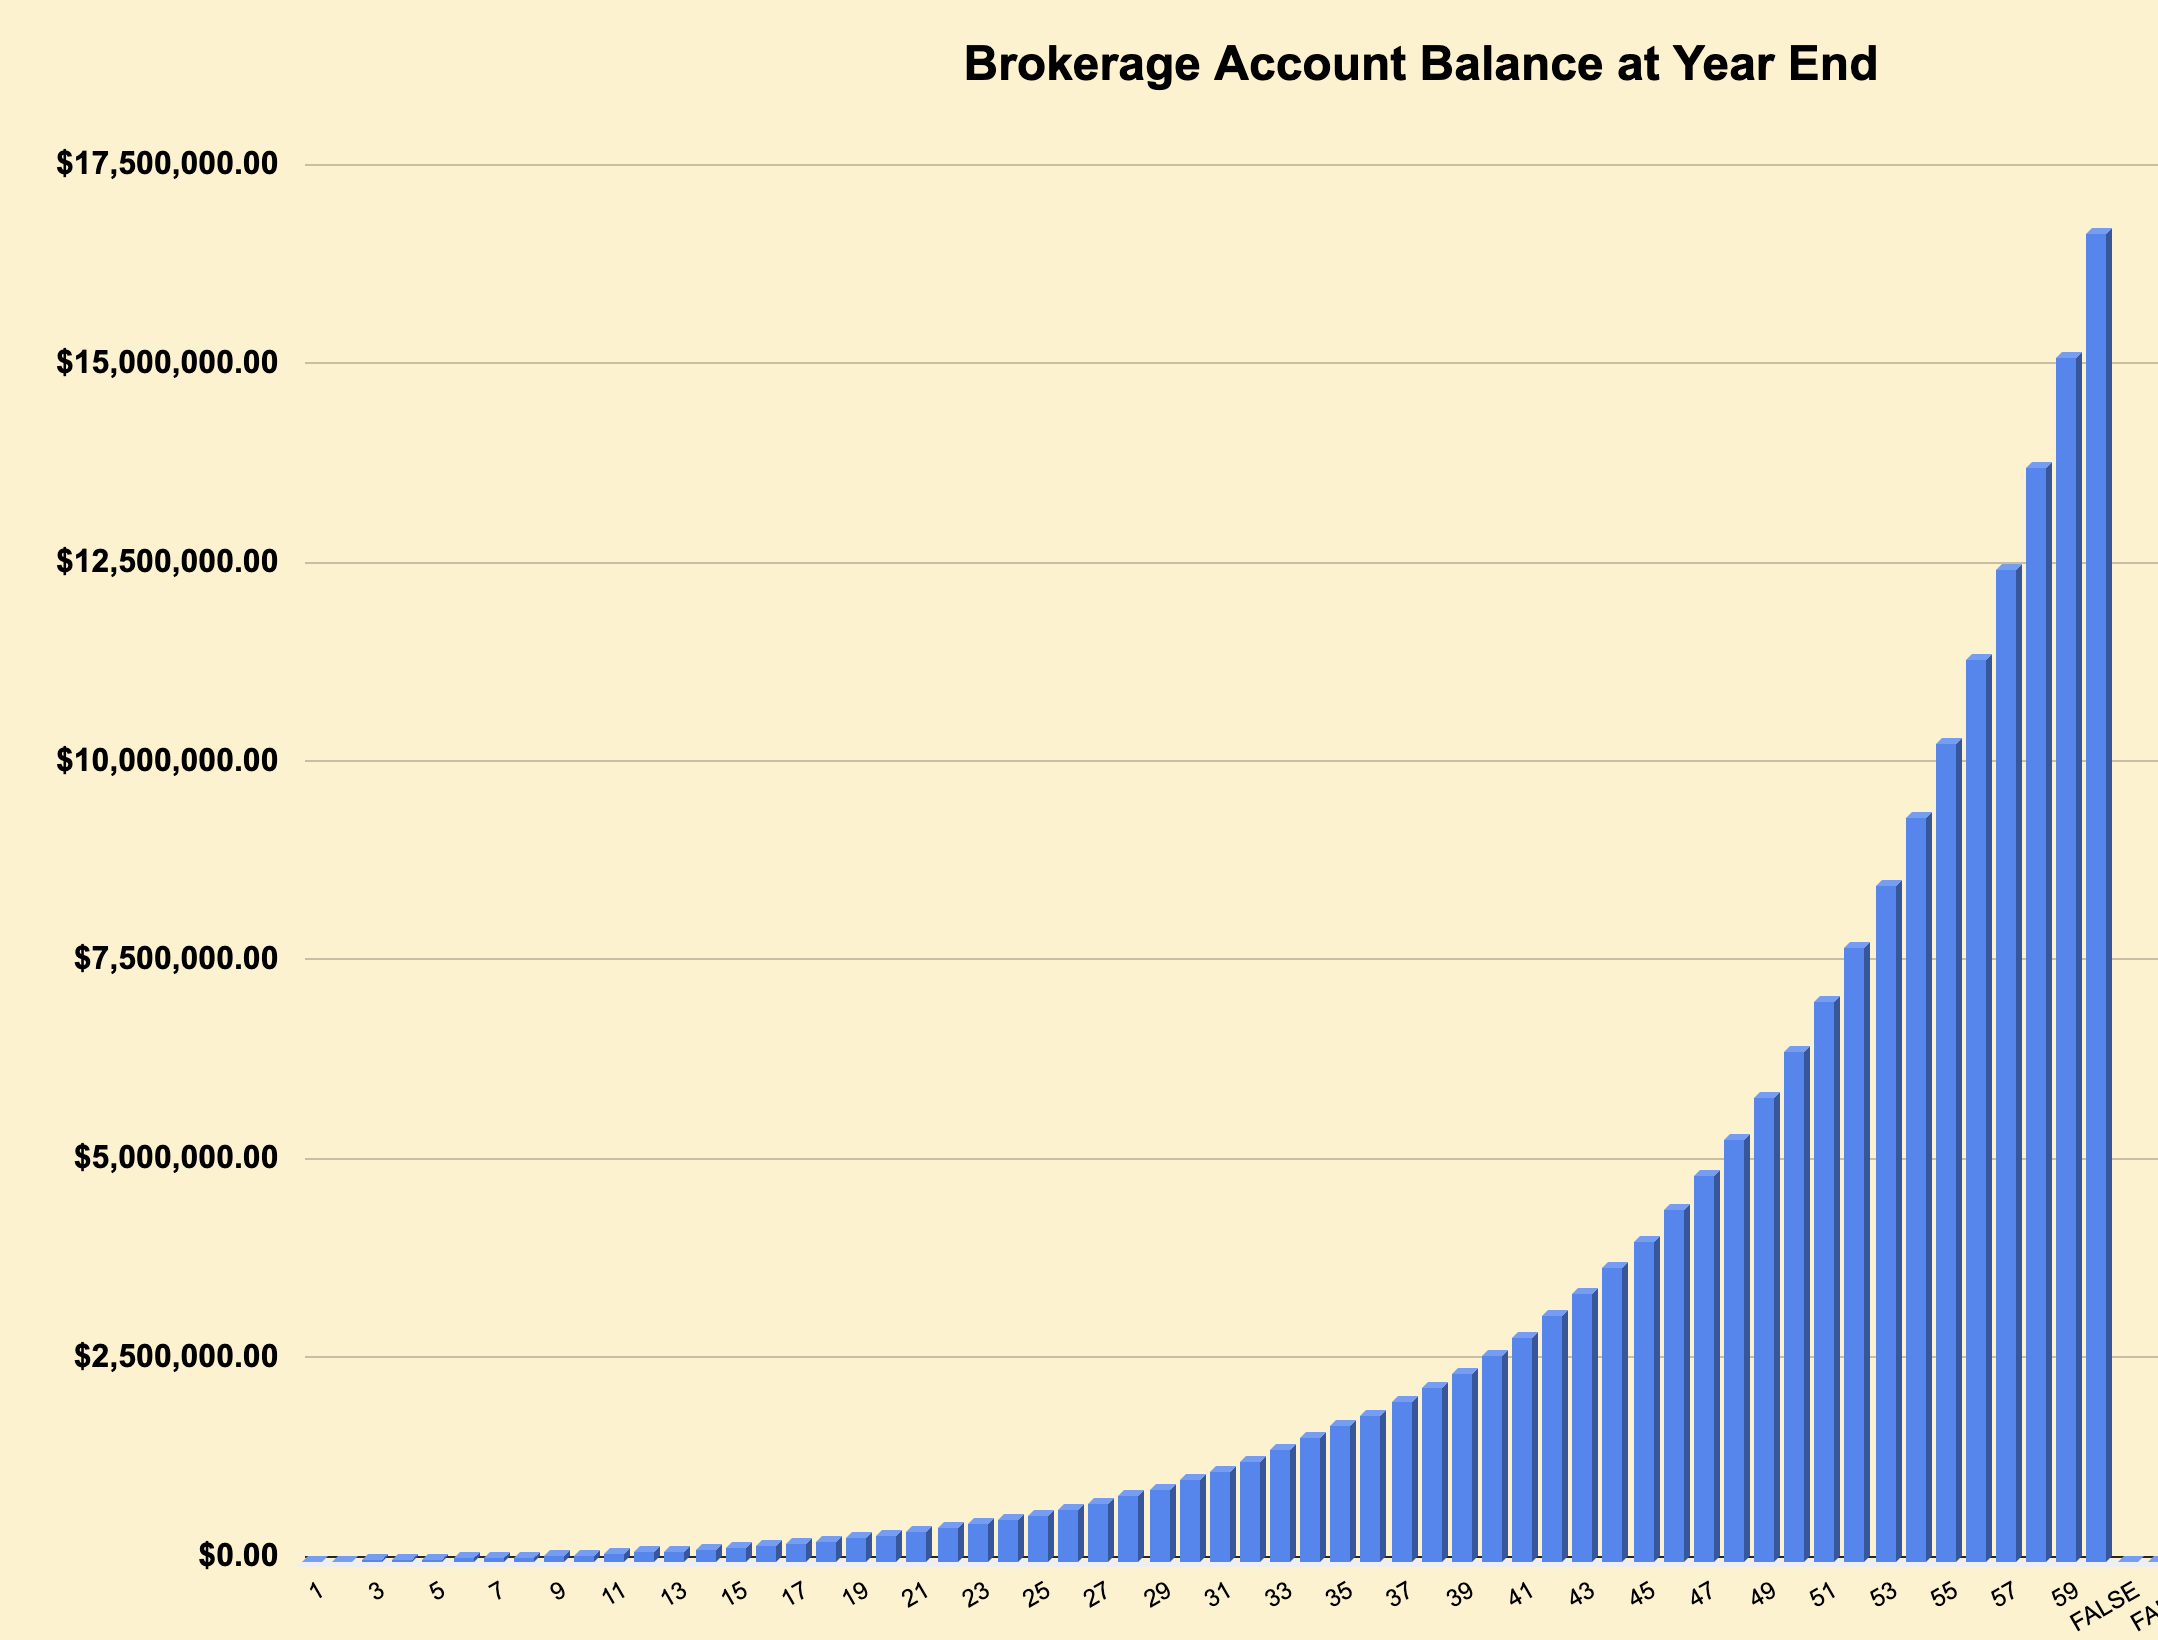
Step Five: It’s pretty empowering to discover that your current net worth in this example isn’t actually $3,177. It is nearly 1600 times that amount in present value terms… as long as (1) your investments to do at least half as well as they’ve done in the past, and (2) you stick to the plan. Sticking to the plan is half the game, and it’s largely in your power.
A lifetime financial map changed my perspective. Let me ask you this: which are the most interesting numbers? If you are like me, the answer is simple: “the really big ones.” Notice how those numbers have very little to do with current market conditions or even your current starting net worth? Most of the action hasn’t even happened yet.
A few other things might start to change for you as well as you more clearly visualize your whole financial lifetime. If you’re planning for the long-term, what kind of companies do you want to own? If you’re like me, the answer is simple: “companies that will still be in business when I’m 90 years old.” I really don’t see Pepsi, Big Macs or sugary coffee drinks going out of fashion anytime soon and so yes, I absolutely do own (SBUX), (PEP) and (MCD).
Here’s another example. When I look at my net worth by age 100 and compare that to where I am today, I can ask myself “do I need to try to maximize my returns by taking greater risk with my portfolio?” It might take me longer to get to the really interesting and fun numbers, but so what? When I look out into my and my wife’s distant futures, my primary investment goal emerges clearly: avoid catastrophic losses. That’s one reason why over 90% of our portfolio is concentrated in A-rated and debt-free companies. They’re less likely to go bankrupt.
A lifetime financial plan can even change your lifestyle choices, as well. Here’s a true story. Now, if you play around with the spreadsheet you will quickly see how easy it is to calculate the impact of future spending and tax rates. Seeing a precise number illustrates how minor savings today will reverberate loudly over future decades. That was one of the initial reasons why my family and I left the Washington DC area and moved to Portugal. Our living expenses and overall tax rate dropped, and we reinvested the savings. It was easier to stick to the long-term plan since we were working off a lifelong financial roadmap like the spreadsheet used in the example.
Some of you (including me) might prefer a far more detailed spreadsheet. What about more complex tax calculations that account for things like RMDs, ROTH IRA conversions, rising marginal rates, etc.? As it happens, I took a stab at putting together a draft spreadsheet that attempts to account for exactly that. Feel free to make a copy and adapt the spreadsheet to your own purposes. As always, I warmly welcome feedback in the comments section about what (if anything) you learn with the spreadsheet and caution all readers that they cannot rely upon the accuracy of any calculation or result that the spreadsheet produces. I’m not a tax advisor or accountant, and the spreadsheet is a very rough estimate at best. Besides, you know that things like tax laws, stock prices and dividend payments will assuredly change in from moment to moment, year to year, and decade to decade. But as the great man himself once said; be careful if you don’t know where you’re going, or you might not get there. From that standpoint, a rough guess is better than no guess at all.
Disclosures and Biases
To avoid any possible conflicts and to disclose any potential biases, over the years I’ve made a practice of publishing my entire portfolio, which is currently comprised thusly:
Author’s portfolio (Author’s spreadsheet)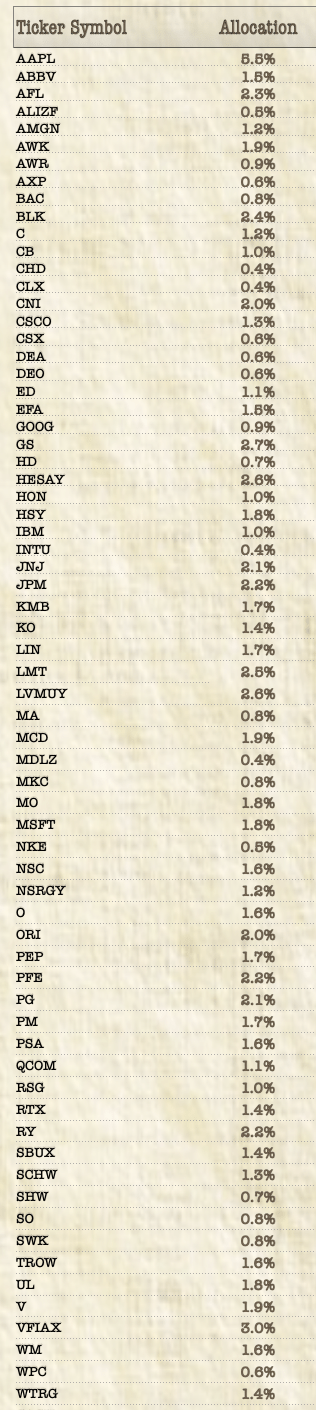
What are the long-term returns on my portfolio? According to Google Finance, the portfolio produced capital gains of roughly 50% over the past 5 years, with a 2.66% dividend yield.
Long-term portfolio performance (Google Finance)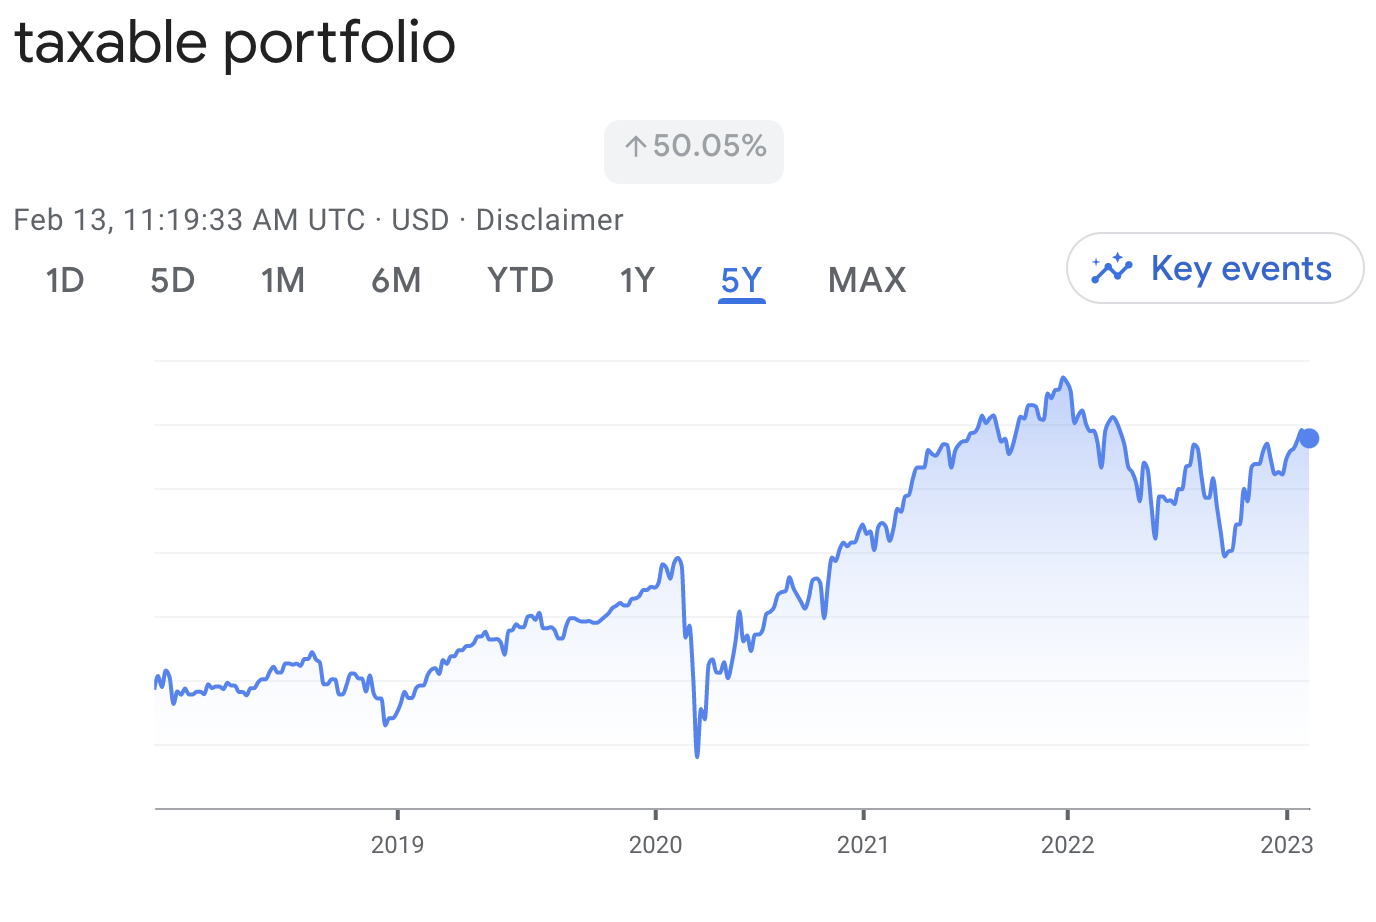
That compares to a 37.68% five-year capital gain and 1.7% annual dividend yield on a portfolio consisting one share of the Vanguard Total US Stock Market ETF (VTI) and one share of the Vanguard Total World Stock Index ETF (VT) (a benchmark that owns roughly the same percentage of international and US stocks as my portfolio owns). So overall, it’s about 17% of extra total return over the last five years going by Google Finance.
Long-term benchmark performance (Google Finance)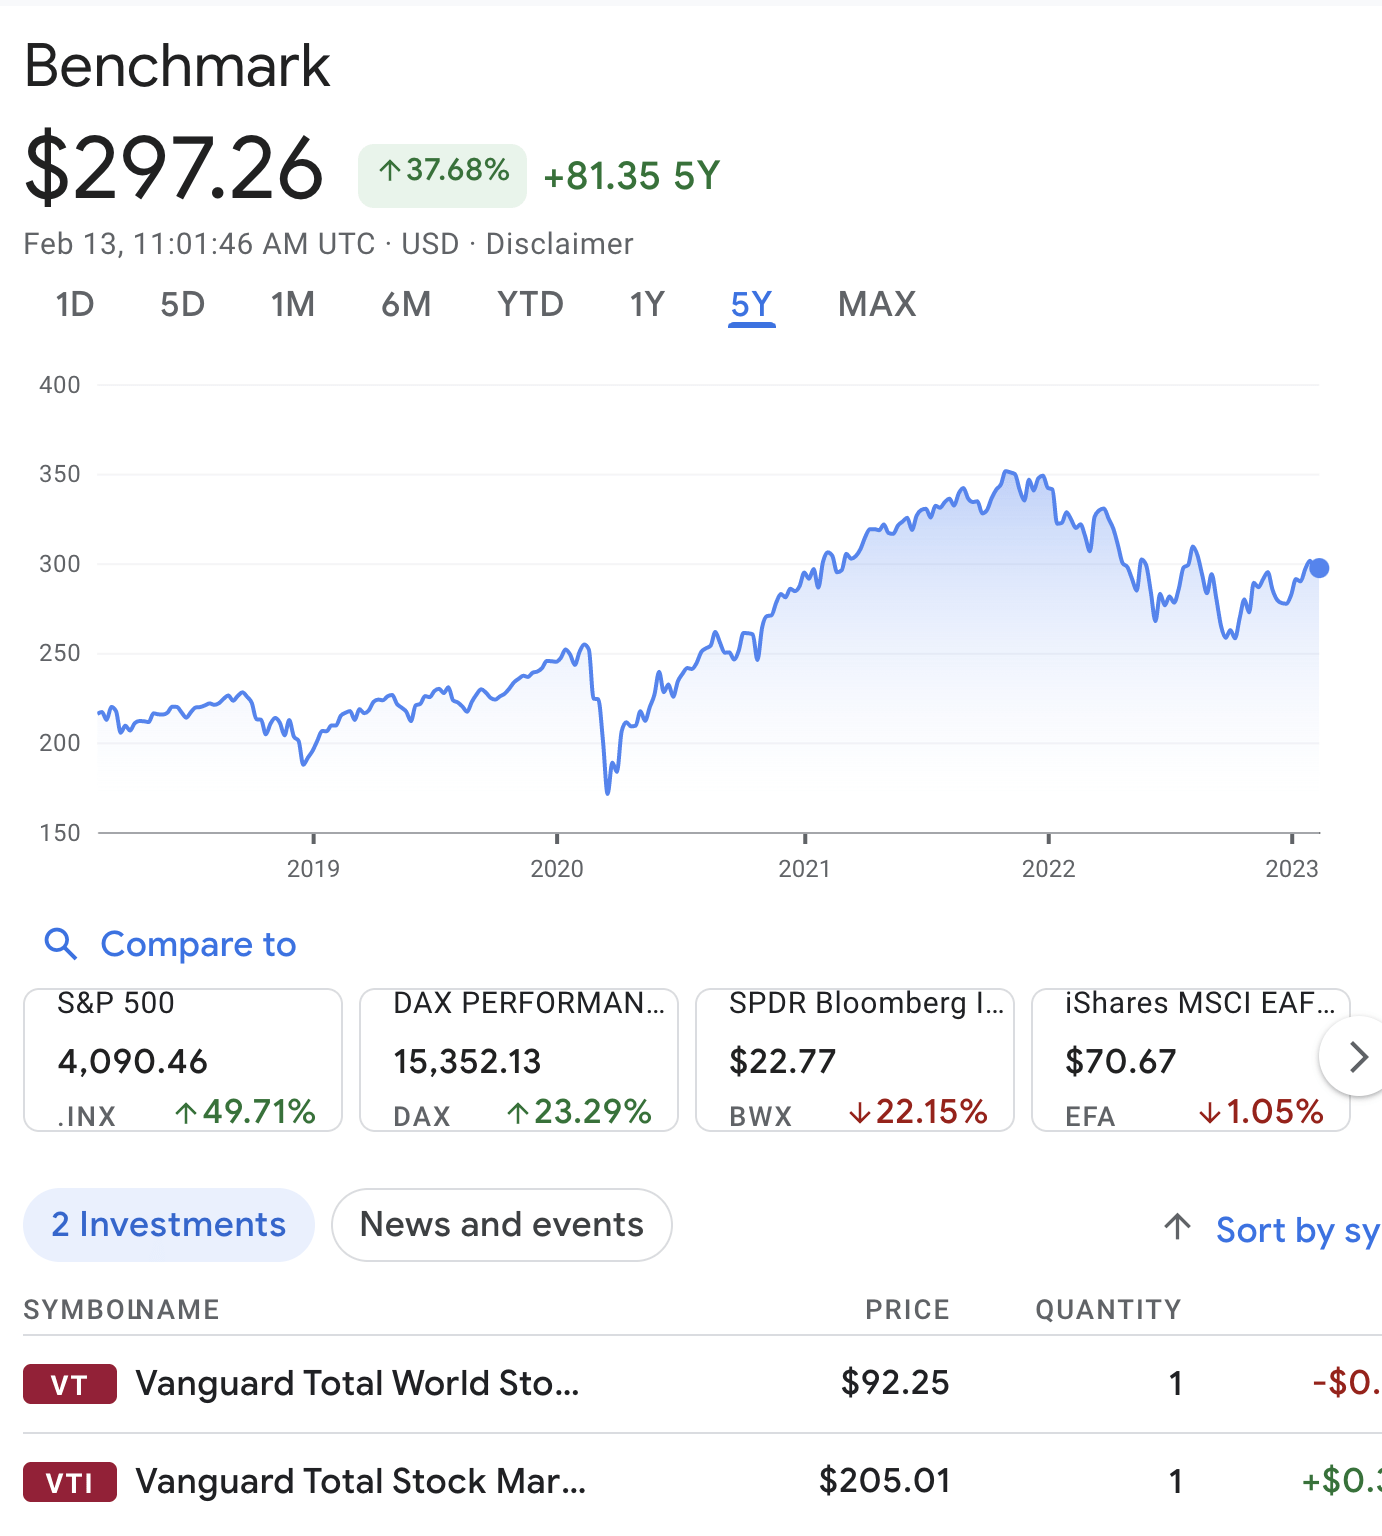
I do not suggest anyone follow my strategies, or buy or sell any security (including those I own or have sold in the past), and I can’t guarantee that Google Finance produces accurate calculations. This information is simply to disclose potential biases.
Be the first to comment