

Artur/iStock via Getty Images
This article was co-produced with Chuck Walston.
Given the success of my generational-focused REIT articles in which I highlighted millennials, Gen Alpha, The Silent Generation, Gen Z, and Baby Boomers, I asked Chuck Walston to help me put together a dividend-focused version.
This is the third in a series of articles for investors in differing age groups. The first one was crafted for those in their early twenties, and the second was designed for those seventy years of age or older.
For those in the junior demographic range, Chuck focused on stocks with lower yields but higher dividend growth rates. Since younger folks have time on their side, the compounding effect can provide enormous returns over an extended time span.
The portfolio outlined in that article provided an average return of 1.79% and a five-year dividend growth rate of nearly 13%.
Seniors oftentimes desire bigger yields. Chuck’s portfolio is designed for seniors and had an average yield over 5% and an average 5-year dividend growth rate of 9.92%.
Generation X is generally defined as those as those born from 1965 to 1980. With that age range in mind, Chuck chose stocks with a yield that lies between the two portfolios provided in the previous two articles…
Ladies and Gentlemen…here are the top 10 dividend growers for Gen X:
Union Pacific Corporation (UNP)
Yield: 2.66%, Payout Ratio: 44.08%, 5-Year Growth Rate: 15.43%
It is hard to imagine a major industry with a wider moat than that of railroads. Morningstar rates UNP as possessing a wide moat, and for good reason.
The industry’s ability to maintain pricing and margins during past recessions, as well as the Class I railroads increased profitability despite substantial coal volume losses in recent years, testifies to the durability of the business model.
Furthermore, any prospective direct competitor would have to devote many billions in capex for equipment and rail line construction before winning the first contract for cargo.
Except for waterborne freight, railroads operate with a superior cost structure. Railroads enjoy an approximate four-to-one fuel efficiency advantage over truckers. Consequently, freight can be shipped for 10% to 30% less by rail.
All of the railroads are suffering with staffing shortages and facing a prospective, albeit unlikely, rail strike. Of course, railroads are also sensitive to changing economic conditions.
However, excluding a brief period during the market’s COVID downturn, UNP’s current yield of 2.66% is at the highest level seen since 2016 and is well above the average annual yield in any year since at least 2012.
Union Pacific’s debt is rated A by S&P and Fitch and is rated Baa1 by Moody’s
I am accumulating shares in the company regularly, albeit in small increments.
FAST Graphs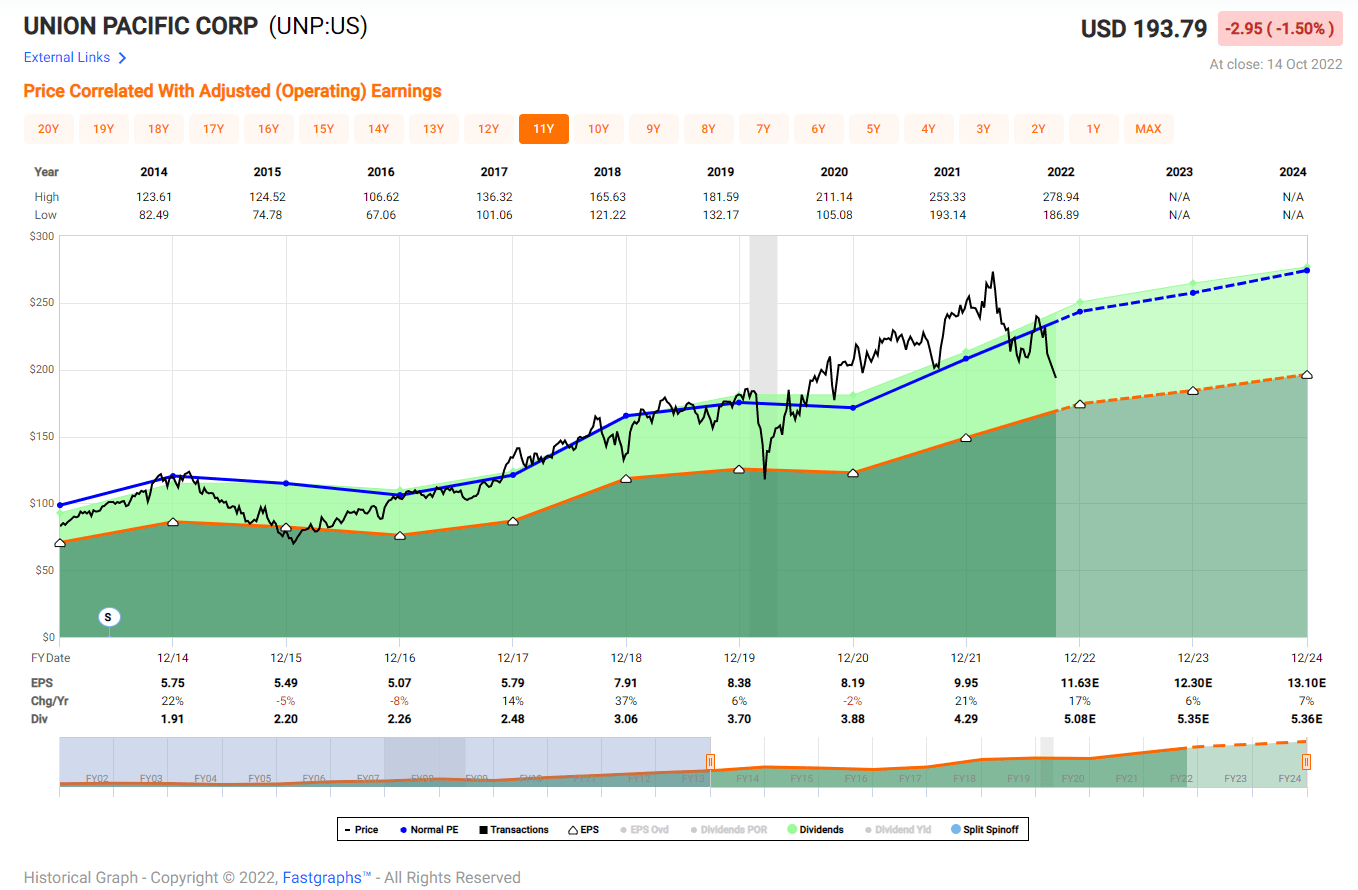
Corning Incorporated (GLW)
Yield: 3.55%, Payout Ratio: 46.15%, 5-Year Growth Rate: 11.84%
Morningstar rates GLW as having a narrow moat. If anything, I would have to consider the company’s moat as broader and deeper than that of narrow moat businesses.
For one, the fragile nature of glass means GLW’s plants are often located adjacent to clients’ production facilities. This results in Corning requiring long term contracts coupled with customers providing 75% of building costs for any new manufacturing plant.
Combine that with Corning’s technological advantages. A few examples of Corning’s dominance: Gorilla Glass is used on 73% of the world’s smartphones, GLW is the only provider of Ceramic Shield for iPhones, and the company operates three of the world’s four Gen 10.5 plants. Gen 10.5 reduces the cost of producing TV panels by 30% over the previous technology.
Corning’s debt has the longest average time to maturity of any company listed in the S&P 500, and Moody’s rates the debt as Baa1 / stable.
GLW is one of only two stocks that I have rated as Strong Buys in 2022, and I continue to add to my position in the name.
FAST Graphs 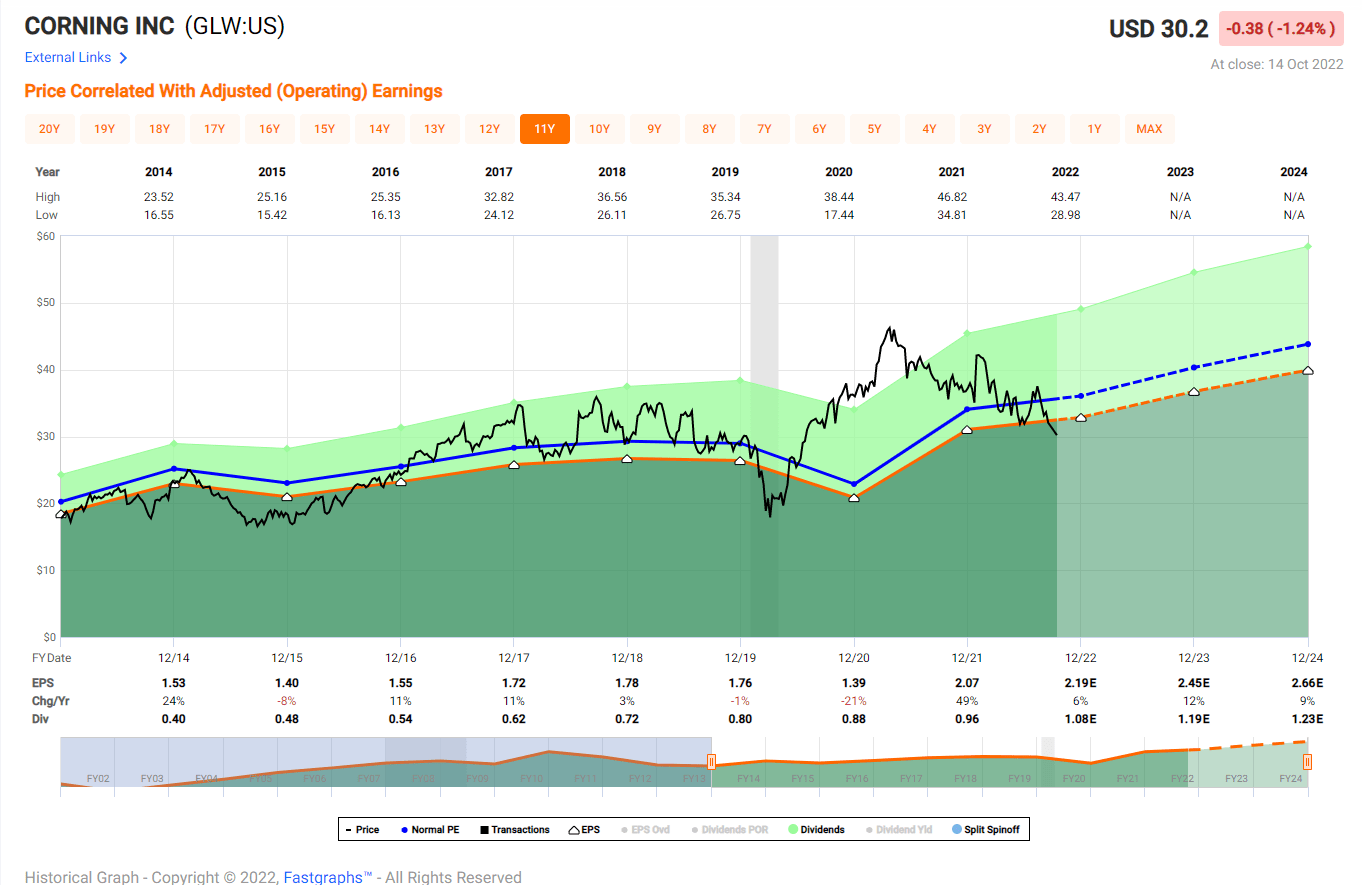
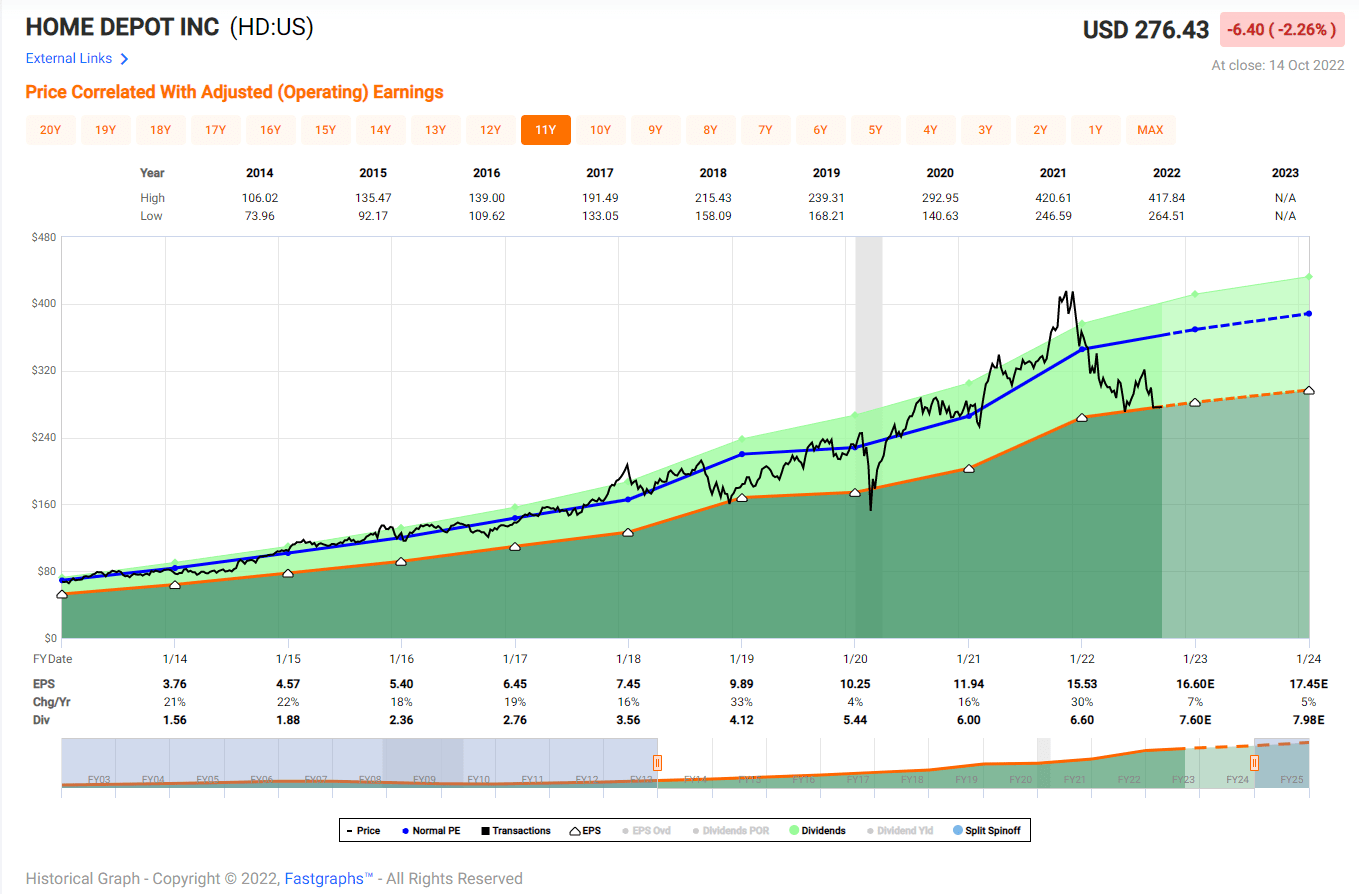
Lowe’s (LOW) and Home Depot (HD)
Lowe’s – Yield: 2.10%, Payout Ratio: 27.19%, 5-Year Growth Rate: 18.77%
Home Depot – Yield: 2.62%, Payout Ratio: 45.18%, 5-Year Growth Rate: 16.95%
I’m including both stocks under one header due to their many similarities.
Morningstar rates both companies as wide moat businesses. In part, this is due to the scale advantage they hold over rivals, allowing each firm leverage over suppliers that translates into a pricing advantage.
One example of the companies’ dominance: HD sells more paint than Sherwin-Williams (SHW).
Per the 2022 annual report, Lowe’s owns 84% of its stores, including those on leased land.
Home Depot owns about 90% of its stores, including those on leased lots.
Both firm’s reward shareholders via robust stock buyback programs. Since 2007, HD repurchased roughly half of shares outstanding. In 2010, LOW had over 1.4 billion shares. Today, the company has a bit over 620 million shares outstanding.
Lowe’s long-term debt is rated in the high BBBs, and Home Depot’s credit ratings are solidly investment grade.
Pros constitute about 45% of Home Depot’s sales. This figure is well above that of Lowe’s, with 25% of sales from pros.
Since pros tend to be reliable, repeat customers and generate bigger tickets, that translates into bigger profit margins for HD. Home Depot has operating margins above 15% versus about 13% for LOW.
With an addressable market of over $900 billion and combined annual sales for the two of less than $250 billion in the last fiscal year, there is significant room for continued growth.
I have positions in both stocks, and I am adding in small increments at this juncture.
FAST Graphs FAST Graphs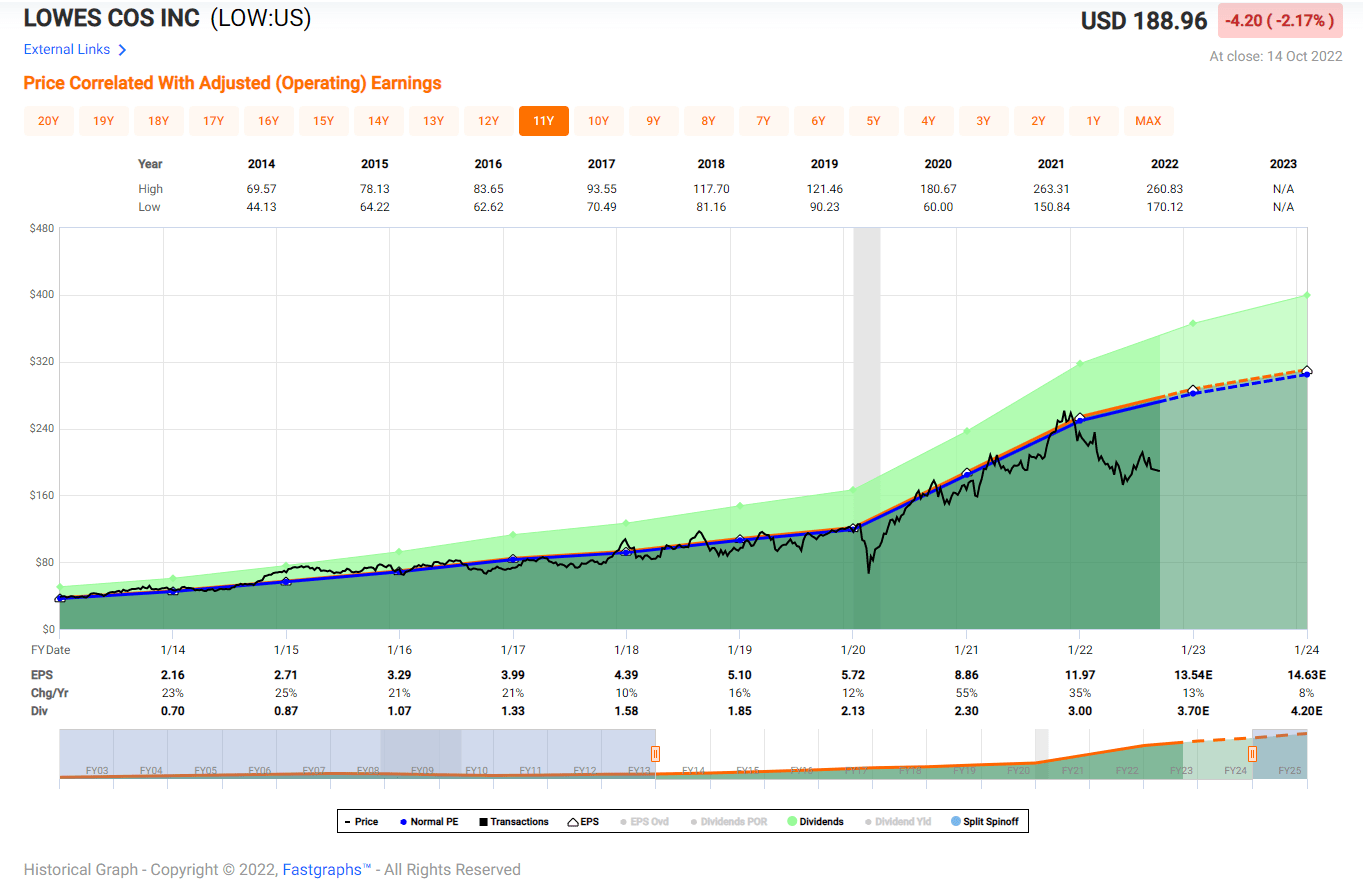
Snap-on Incorporated (SNA)
Yield: 2.71%, Payout Ratio: 34.44%, 5-Year Growth Rate: 14.87%
Snap-on is a global manufacturer and distributor of tools, equipment, diagnostics, repair information, and software solutions. With 30% of revenues originating overseas, it is largely US centric company.
From 2008 through 2019, SNA’s annual net income nearly tripled.
The automotive industry’s manufacturing headwinds could provide long term tailwinds for SNA, as the average age of vehicles in the US increased markedly since COVID.
businesswire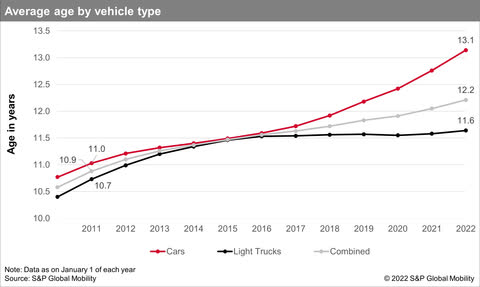
Older vehicles translate into greater demand for parts and repairs, and both should fuel demand for SNA’s product lines.
Another source of growth could lie in the transition to electric vehicles. As consumers transition to EVs, repair shops will need tools and diagnostic devices for EV and ICE vehicles.
Morningstar assigns SNA a narrow moat rating.
Snap-on’s net debt to capital at the end of last quarter was 8.3%, and the company has no outstanding debts under its credit facilities. S&P provides a rating of A-.
I hold a position in SNA; however, I believe the shares trade in a fair value range; therefore, I will wait for a 10% pullback before adding.
FAST Graphs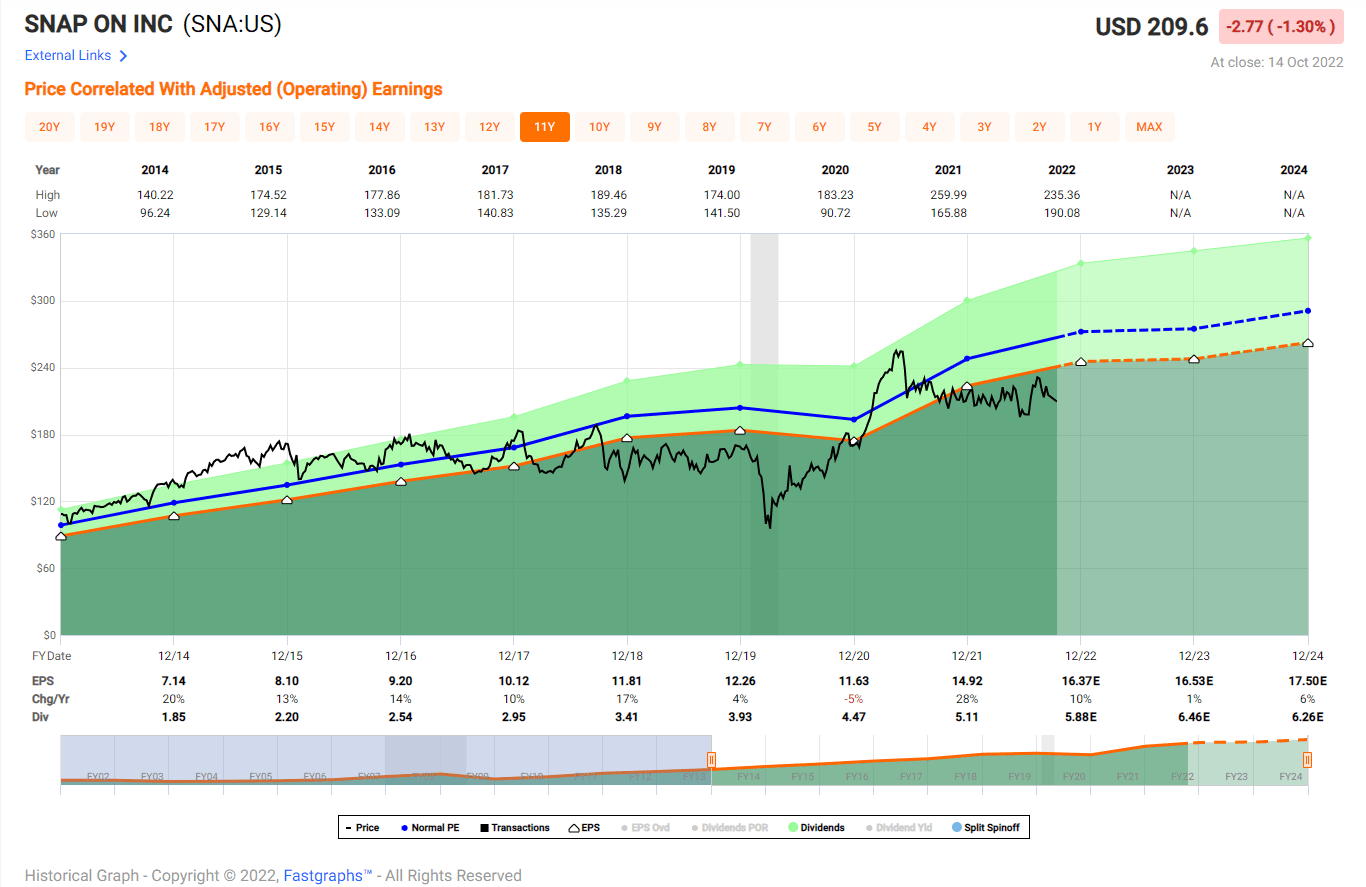
Taiwan Semiconductor Manufacturing (TSM)
Yield: 2.70%, Payout Ratio: 7.15%, 5-Year Growth Rate: 10.33%
Like my preceding picks, Morningstar assigns a moat to TSM. In this case, the moat rating is wide, and for good reason.
The firm’s technology is used by approximately 85% of the globe’s semiconductor start-up prototypes, and TSM is the dominant producer of 7nm and 5nm nodes.
Last quarter, TSM’s advanced technologies, defined as 7-nanometer and below, accounted for 51% of wafer revenue, while revenue from 5 nm products increased over 50% from the prior year.
Even though TSM garners over 50% of the globe’s foundry revenue, the company is adding market share.
TrendForce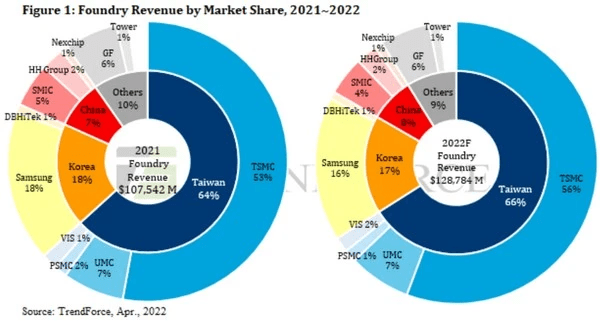
TSM’s revenues are three-and-a-half times that of the number two competitor, and management guides for long-term revenue growth in the range of 15% to 20% over the next several years.
The company’s 2nm node is expected to increase performance by 10% to 15% with the same power requirements and an increased chip density.
Bears point to the threat of an invasion from China and/or the cyclical nature of the industry.
I counter with the fact that TSM has never experienced a decline of EPS greater than 20% in the last decade. Furthermore, from 2009 through 2019, TSM grew EPS at a CAGR of 14.8%.
According to a study by Rand, a war involving China and the US would result in a 5% drop in our GDP, and a 25% drop in China’s. To place that in perspective, the Great Recession caused a 2.6% fall in GDP, and the S&P fell 55% below its peak as a result. Consequently, I believe the odds of a conflict are remote.
S&P rates TSM’s debt as AA-/ stable, and Moody’s provides a rating of Aa3/stable, the highest debt ratings of any company in the industry.
I rate TSM as a Strong Buy. I hold a position in the stock, and I am adding on weakness.
FAST Graphs 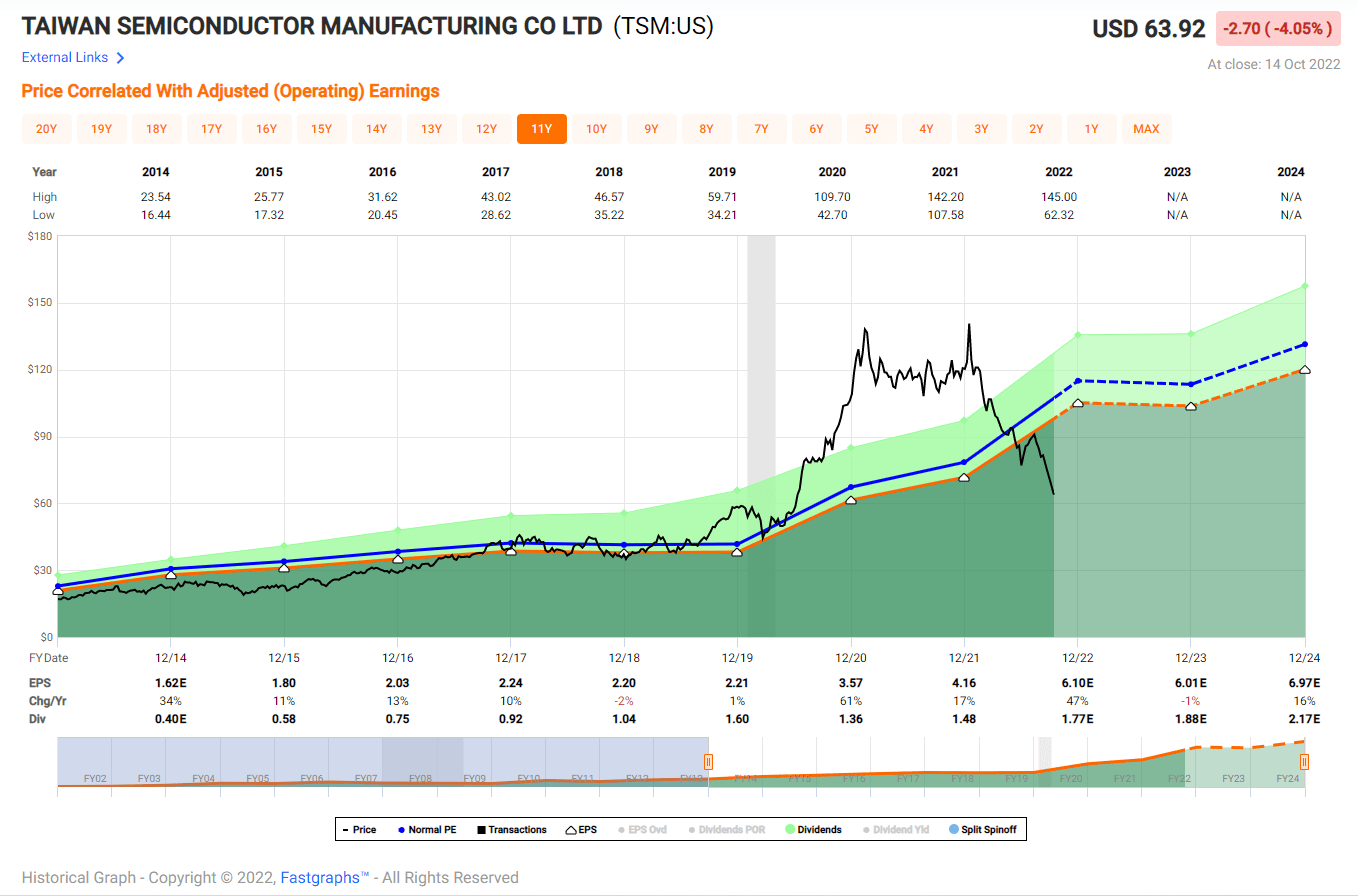
American Tower Corporation (AMT)
Yield: 3.02%, Payout Ratio: 94.42%, 5-Year Growth Rate: 17.88%
AMT is the only REIT among this group. (I considered including Prologis (PLD), but opted for AMT for the sole reason that I highlighted PLD in the stocks I chose for 20- year-olds.)
AMT is primarily a cell tower REIT. However, that changed recently with the firm’s $10.1 billion deal to acquire CoreSite, a company with data centers in eight major U.S. metropolitan areas.
The company has reasonable geographic diversification with towers in 25 countries including India, Brazil, Africa, and Mexico. Roughly 44% of revenue is generated outside Canada and the U.S.
AMT has long-term leases with wireless carriers that include annual rent escalators. This gives the REIT a steady and visible stream of income.
Because clients pay the costs of installing and removing the needed equipment from the towers (Morningstar estimates the cost for a wireless carrier to remove equipment is equivalent to one and a half to two years’ rent), the relationship with customers tends to be “sticky.”
The REIT has generated an AFFO per share CAGR of 13.85% since 2013. AMT is expected to see continued growth from the transition to 5G and increased mobile data consumption.
Morningstar gives AMT a narrow moat rating. Moody’s long-term rating is Baa3/stable.
With an average yield for each year that has never topped 2%, I view the current 3% yield as a prime buying opportunity. I am eagerly adding to my position in the stock.
FAST Graphs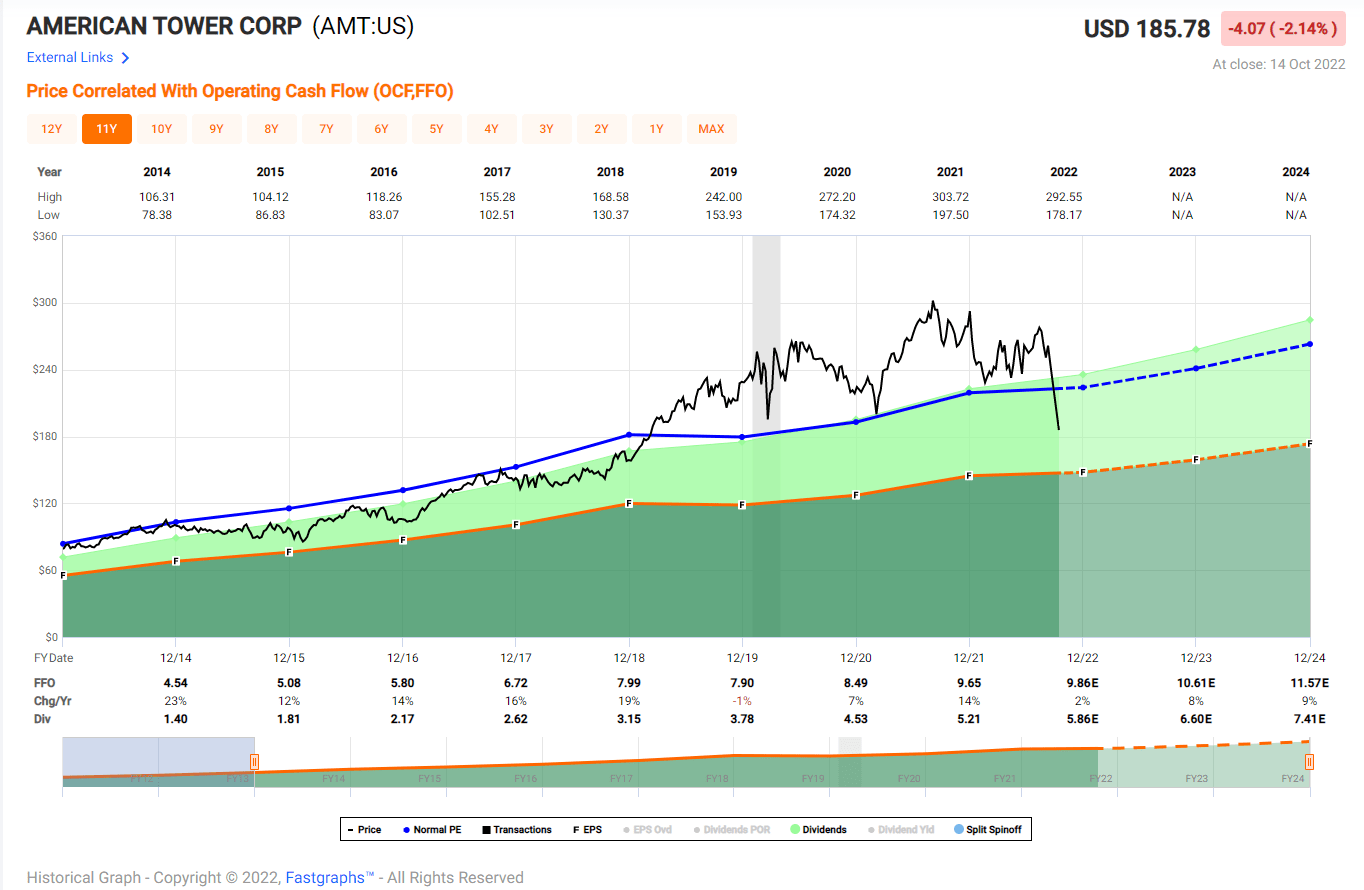
The Kroger Co. (KR)
Yield: 2.42%, Payout Ratio: 22.03%, 5-Year Growth Rate: 12.91%
Long before Warren Buffett invested in Kroger, I was highlighting the company as a sound investment.
This excerpt from my recent Dividend Kings article provides some insights into my position on the stock.
Kroger has more than tripled the dividend over the last ten years. KR shares have outperformed the S&P 500 by more than a two to one margin over the last five years, and the broader market by 160% over the last decade. And unlike TGT and WMT, shares of Kroger are up over 11% year-to-date, while the S&P is down by 14%.
Kroger is among the top five retailers, is the largest pure grocer in the United States, and operates one of the top ten ecommerce sites.
Kroger owns approximately 45% of its supermarkets when ground leases are included, and Morningstar ranks the company as having a narrow moat.
Kroger’s debt is rated BBB/stable by Standard & Poor’s.
I am invested in KR, but I view the shares as trading in a fair value range. Consequently, I’ll wait for a 10% pullback before adding to my position.
FAST Graphs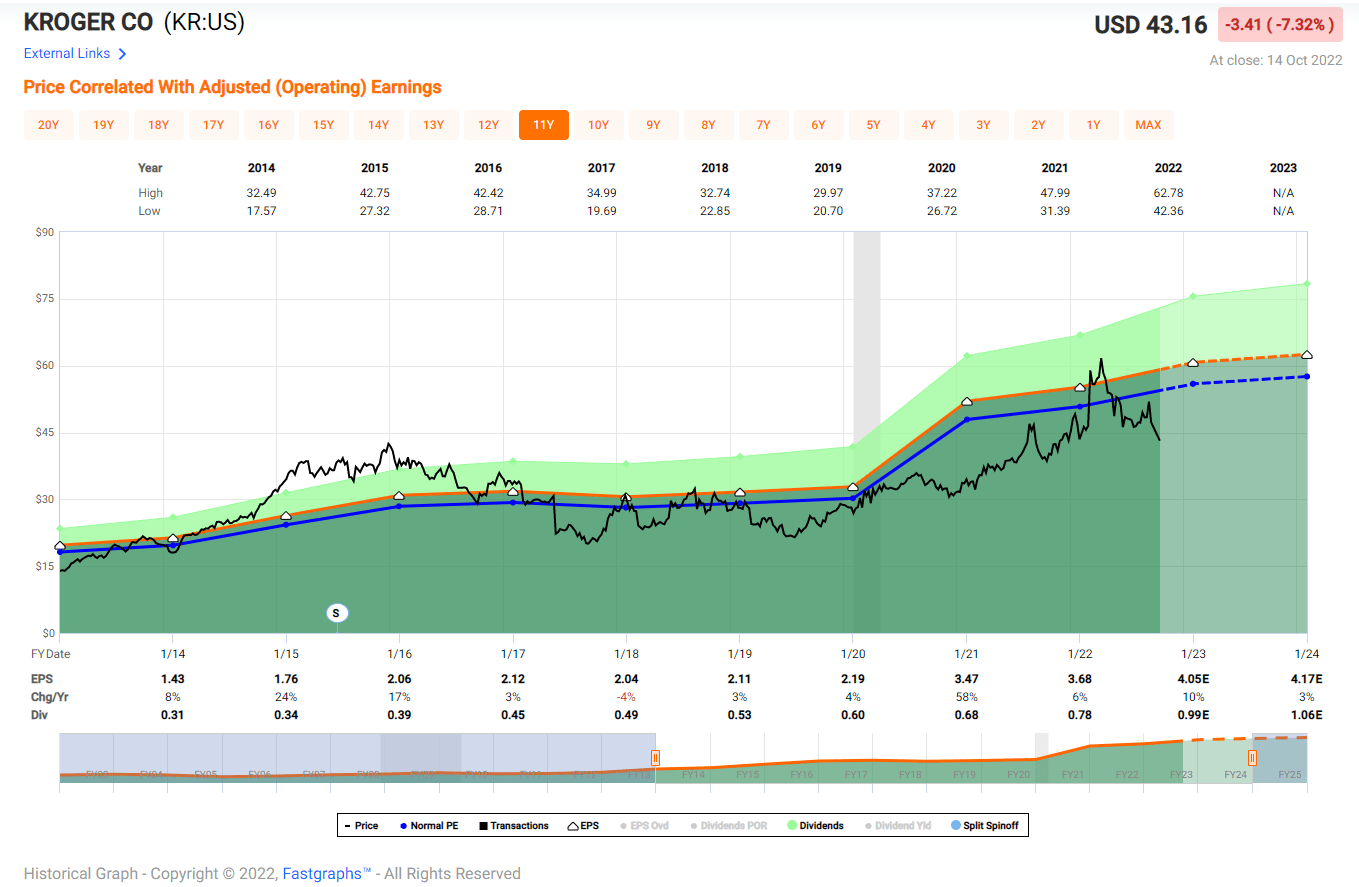
Williams-Sonoma, Inc. (WSM)
Yield: 2.63%, Payout Ratio: 18.50%, 5-Year Growth Rate: 14.41%
About two-thirds of WSM’s revenue stemmed from ecommerce sales in FY22. WSM is noted for its prowess in harvesting customers data. This gives management the ability to focus on growth paths and improve customer loyalty.
Pundits view the firm’s move into B2B as a source of future growth. Despite the less than stellar economic climate, WSM posted excellent results during the last quarter.
Management guides for FY22 and long-term mid-to-high single-digit annual net revenue growth.
WSM has no funded debt on the balance sheet. WSM’s debt is not rated by any of the major rating agencies; however, analysis by Argus states the company’s current debt metrics are “probably consistent with BBB credit.”
Morningstar gives WSM a narrow moat rating.
I have a position in WSM and have been adding in small increments of late.
FAST Graphs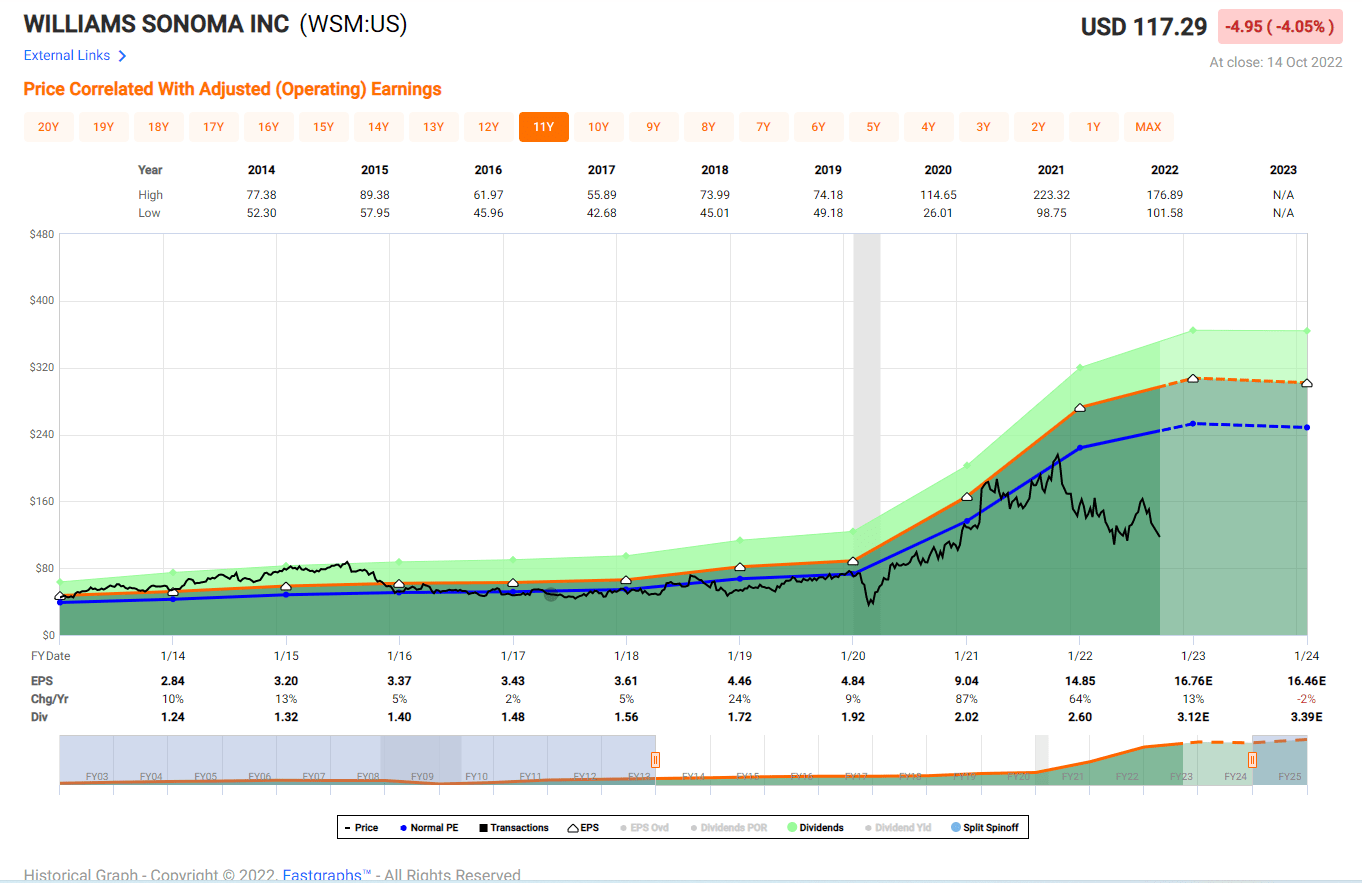
Tractor Supply Company (TSCO)
Yield: 1.84%, Payout Ratio: 31.79%, 5-Year Growth Rate: 26.31%
TSCO ranks as the largest consumer farm specialty retailer in the United States. Over the last three years, TSCO generated a CAGR in sales and EPS of 17% and 26%, respectively.
The firm’s e-commerce sales have grown at a double-digit rate or better for 39 consecutive quarters.
Tractor Supply still has room for store growth, and management guides for EPS growth in the range of 8% to 11% over the next decade.
S&P rated TSCO’s debt as BBB stable, and Morningstar rates TSCO as having a narrow moat.
I hold a position in the stock, but do not believe it is trading at a favorable valuation at this juncture.
FAST Graphs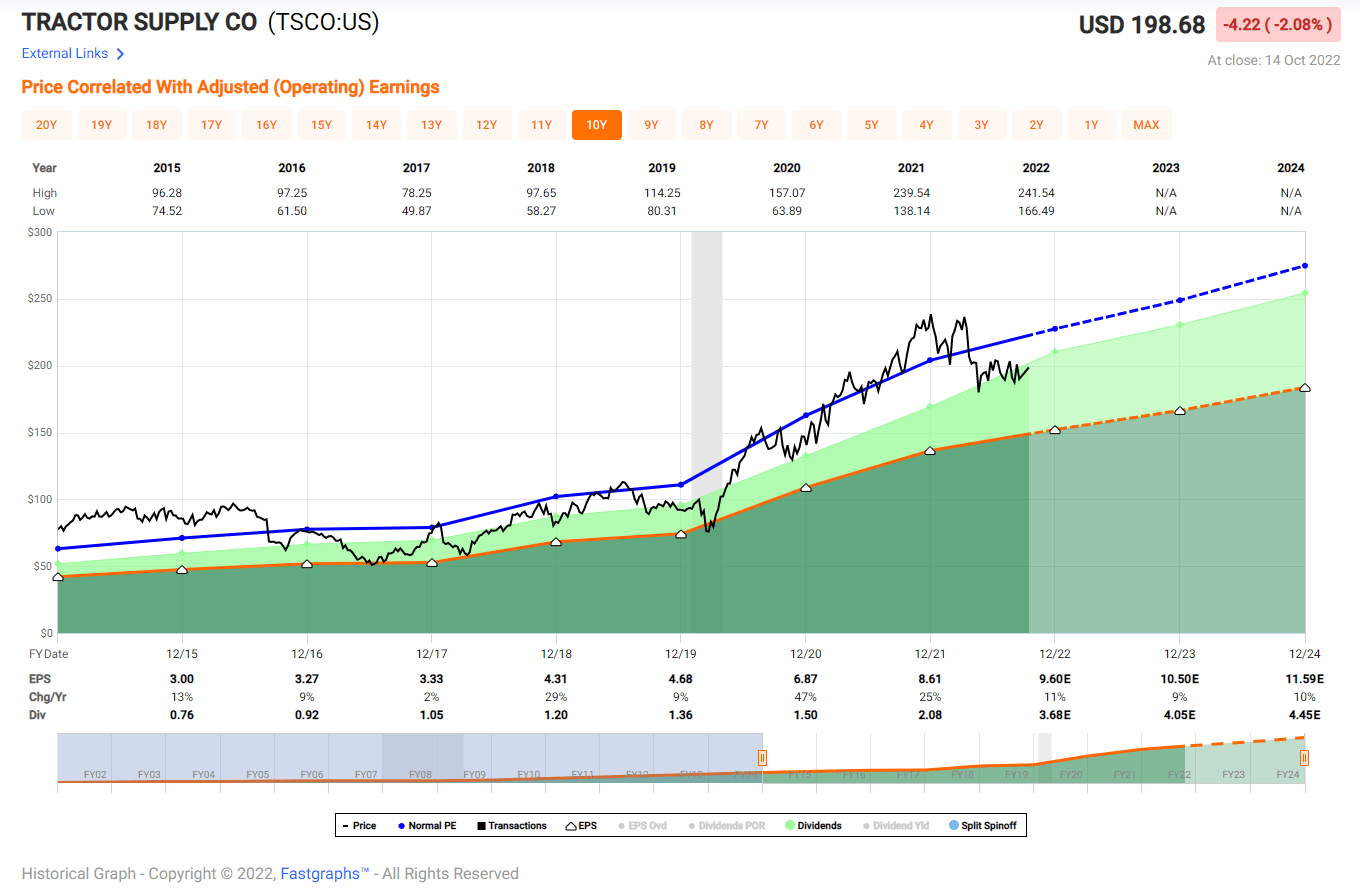
Conclusion
Assuming one invested an equal sum in each of the highlighted stocks, the portfolio would provide a yield of roughly 2.6%. The average payout ratio would stand at just over 37%, but that would decline to under 31% if the REIT is not included.
The average 5-year dividend growth rate for the portfolio stands at a hair under 16%. Using the rule of 72, and assuming that dividend growth rate remains the same, we would have an average yield on cost of over 5% in less than 5 years.
With the exception of Williams-Sonoma (that company’s debt is not followed by the rating agencies), every company has investment grade debt ratings. Furthermore, Morningstar ranks each of the stocks as possessing either a narrow or wide moat.
Author’s note: Brad Thomas is a Wall Street writer, which means he’s not always right with his predictions or recommendations. Since that also applies to his grammar, please excuse any typos you may find. Also, this article is free: Written and distributed only to assist in research while providing a forum for second-level thinking.
Be the first to comment