This article was originally published to members of the CEF/ETF Income Laboratory on June 25th, 2022.
It has been quite a volatile year. It seems so much is going on that I’ve not taken the time to provide an update on what the top ten positions are in my own closed-end fund portfolio.
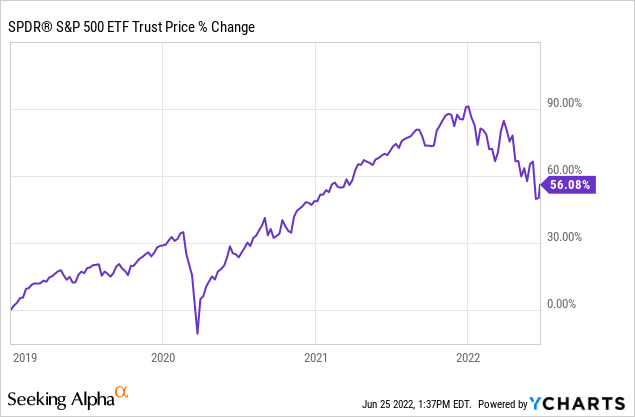
Unfortunately, the markets haven’t been cooperating, so the actual performance is the opposite of what we saw in the last few years. Aside from the sharp and rapid rebound in March 2020, investors have been quite spoiled the last few years. So seeing some of this unwind as markets were quite lofty isn’t overly unexpected. Here’s the performance of the SPDR S&P 500 ETF (SPY) from the first of 2019 to today.
Ycharts
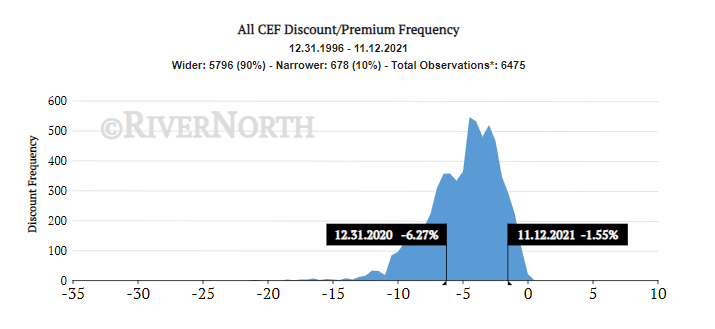
To add to this, specifically for CEFs, they also have to contend with premiums and discounts. In 2021, we were seeing historically narrow discounts across the board. Here’s a portion of the previous article.
More broadly, the closed-end fund market remains tightly valued. Discounts have sunk considerably this year. Undoubtedly, that has helped provide a significant boost to my overall performance for the year.
CEF Premium/Discounts (RiverNorth)
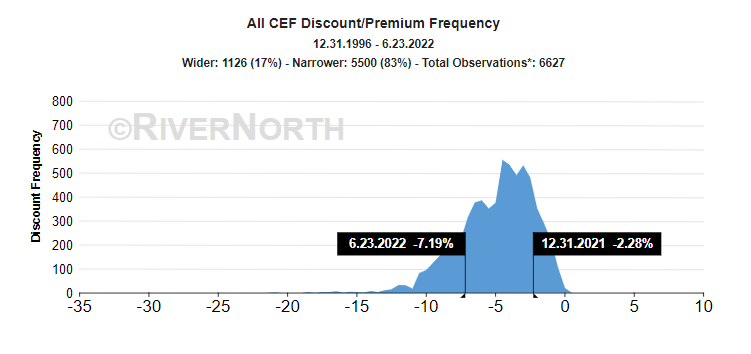
What we saw at that time is that the average discount of a CEF came to 1.55%. This was only more narrow than 10% of the time since 1996. As of June 23rd, 2022, the average discount is sitting at 7.19%. This now represents a time when discounts were only ever wider 17% of the time. That means there are definitely opportunities in the CEF space.
CEF Premium/Discounts (RiverNorth)
However, it could continue to be a volatile and bumpy ride. I wouldn’t expect the remainder of the year to be particularly smooth as long as the Fed continues to raise rates.
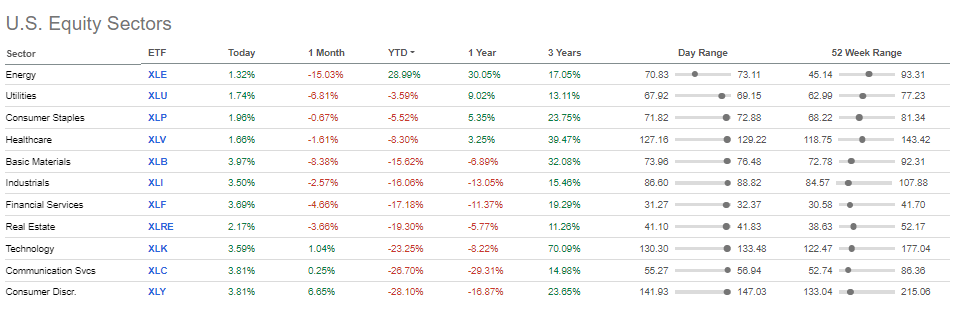
One of the areas that have been positive is the energy sector. However, even the energy sector had gone into a bear market. Despite this, the strong gains from the beginning of the year were still enough to leave the sector in the green. The only green sector at this time as utilities had pulled back.
US Equity Performance (Seeking Alpha)
Interestingly, last year, we were discussing how utilities were the laggard. It was one area that I thought could perform well this year.
The utility sector has been a bit of a struggle this year but is still green for the year. I believe that my more overweight exposure to several utility funds had hurt my portfolio. Still, for the sake of transparency, my total closed-end fund portfolio is up 23.07% YTD as of October 31st, 2021. At least, that is what Fidelity tells me. It also shows that the S&P 500 was up 24.04% as of the same period. The Dow Jones U.S. Total Stock Market Index was up 22.87%, and MSCI ACWI ex USA climbed 8.57%.
Talking about “a struggle” last year to this year means completely different things. At that time, every sector was in the green, and a struggle was that it wasn’t as green as the other sectors. Now, a struggle this year is just trying to stay positive. Those utilities that were hurting my performance last year have been helping this year.
Heading into this year, BlackRock Sciences & Technology Trust II (BSTZ) was my largest holding. That certainly hurt heading into this year. Despite adding to my position, we’ll see that it has still slipped from my largest allocation.
More broadly, my CEF portfolio shows a -12.05% return YTD through May 31st, 2022. Fidelity also shows that the S&P 500 Index was -12.76% at that time. The Dow Jones U.S. Total Stock Market Index was showing -14.11%, and the MSCI ACWI ex USA declined by -10.65%. Bonds haven’t been anywhere to hide as Bloomberg U.S. Aggregate Bond Index had fallen by -8.92% and the Bloomberg Municipal Bond Index even declined by -7.47%.
With that, I can’t say I’m too disappointed because the performance in the portfolio is also going to have factored in the rapid expansion of discounts in the CEFs. My main goal isn’t to beat the market, as I know many others try. Instead, I do focus more on income generation. Beating the market can be just a bonus sometimes.
Top 10 CEFs And Portfolio Composition
At this time, there are a total of 44 CEFs in this portfolio, up from the 43 positions I had previously. As was the case previously, this is only a focus on my CEF portfolio. Cohen & Steers Quality Income Realty Fund (RQI) is in a top position here. However, it would be my largest position if I also included the weighting in another account. It’s my largest position overall.
This also doesn’t include five other CEFs that I hold that are in another account where I am more active/speculative. That’s where I hold my CLO funds.
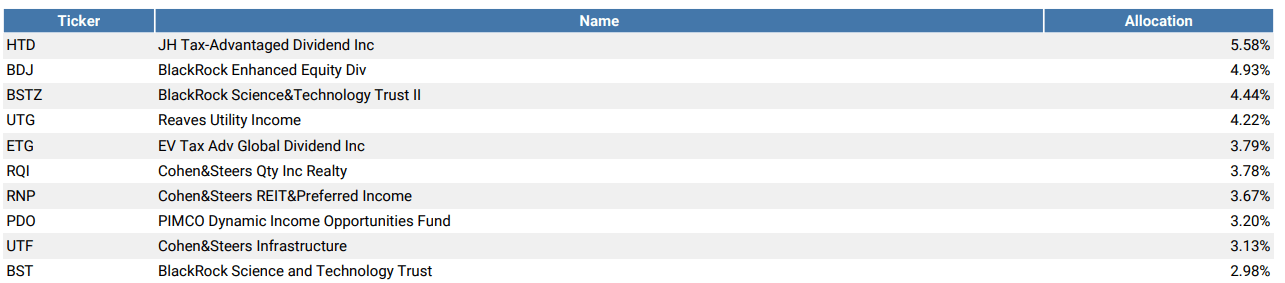
With that, here are the top ten.
Top Ten Holdings (Portfolio Visualizer)
The top ten represent 39.72% of this portfolio. This was down from the 43.67% it had previously.
As we can see, BSTZ has fallen from the lofty 7.29% weighting the fund carried before. John Hancock Tax-Advantaged Dividend Income Fund (HTD) increased its allocation and rose to the top to take over 5.58% of my portfolio weighting. A primary result of the fund just holding up significantly better, thanks to the utility exposure.
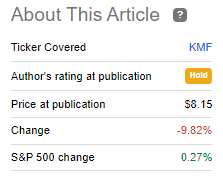
Another fairly noteworthy change has been the removal of Kayne Anderson NextGen Energy & Infrastructure Inc (KMF). I had shared this previously, but it wasn’t just removal from my largest weighting, but from my portfolio entirely. Energy had been becoming a larger and larger portion of my portfolio. I have other energy/infrastructure hybrid funds that I hold too. KMF seemed the best candidate to get rid of at the time.
At least at this very point, it was good timing (lucky timing) to lighten up on some energy. It ran up a bit higher, but then the bear came calling.
KMF Performance Since Article (Seeking Alpha)
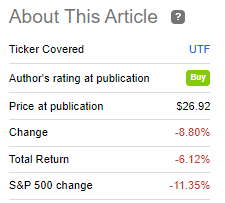
Another new name to my portfolio was welcoming Cohen & Steers Infrastructure Fund (UTF) back into the portfolio. Once again, I view it as a core position in my portfolio, but even core positions need to go if they get too elevated. I highlighted this earlier when I added it back. That was in February. So in hindsight (unlucky timing), we can see that I was too early to get back in.
UTF Performance Since Article (Seeking Alpha)
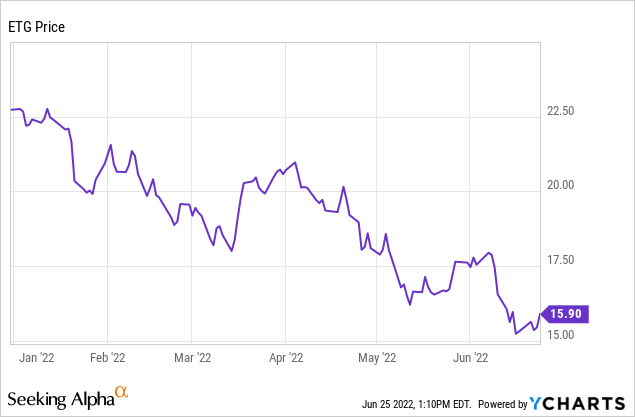
Eaton Vance Tax-Advantaged Global Dividend Income Fund (ETG) has also crept up to a top ten position for me since the last update. I added to this fund twice since the last top ten update. Once was in February, then again in May.
Both times were when the market and subsequently ETG made new lows for the year. We then hit newer lows yet again in June after the Fed spoke. So I’d say possibly poor timing on those buys again. I still think that the discount and overall declines make ETG a solid choice if one expects the market to recover someday.
Ycharts
Finally, some quick notes on the unloved PIMCO Dynamic Income Opportunities Fund (PDO). This fund is one that I’ve added to recently pretty aggressively. However, it was a position in my portfolio previously. It was a fairly large allocation, too – just not enough to make it a top ten. With the latest batch of shares picked up, it has pushed it up enough for a top ten position.
I very recently updated my overall thoughts on PDO. Basically, its portfolio is significantly beaten up, and the fund’s discount is enormous. The income keeps coming in with incredibly strong coverage. I believe those points alone make it a buy.
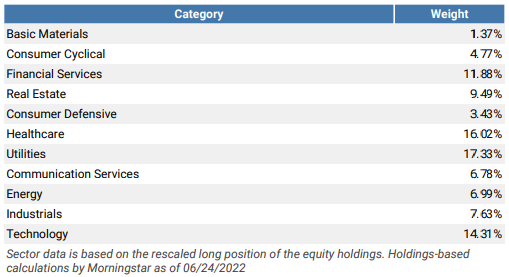
Looking quickly at the top sector weightings, utilities, healthcare, financial services and technology still make up the largest allocations. Utilities and healthcare have actually climbed in weight, while technology and energy have been reduced. The energy exposure was reduced by dropping KMF, and the technology exposure was decreased due to performance. At the same time, I was adding to some tech positions, so it hasn’t been a meaningful decline.
Sector Weightings (Portfolio Visualizer)
I’m comfortable with my weightings now, but I wouldn’t mind adding more to my real estate allocations in this portfolio. Since I hold a significant position in RQI in another account, my overall real estate exposure will be higher than shown here.
Additionally, I hold Realty Income (O), Agree Realty (ADC), National Retail Properties (NNN) and STAG Industrials (STAG) in another portfolio. That adds significantly to my REIT/real estate exposure overall. Meaning that more of my capital is tied up in real estate than is shown here. I believe adding more at this time could still be worthwhile while it is beaten down.
Conclusion
I had intentions of wanting to update my personal top ten holdings every quarter or so. With 2022’s wild market, time seems to have slipped away from me. I hope this is a helpful piece that generates some ideas for other investors!
Please note that foreign exchange and other leveraged trading involves significant risk of loss. It is not suitable for all investors and you should make sure you understand the risks involved, seeking independent advice if necessary.


Be the first to comment