

Chiyacat/iStock via Getty Images
Earnings of Tompkins Financial Corporation (NYSE:TMP) will likely continue to remain flattish this year. The margin will likely start to expand once the up-rate cycle is over; therefore, the margin will support earnings later this year. Further, subdued loan growth will support the bottom line. On the other hand, inflation-driven growth in non-interest expenses and provision normalization will drag earnings. Overall, I’m expecting Tompkins Financial to report earnings of $6.08 per share for 2023, up 2% from my estimated earnings of $5.97 per share for 2022. The year-end target price is quite close to the current market price. Therefore, I’m adopting a hold rating on Tompkins Financial Corporation.
Margin Likely to Improve in the Second Half of the Year
Tompkins Financial Corporation’s net interest margin dipped by two basis points in the third quarter, which is not surprising given the balance sheet positioning. The company’s deposit mix is geared towards adjustable-rate deposits that reprice frequently. These deposits, including interest-bearing checking, savings, and money market accounts, made up 58.8% of total deposits at the end of September 2022. In fact, far more liabilities (including deposits) than assets are scheduled to reprice within a year. According to details given in the 10-Q filing, liabilities that will reprice are $521 million more than the assets that will reprice in a year. This gap represents 6.7% of total assets.
The results of the management’s interest-rate simulation model show that a 200-basis points hike in interest rates could decrease the net interest income by 3.6% over twelve months, as mentioned in the 10-Q filing. Therefore, the margin can be expected to continue to decline till the end of the up-rate cycle. However, once the cycle is over, the margin is likely to bounce back up as the bulk of the liability repricing will be over soon while assets will continue to reprice. I’m expecting the fed funds rate to rise by a further 75 basis points till the mid of 2023 and then plateau in the second half of the year.
Another factor that will affect the margin is loan growth. Due to the recent rate hikes, Tompkins will add new loans at higher rates than the portfolio average. Therefore, the average portfolio yield will rise as new loans are added. Considering these factors, I’m expecting the margin to remain somewhat stable through the mid of this year and then rise by ten basis points in the back half of the year.
Loan Growth Likely to Remain Low
Tompkins Financial Corporation’s loan growth has been quite low in the first nine months of 2022. The portfolio grew by 2.6% in the first nine months, or 3.5% annualized, which is not that bad considering the company’s history. High-interest rates will likely continue to put a damper on loan demand, especially residential mortgage loans as they’re highly dependent on borrowing costs. As of the end of September 2022, residential loans made up a sizable 29% of total loans; therefore, weaknesses in this segment will have a material impact on total loan growth.
On the other hand, strengthening economic activity can help support commercial loan growth. Tompkins Financial services businesses and customers in New York and Pennsylvania. Both states are currently seeing good economic recovery. As shown below, the economic activity coincident indexes for both states are currently steeper than the national average.
The Federal Reserve Bank of Philadelphia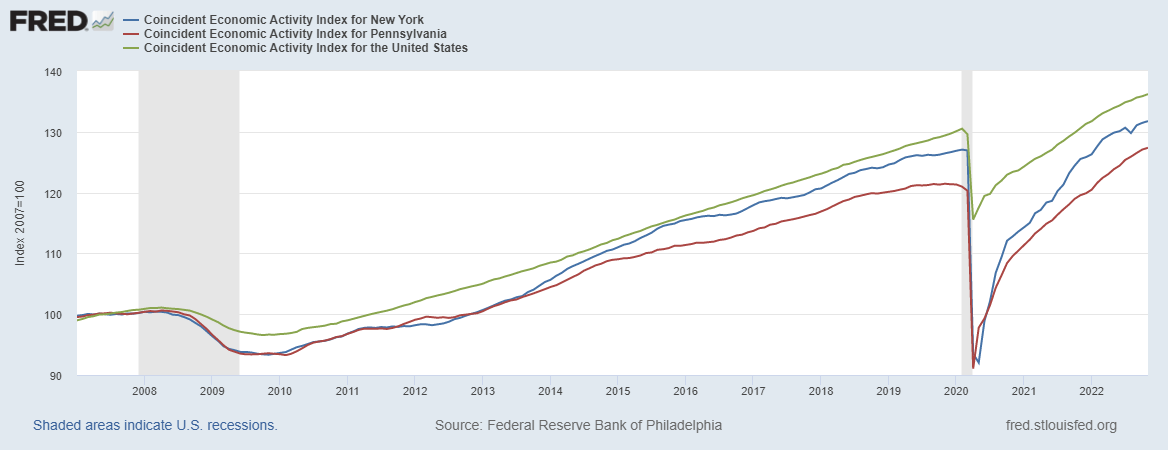
Considering these factors, I’m expecting the loan portfolio to have grown by 0.75% in the last quarter of 2022, taking full-year loan growth to 3.4%. For 2023, I’m expecting the portfolio to grow by 3.0%. Further, I’m expecting deposits to grow in line with loans. The following table shows my balance sheet estimates.
| Financial Position | FY18 | FY19 | FY20 | FY21 | FY22E | FY23E |
| Net Loans | 4,791 | 4,878 | 5,209 | 5,033 | 5,202 | 5,360 |
| Growth of Net Loans | 3.5% | 1.8% | 6.8% | (3.4)% | 3.4% | 3.0% |
| Other Earning Assets | 1,476 | 1,301 | 1,995 | 2,369 | 2,153 | 2,219 |
| Deposits | 4,889 | 5,213 | 6,438 | 6,791 | 6,989 | 7,201 |
| Borrowings and Sub-Debt | 1,175 | 735 | 344 | 191 | 158 | 162 |
| Common equity | 619 | 662 | 716 | 728 | 544 | 576 |
| Book Value Per Share ($) | 40.9 | 44.2 | 48.6 | 49.7 | 37.8 | 40.1 |
| Tangible BVPS ($) | 34.3 | 37.6 | 42.0 | 43.1 | 31.2 | 33.4 |
| Source: SEC Filings, Author’s Estimates(In USD million unless otherwise specified) | ||||||
Earnings Likely to be Flattish
The subdued loan growth and late margin expansion will likely support earnings this year. On the other hand, inflation will drive up operating expenses, which will restrict earnings growth. Further, the tight labor markets in New York and Pennsylvania will lead to wage pressures, thereby raising operating expenses and dragging earnings. Meanwhile, I’m expecting the provisioning for expected loan losses to remain near a normal level. I’m expecting the net provision expense to make up 0.08% of total loans in 2023, which is close to the average from 2017 to 2019.
Overall, I’m expecting Tompkins Financial to report earnings of $5.97 per share for 2022, down 1% year-over-year. For 2023, I’m expecting earnings to grow by 2% to $6.08 per share. The following table shows my income statement estimates.
| Income Statement | FY18 | FY19 | FY20 | FY21 | FY22E | FY23E |
| Net interest income | 212 | 211 | 225 | 224 | 231 | 239 |
| Provision for loan losses | 4 | 1 | 17 | (2) | 2 | 4 |
| Non-interest income | 77 | 75 | 74 | 79 | 80 | 84 |
| Non-interest expense | 181 | 182 | 184 | 190 | 196 | 205 |
| Net income – Common Sh. | 81 | 80 | 77 | 89 | 86 | 87 |
| EPS – Diluted ($) | 5.35 | 5.37 | 5.20 | 6.05 | 5.97 | 6.08 |
| Source: SEC Filings, Earnings Releases, Author’s Estimates(In USD million unless otherwise specified) | ||||||
My estimates are based on certain macroeconomic assumptions that may not come to fruition. Therefore, actual earnings can differ materially from my estimates.
Current Market Price is Close to the Year-End Target Price
Tompkins Financial has increased its quarterly dividend in the last quarter of the year, every year in the last decade. Given the earnings outlook, it’s likely that the company will maintain the dividend trend this year. Therefore, I’m expecting the company to increase its dividend by $0.03 per share to $0.63 per share in the fourth quarter of 2023. The earnings and dividend estimates suggest a payout ratio of 40% for 2023, which is in line with the five-year average of 41%. Based on my dividend estimate, Tompkins Financial is offering a forward dividend yield of 3.2%.
I’m using the historical price-to-tangible book (“P/TB”) and price-to-earnings (“P/E”) multiples to value Tompkins Financial. The stock has traded at an average P/TB ratio of 1.88x in the past, as shown below.
| FY19 | FY20 | FY21 | Average | |||
| T. Book Value per Share ($) | 37.6 | 42.0 | 43.1 | |||
| Average Market Price ($) | 80.8 | 68.7 | 79.7 | |||
| Historical P/TB | 2.15x | 1.64x | 1.85x | 1.88x | ||
| Source: Company Financials, Yahoo Finance, Author’s Estimates | ||||||
Multiplying the average P/TB multiple with the forecast tangible book value per share of $33.4 gives a target price of $62.8 for the end of 2023. This price target implies a 16.7% downside from the January 10 closing price. The following table shows the sensitivity of the target price to the P/TB ratio.
| P/TB Multiple | 1.68x | 1.78x | 1.88x | 1.98x | 2.08x |
| TBVPS – Dec 2023 ($) | 33.4 | 33.4 | 33.4 | 33.4 | 33.4 |
| Target Price ($) | 56.1 | 59.5 | 62.8 | 66.2 | 69.5 |
| Market Price ($) | 75.4 | 75.4 | 75.4 | 75.4 | 75.4 |
| Upside/(Downside) | (25.6)% | (21.1)% | (16.7)% | (12.3)% | (7.8)% |
| Source: Author’s Estimates |
The stock has traded at an average P/E ratio of around 13.8x in the past, as shown below.
| FY19 | FY20 | FY21 | Average | |||
| Earnings per Share ($) | 5.37 | 5.20 | 6.05 | |||
| Average Market Price ($) | 80.8 | 68.7 | 79.7 | |||
| Historical P/E | 15.1x | 13.2x | 13.2x | 13.8x | ||
| Source: Company Financials, Yahoo Finance, Author’s Estimates | ||||||
Multiplying the average P/E multiple with the forecast earnings per share of $6.08 gives a target price of $84.0 for the end of 2023. This price target implies an 11.4% upside from the January 10 closing price. The following table shows the sensitivity of the target price to the P/E ratio.
| P/E Multiple | 11.8x | 12.8x | 13.8x | 14.8x | 15.8x |
| EPS 2023 ($) | 6.08 | 6.08 | 6.08 | 6.08 | 6.08 |
| Target Price ($) | 71.8 | 77.9 | 84.0 | 90.1 | 96.2 |
| Market Price ($) | 75.4 | 75.4 | 75.4 | 75.4 | 75.4 |
| Upside/(Downside) | (4.8)% | 3.3% | 11.4% | 19.4% | 27.5% |
| Source: Author’s Estimates |
Equally weighting the target prices from the two valuation methods gives a combined target price of $73.4, which implies a 2.7% downside from the current market price. Adding the forward dividend yield gives a total expected return of 0.6%. Hence, I’m adopting a hold rating on Tompkins Financial Corporation.
Be the first to comment