

Ordinarily, an inversion would be caused after multiple hikes – with the 2yr yield climbing along with the Fed Funds rate – as the Fed attempts to drain liquidity and cool an overheated economy. However, this temporary inversion was caused by an exogenous event – the Bank of Japan. The BoJ intervened aggressively earlier this week to defend the 0.25% yield cap by offering to “buy an unlimited amount of government bonds for the first four days of this week.”
Reuters:
Under pressure from a steady rise in yields, the BOJ launched its defence by making two offers in a single day to purchase 10-year Japanese government bond (JGB) in unlimited amounts at 0.25%.
The central bank then said it would make the same unlimited offer for the next three days, to make sure investors received the message loud and clear, but some economists believed the central bank’s grip on yield curve control was at risk of slipping.
“Markets may more forcefully test the BOJ’s resolve to defend the 0.25% ceiling, which may prompt the bank to modify its approach and allow the 10-year yield to rise more.”
The BOJ’s first offer for unlimited bond buying in the morning failed to prevent the 10-year JGB yield from hitting a six-year high of 0.250% on Monday – the level the bank has set as an implicit cap around its yield target.
“Markets are putting the BOJ to test, so the central bank has no choice but to keep offering unlimited bond buying,” said Takafumi Yamawaki, head of Japan fixed income research at JPMorgan Securities.
“If yields are allowed to move above 0.25%, investors will think the BOJ has tolerated a rise above that level. That makes it harder for the BOJ to carry on with yield curve control.”
Under yield curve control (YCC), the BOJ pledges to guide the 10-year JGB yield around 0% as part of efforts to stimulate the economy by keeping borrowing costs low.
So what does this have to do with our inversion? In recent weeks’ notes I have made the case that the Fed needs to shift to balance sheet roll-off to drain liquidity OVER more aggressive rate hikes. In other words, they could cool the economy and re-steepen the curve (extend the cycle by multiple years – as lending is incentivized when the curve is steeper) by doing modest hikes (25bps per meeting) and selling long-duration Treasuries on the open market to sop up liquidity.
Opponents of this view fear that yields on the long end of the curve would blow out beyond control and our borrowing costs would become unsustainable. I have repeatedly made the case that foreign demand would step in in major size between 2.25% and 2.50% on the 10yr. Tuesday’s action was clear evidence of this thesis. As managers’ yields were capped by the BoJ, foreign demand flowed into US Treasuries at ~2.50% and led to an exogenous cap in the long end of our curve. Simultaneously, “50bps hike” rhetoric – from several of the impatient and emotional “day traders” sitting on our Federal Reserve (FOMC) – caused the temporary inversion (which did not hold on a closing basis). The FOMC needs to have a little patience on the hikes (as they have so far) because at the end of the day:
-Are 50bps hikes going to make more semi-conductor chips and ease up the supply chain?
-Are 50bps hikes going to stop Covid-19 in Asia so that the factories can stay open 24/7 to meet demand?
-Are 50bps hikes going to cause a negotiated settlement between Russia and Ukraine?
-Are 50bps hikes going to cause our diplomats to complete an effective deal with Iran to bring more supply online?
-Are 50bps hikes going to make this Administration complete the Keystone pipeline?
-Are 50bps hikes going to make this Administration issue more leases to drill on Federal land – as producers have done freely in the past?
-Are 50bps hikes going to incentivize our major banks to lend to our energy producers – when ESG managers/pension funds force them to limit lending to energy producers?
-Are 50bps hikes going to bring more supply of labor online and make more Americans re-enter the workforce (and cool rising wages) – when there are already 11.26M job openings unfilled?
If the answer to these questions (the primary causes of inflation) is NO, what is the purpose of hiking too fast, causing an inversion, and forcing the country into recession just 2.5 years after the last recession – OTHER than to pretend it’s going to bring down prices at the pump (and increase approval ratings/consumer confidence) before the mid-term elections? News flash, it’s not. You can’t create oil with monetary policy. Only effective Executive Orders that allow energy producers to do what they do best will work.
10yr German bunds have gone from -0.10% yields to +.74% yields in 4 weeks. Our Fed’s policy is wreaking havoc on central banks around the world as they scramble to hold yields down. Expect more and more foreign central banks to follow the path of BoJ and institute yield curve control in coming weeks and months. This will drive demand for longer duration U.S. Treasuries and give our Fed (if they are smart) the opportunity to lay off some of the balance sheet holdings and move MORE slowly with the short end of the curve hikes. When the ducks are quacking, feed them…
It’s an opportunity to “stick save” the inversion (as they did in 1994) and extend the cycle by a few more years.
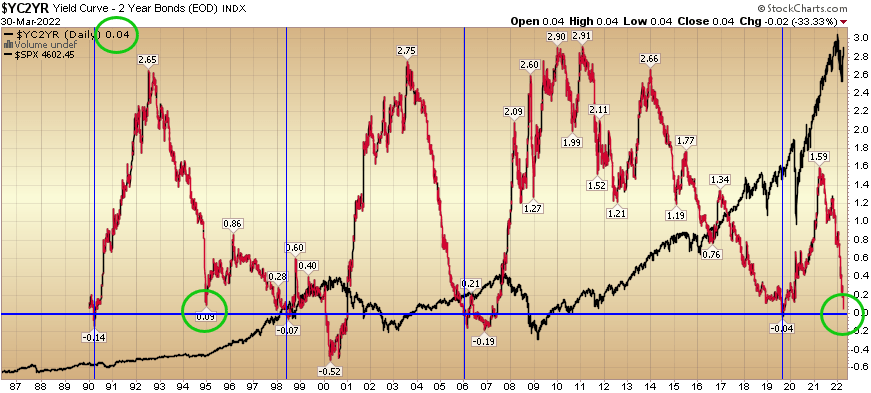
StockCharts.com
So was Tuesday an actual inversion (that usually happens naturally at much higher levels – after multiple hikes – implying the intended slowing has worked) or is it a head fake due to the BoJ temporarily forcing managers to more attractive horizons in their demand for yield?
We lean to the latter, BUT even if it were the former (a clear inversion) it would not change our positioning or our outlook for the equity markets in the near term (next ~6-9 months). What was a minority view that we put out publicly a few weeks ago when hedge funds were in the middle of their most aggressive selling (in the whole) since 2008, is still our base case: We believe the market will work its way to new highs in coming months.
9 Reasons To Stay The Course – For Now
Sagarika Jaisinghan, a reporter from Bloomberg, reached out to ask me the following question on Wednesday:
“Why are stock markets appearing so sanguine despite the fact that the Ukraine conflict is far from over and at a time when surging costs are threatening profit margins?”
To which I replied with these nine points:
The number one reason the markets are sanguine is because earnings keep going up! 2022 estimates hit $227.32 this week up from ~$225 a month ago. Companies are passing costs onto consumers. Positioning just three weeks ago among hedge funds and institutions was its most pessimistic since 2008. Now they have to chase.
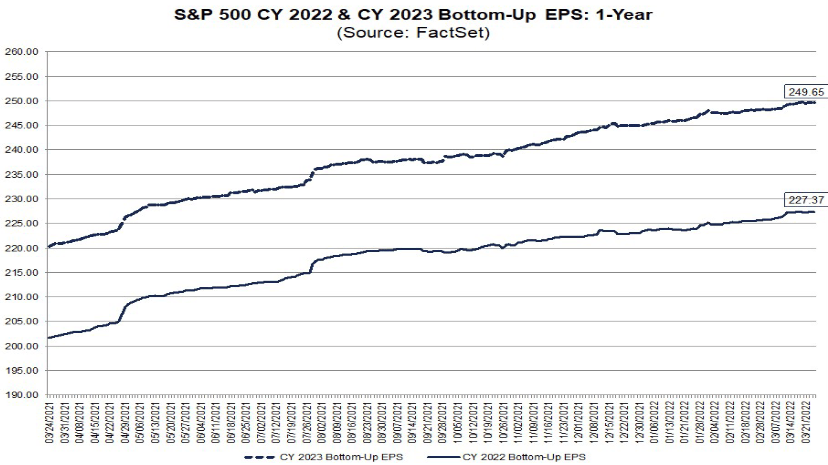
Factset
Many indicators are starting to point to an alleviation of inflation:
1) Commercials are starting to sell grains (COT report).
2) Russia has limited its focus to the Donbas region – which will likely result in a negotiated settlement.
3) US rig count continues to climb.
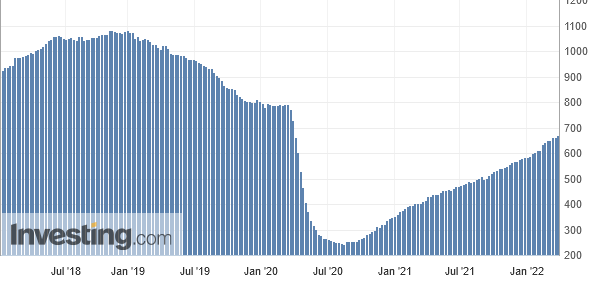
Investing.com
4) Consumers are shifting spending from goods to services (“revenge travel!”) which has alleviated some of the supply chain bottlenecks.
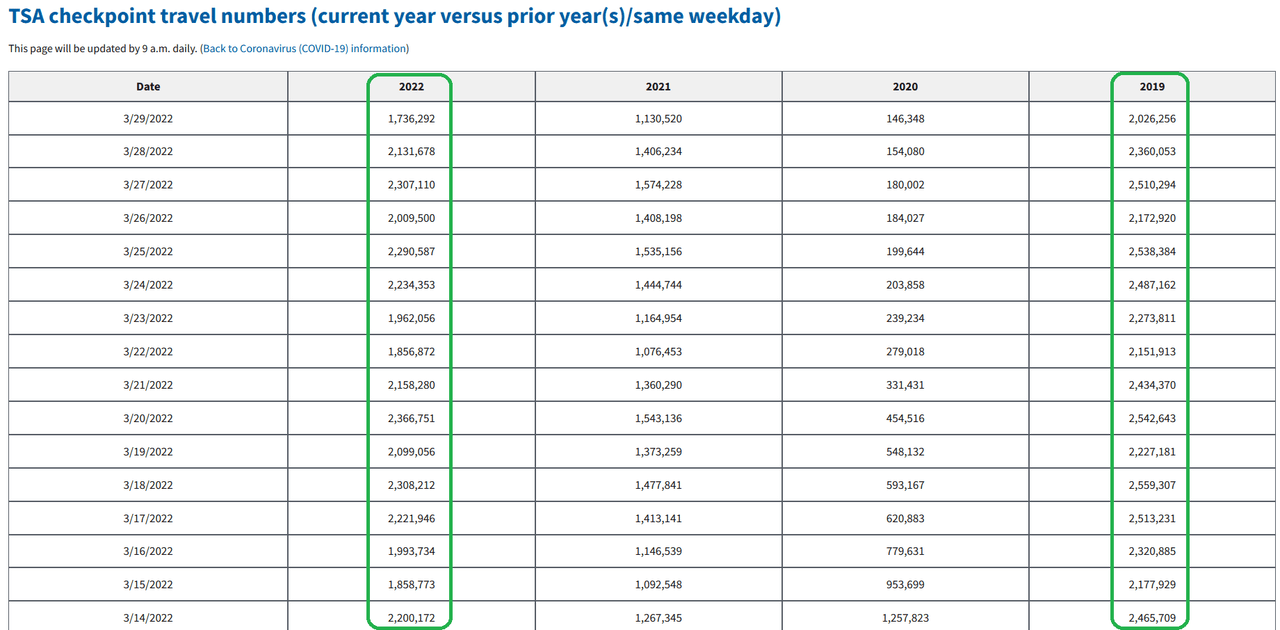
TSA
5) Cass Freight Index has rolled over pointing to a drop in inflation for 2H:
6) China is engaged in one of its most aggressive fiscal and monetary EASING periods in years (started in November). The CCP will do whatever is required to juice the economy and stock market prior to the China National Congress transition meeting in November – just as they do every five years (average return of MSCI China in the 12 months leading into the CNC meeting is ~31%).
7) The 2/10 spread has not yet inverted on a closing basis.
8) Once a negotiated settlement is reached with Russia/Ukraine an Iran nuclear deal will be reached with the US. This will put 1-1.8M/bpd back on the market within six months.
9) Last month’s jobs report showed average hourly earnings start to come in lower than estimated. We expect that will be the same this Friday. As labor supply comes back online, wages will stop going up so aggressively and cool some of the overheating.
Managers will have to continue to “panic buy” equities in coming weeks as they got too pessimistic in their February/March positioning.
Fox Business
On Friday I joined Lauren Simonetti on Fox Business – The Claman Countdown – to discuss whether we were headed toward a recession. Thanks to Ellie Terrett, Lauren and Liz Claman for having me on.
Here were my show notes ahead of the segment:
“Are we headed for a recession and how long will it take?”
-Our base case is that we are not headed for a recession.
-However, we do NOT have to predict it as the market will notify us with ample time when we will have a recession. It will be signaled by an inversion of the 2/10 spread of US Treasuries – which will disincentivize banks to extend credit and force the economy into a recession.
-The Fed can avoid an inversion by focusing on balance sheet run-off starting in May versus faster rate hikes. Sell off longer-duration treasuries and keep short-end of curve modestly rising will re-steepen the yield curve and extend the cycle for another few years.
-In the last handful of cycles, the yield curve inversion (while predicting a recession) has often been a BUY signal for as the peak in the markets comes on average 6-18 months AFTER the inversion. Also, the steepest part of the equity rally is often those last 12 months – AFTER inversion and before the recession.
-The reason for this is because everything works on a LAGGED basis. Just as it takes 6-9 months to feel the effect of STIMULUS in the economy, it takes 6-9 months to feel the effect of tightening on the real economy – which is why the Fed often overshoots.
For now, the economy is hitting on all cylinders:
–Unemployment still at 3.8%. 6.3M unemployed vs. 5.7M pre-pandemic.
–Earnings continue to GROW! Despite the recession fears, 2022 estimates for the S&P 500 are up to $227.32 vs ~$225 a month ago.
–Record buyback authorizations for 2022 > ~$1.3T with fortified balance sheets from pandemic bond issuance. GDP above trend ~3.5-4%.
We like:
AOS: A.O. Smith – despite mortgage rates rising – there is still housing shortage (1 month of inventory) due to 72.1M millenials – averaging age 31 – and starting housing/family formation.
-A.O. Smith makes residential and commercial water heaters and boilers.
-Trades at 17.5x next year’s earnings which is below its decade average multiple of 20x.
–Trading 25% off its recent highs, and has compounded capital (Return on invested capital) at mid-teens per year over the past decade.
MMM: Diversified manufacturer (Safety & Industrial) (Transportation & Electronics) (Healthcare) (Consumer). Took a hit on supply chain issues and mask demand declining fears. Trading off ~25% from it’s 52 week highs.
-Trades at 13.5x next year’s earnings which is below its decade average multiple of ~18.5x.
-Another compounder whose ROIC has averaged over 20% per year for the past decade.
-A bargain at these levels…
Cheddar News
On Monday Morning I joined Alicia Nieves on Cheddar News’ “Opening Bell” to discuss the Stock Market, Inflation, Oil, etc. Thanks to Ally Thompson, Jovan Collins and Alicia for having me on.
Watch the above for analysis on why oil may have peaked in the near term – as well as a detailed (unconventional) view on inflation.
Yield Curve
In recent days, a lot of ink has been spilled on what the yield curve inversion means. Assume that the momentary intra-day inversion captured above COUNTS as full inversion (despite the exogenous events we described above). What happens next?
Marketwatch
Information quoted below was published by William Watts:
“While a good indicator of future economic woes, an inverted yield curve has not been a very good timing tool for equity investors,” wrote Brian Levitt, global market strategist at Invesco
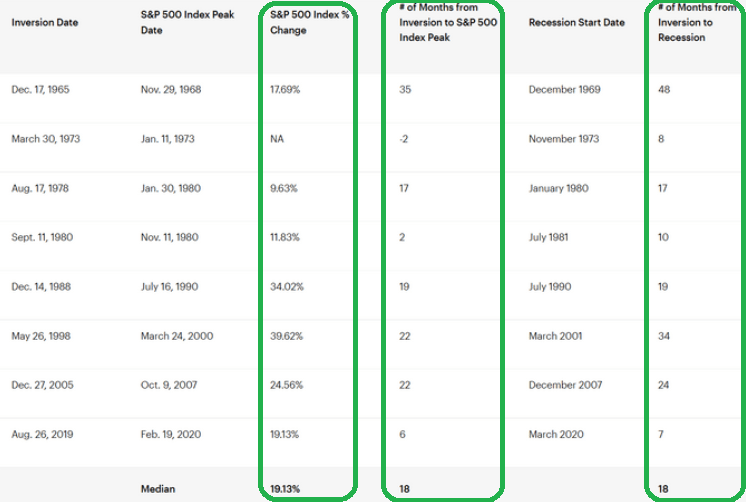
“For example, investors who sold when the yield curve first inverted on Dec. 14, 1988, missed a subsequent 34% gain in the S&P 500 index,” Levitt wrote. “Those who sold when it happened again on May 26, 1998, missed out on 39% additional upside to the market,” he said. “In fact, the median return of the S&P 500 index from the date in each cycle when the yield curve inverts to the market peak is 19%. (see table above) Levitt noted that the data, going back to 1965, show the median length of time between an inversion and a recession has been 18 months — matching the median stretch between the onset of an inversion and an S&P 500 peak.
“The 3-month/10-year spread is seen as even, if only slightly, more reliable and has been more popular among academics, noted researchers at the San Francisco Fed. Some economists argue that the Fed’s bond-buying program has artificially held down long-term yields, distorting the signal from the yield curve.”
“And Fed Chairman Jerome Powell earlier this month expressed a preference for a more short-term oriented measure that measures 3-month rates versus expectations for 3-month rates 18 months in the future. The 3-month/10-year spread, meanwhile, is “far from inverted,” Mayfield noted.
“First, recession or no, stocks can do well immediately after an inversion; the average 12-month S&P 500 return in such cases is 11%. Second, a 2018 study by the Federal Reserve Bank of San Francisco found that the part of the curve between three-month and 10-year yields has the most predictive power, and it’s still a steep climb. Mayfield“
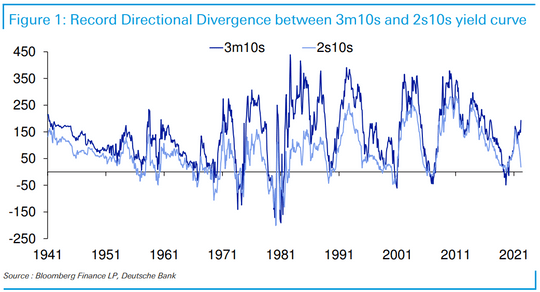
“The remarkable thing is that the two have always gone hand in hand directionally until around December 2021 when 3m/10s started to steepen as 2s/10s collapsed,” said Jim Reid, strategist at Deutsche Bank, in a Tuesday note (see chart below).
Bloomberg
“Another closely monitored part of the curve has been giving off a different signal: The spread between the yield on three-month Treasury bills and 10-year notes this month has been widening , causing some to doubt a recession is imminent.
Meanwhile, the two-year/10-year yield curve has technical issues, and not everyone is convinced the flattening curve is telling the true story. They say the Fed’s bond buying program of the last two years has resulted in an undervalued U.S. 10-year yield that will rise when the central bank starts shrinking its balance sheet, steepening the curve.”
Bloomberg
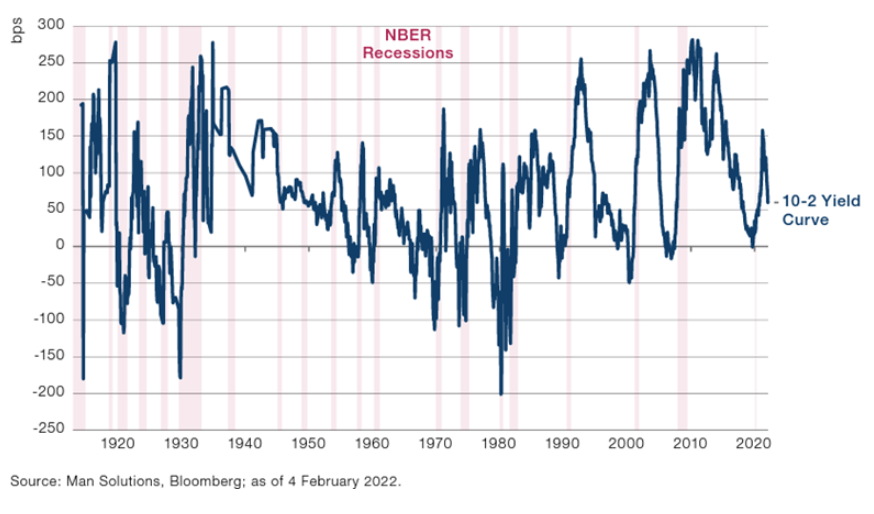
“It is widely believed that an inverted yield curve is a harbinger of recession. There have been 28 instances since 1900 where the yield curve has inverted; in 22 of these episodes, a recession has followed, including the fleeting inversion in 2019 followed by the COVID-induced recession in 2020.
While yield curve inversion might be a reliable indicator of a recession on the horizon, it isn’t a very reliable market timing tool. The lag between curve inversion and the start of a recession has averaged about 22 months but has ranged from 6 to 36 months for the last six recessions. What’s more, even when the yield curve inverts, it’s a poor signal for getting out of risk assets such as equities. Late cycle is not the same as end of cycle, and equities may continue to offer positive returns. In the six episodes of yield curve inversion since 1975, global equities have, in aggregate, risen in the 12-month period after the inversion.”
Now onto the shorter term view for the General Market:
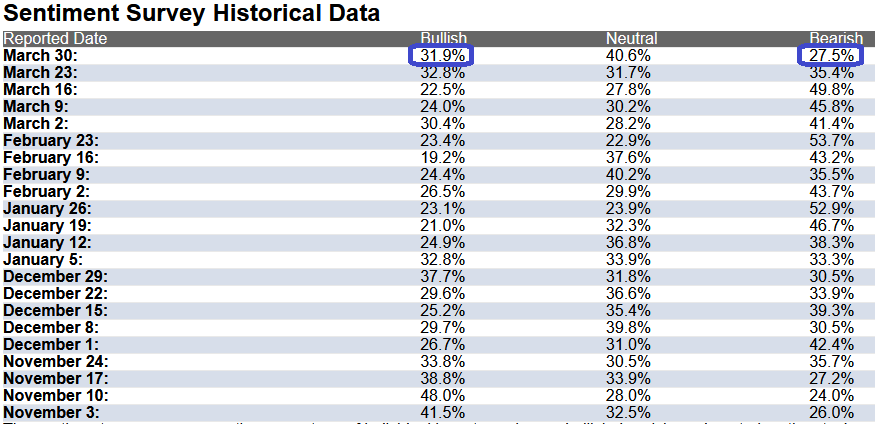
In this week’s AAII Sentiment Survey result, Bullish Percent ticked down to 31.9% from 32.8% last week. Bearish Percent fell to 27.5% from 35.4%. After last week’s historic rally, Retail trader/investor sentiment has thawed back to neutral levels. Opinion follows trend…
AAII
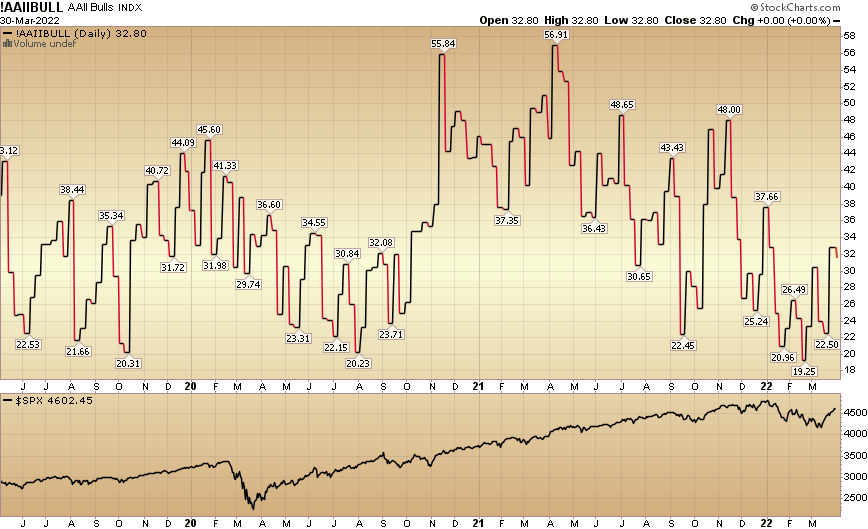
StockCharts.com
The CNN “Fear and Greed” Index rose from 43 last week to 51 this week. Despite the monster rally off the lows in the past week and a half, sentiment is still cautious in the market.
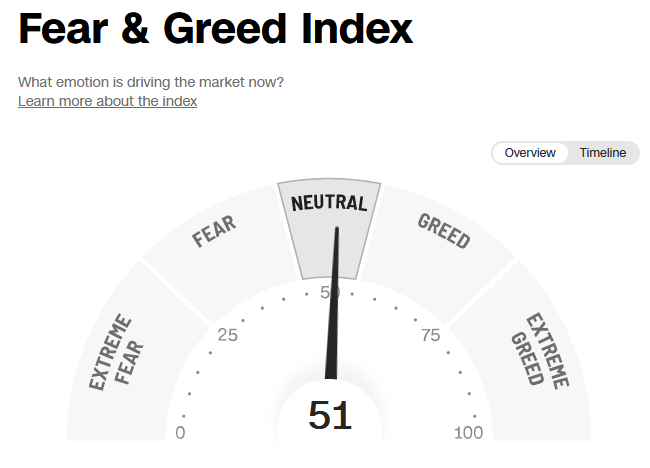
CNN
And finally, this week the NAAIM (National Association of Active Investment Managers Index) moved up to 52.69% this week from 46.68% equity exposure last week. Managers still have among their lowest exposures to equities since the 2020 pandemic lows. Managers will have to chase further strength in coming weeks.
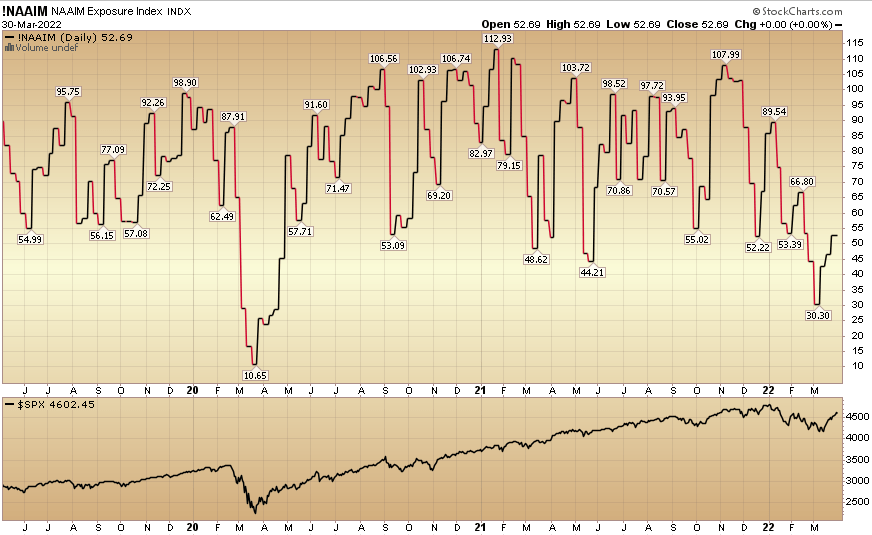
StockCharts.com
bgwalker/E+ via Getty Images
Be the first to comment