

richcano
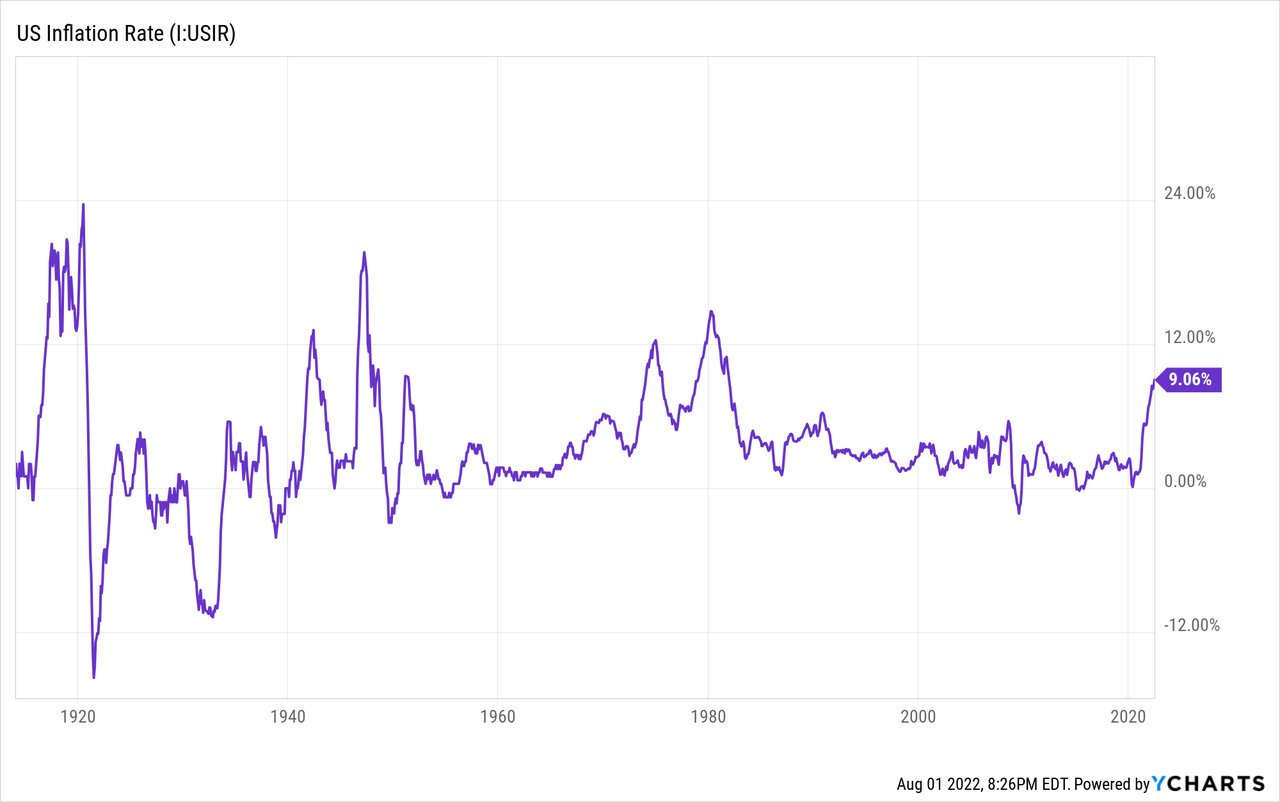
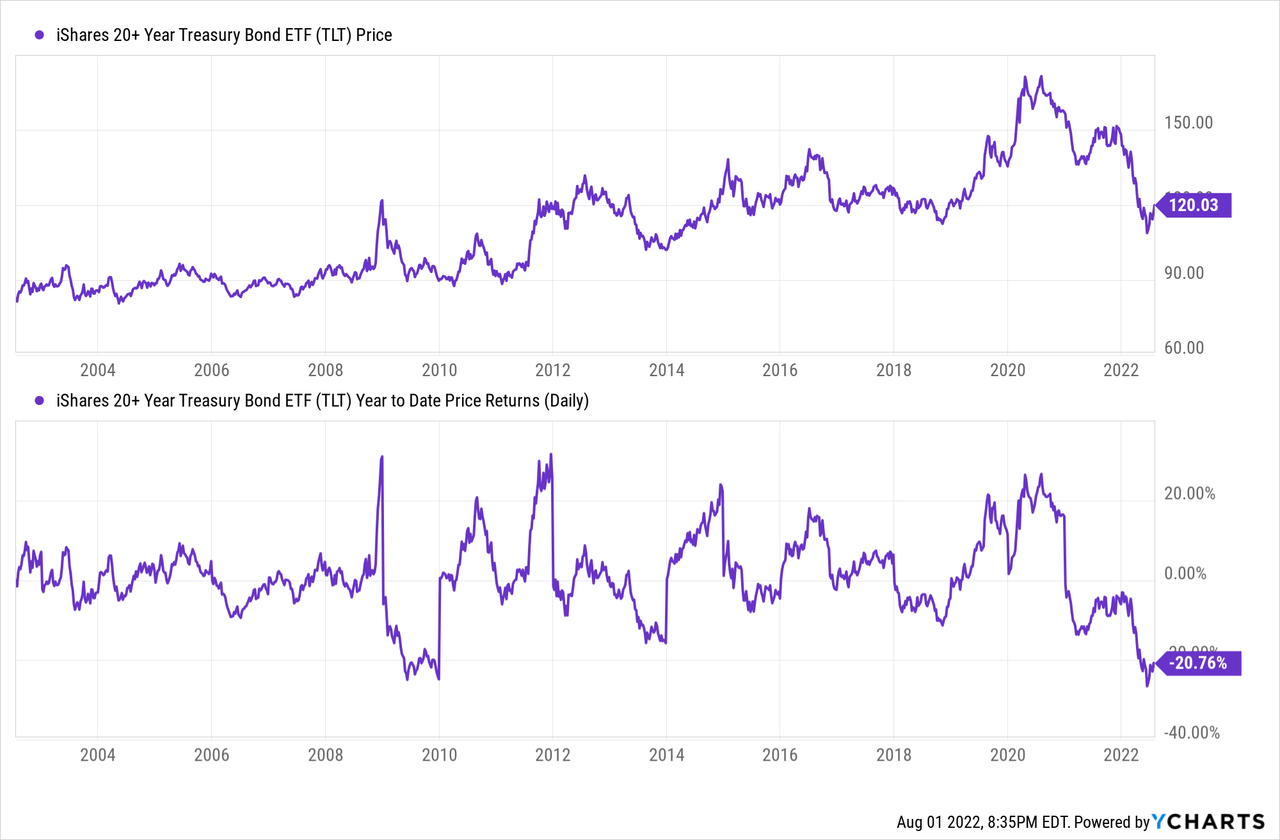
During the high inflation period of the 1970s bonds earned the moniker “certificates of confiscation” due to the steep real losses experienced by bond holders. The U.S. now has the highest rates of inflation since that period of time and bond holders have learned the meaning of this term in earnest with bonds experiencing their worst first half since 1788.
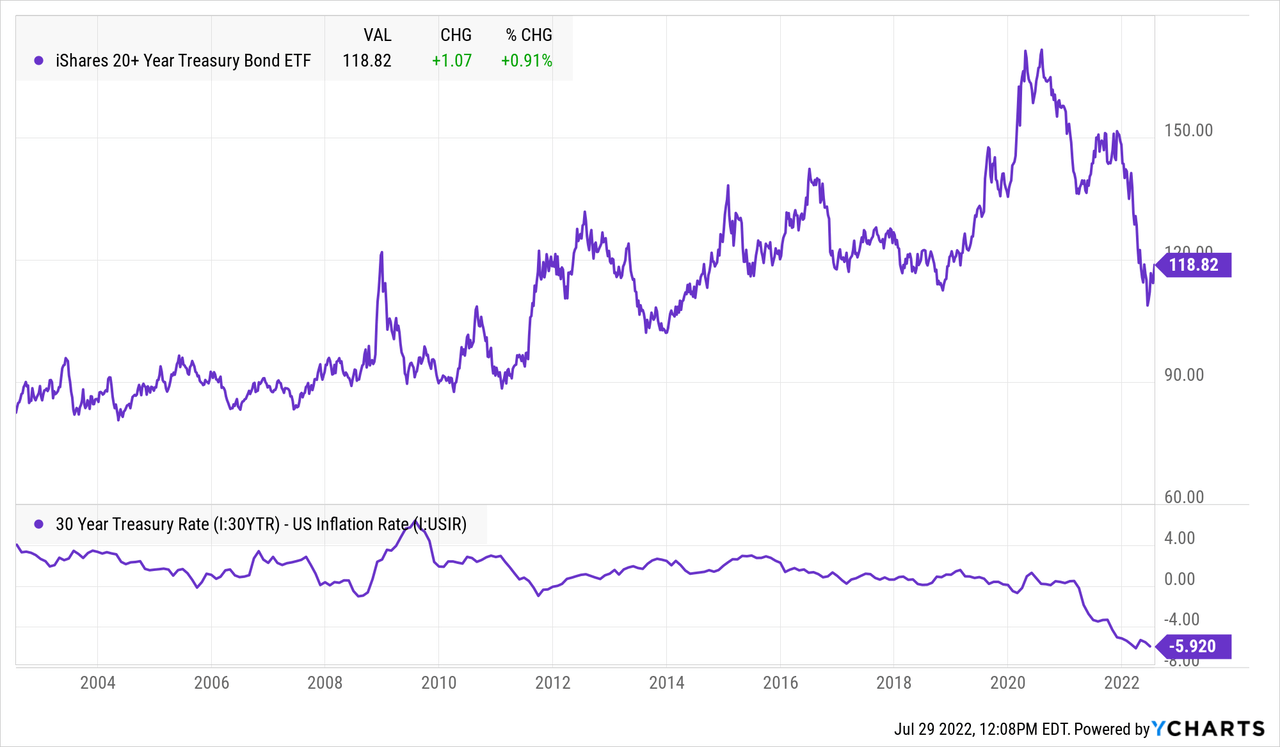
The contrarian in me is intrigued by bonds while the Bentonian in me is screaming in horror at the thought. That’s because the rate of the 30-year Treasury minus the official (and underestimated) inflation rate is at -5.92%. It suggests that on top of losing 5% of real purchasing power each year bonds may also be saddled with significant market price loss.
But it’s time to set feelings aside and look at the data. The truth is that inflation is a lagging indicator; we had 9% over the past year we’re not guaranteed 9% inflation over the next year. Real GDP grew by 5.7% in 2021 but not in 2022. The data suggests that growth is coming down fast and inflation may be just behind it.
Where is Inflation?
Inflation is not linear. Even the 1970’s was characterized by waves of higher inflation followed by recession and lower inflation. Today, the largest disconnect in two decades between inflation and the 10-year Treasury breakeven rate has emerged. One of these is wrong. Inflation is backward looking and breakevens are forward looking.
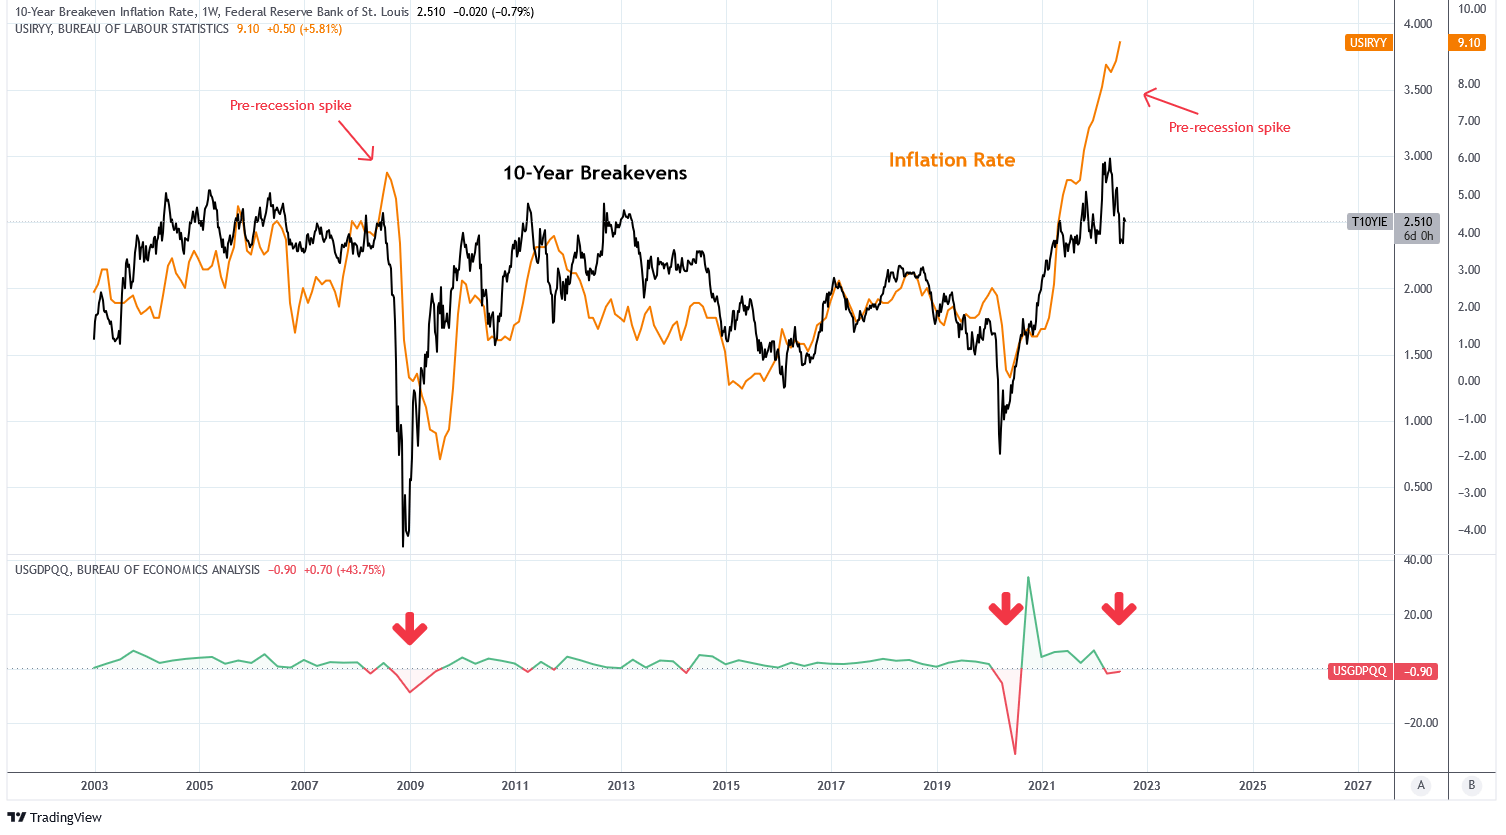
Charts by TradingView (adapted by author)
There are three primary reasons why the breakevens are expecting lower inflation:
- Money supply growth is slowing
- Commodity prices are falling
- Growth is declining
Below is a chart of the YoY change in the producer price index in red compared to the YoY change in M2 money supply with an 18-month lead in green. It is often correlated that surges in M2 growth are followed by surges in inflation and explains much of the inflation that is occurring today. M2 growth is forecasting a peak in inflation is imminent and suggests that PPI inflation may return to a rate of 5% compared to a current rate of 23%.
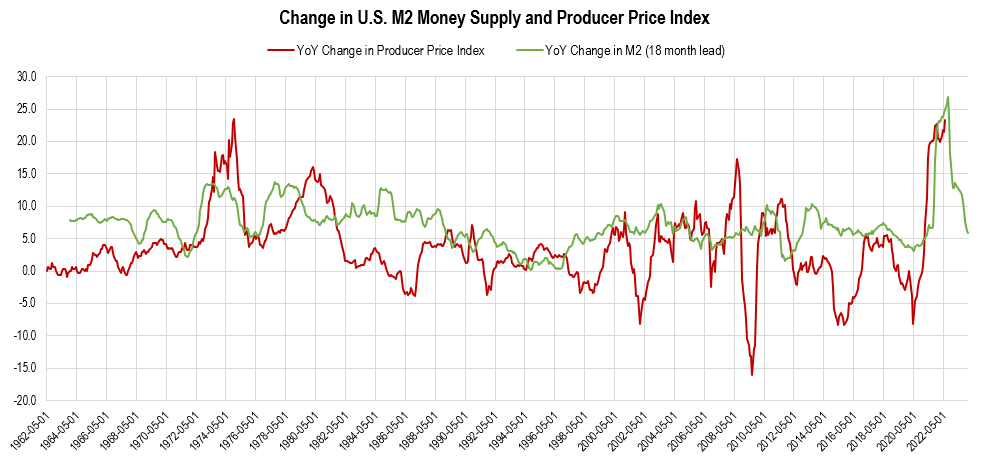
Chart by Author (data from Federal Reserve Economic Data | FRED | St. Louis Fed)
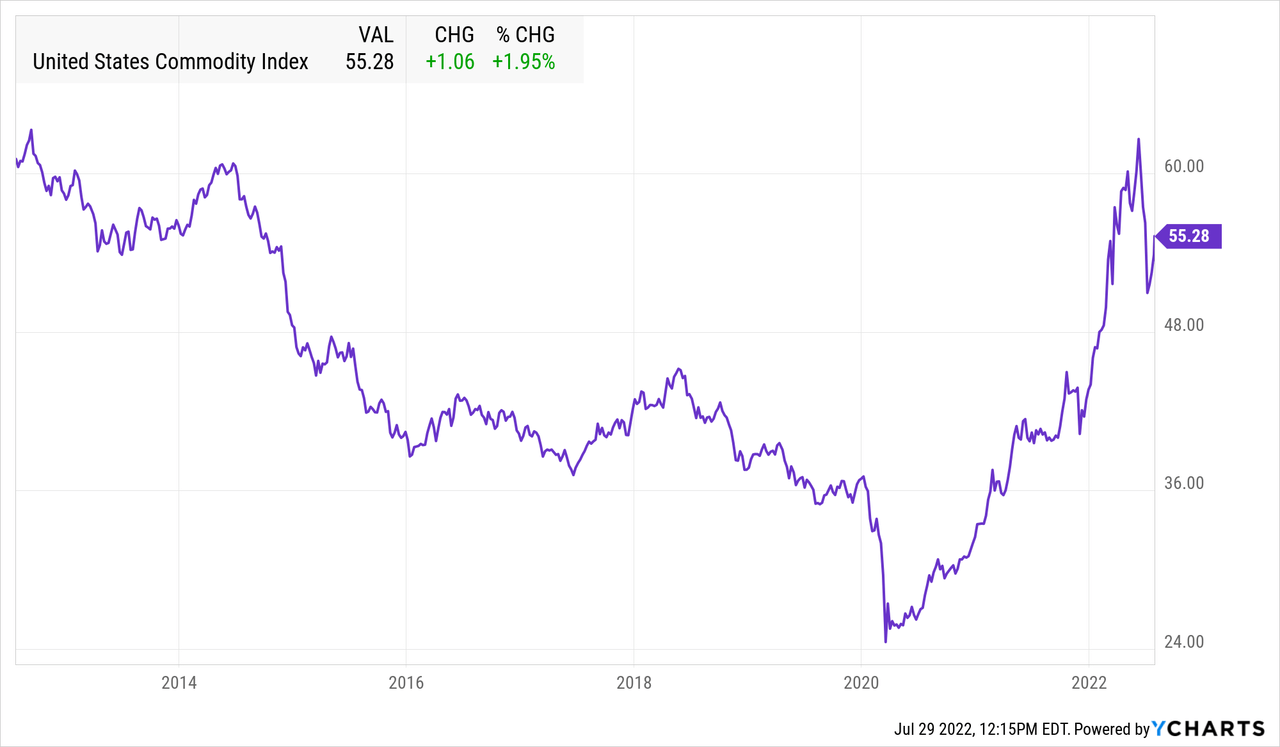
The U.S. commodity index has declined by more than 10% since April. The momentum is suggesting a possible blow-off top in commodities has peaked in 2022. The decline has been led by metals and agricultural commodities while the price of oil and natural gas remain stubborn in the face of supply shortages.
The last two times that U.S. Real GDP was negative for two consecutive quarters it marked a significant top in oil price. While it is plausible that oil could still spike to $140 a barrel before the end of the year, the last two quarters of negative real GDP growth are forecasting lower oil prices.
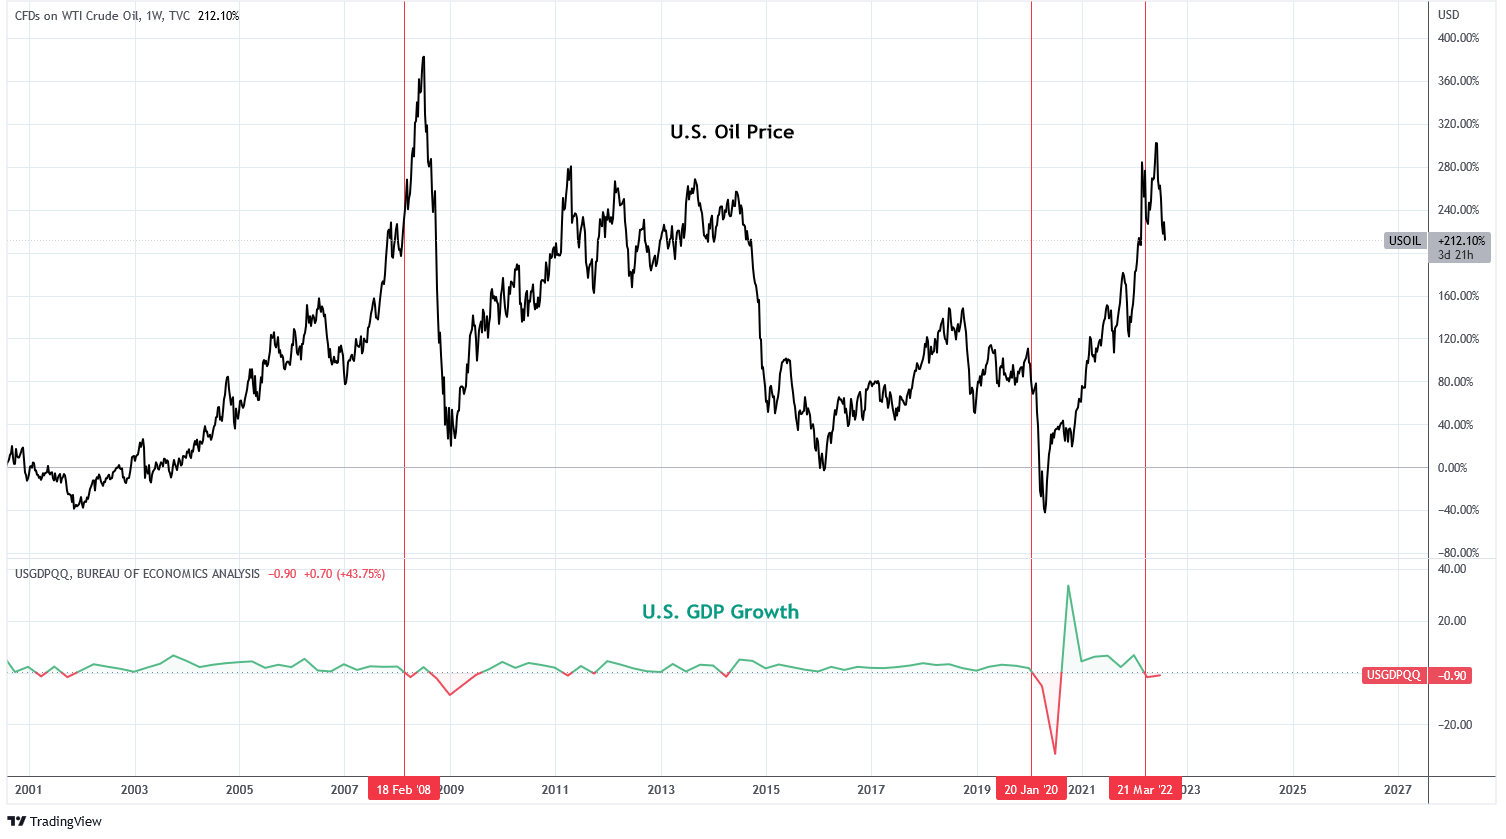
Charts by TradingView (adapted by Author)
The last part of the inflation picture is the cost of housing. Housing is one of the slowest sectors to change. Prices and rents continue to broadly move higher. However, signs of weakness in the housing market are mounting. I wrote previously about housing and rents and why I expect prices to come down.
The Business Cycle is Favorable for Bonds
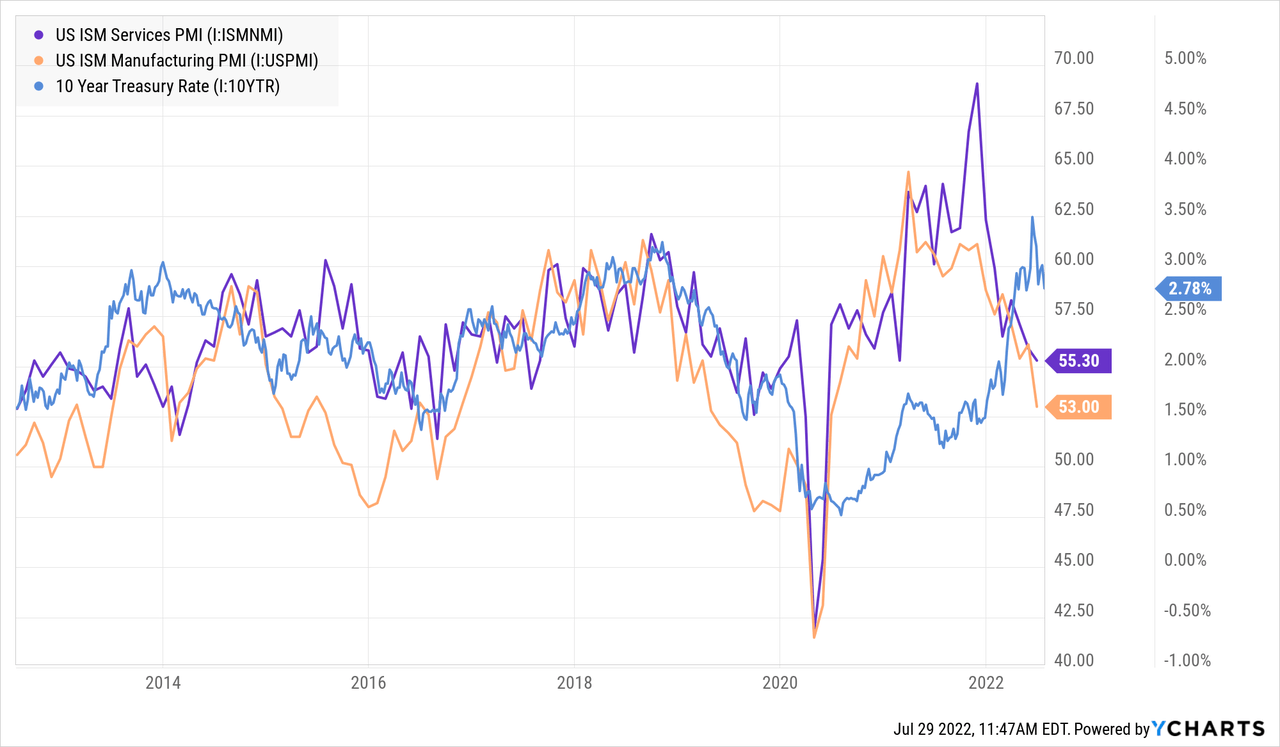
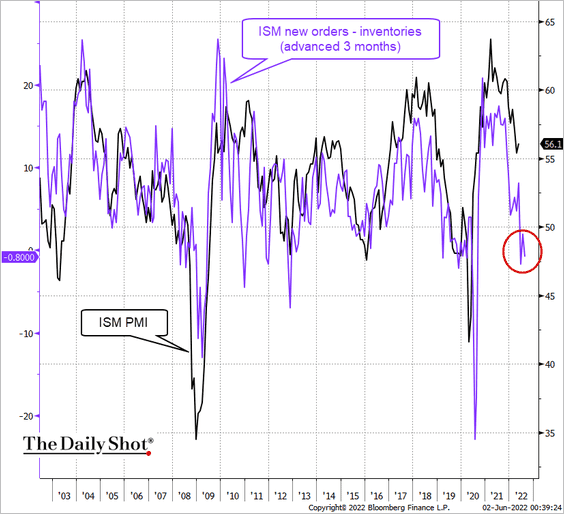
Forward looking indicators are forecasting a decline in growth and a recession in the business cycle. After declining over the last year ISM Services PMI is at 55.3 and ISM Manufacturing PMI is at 53. These levels do not indicate recession yet, however ISM new orders minus inventories is forecasting ISM PMI as low as 47 which is recessionary. The rate on the 10-year Treasury tends to follow the PMIs but has diverged from the PMIs since the beginning of the year. A decline to 1.5% would restore the correlation.
The Daily Shot (used with permission)
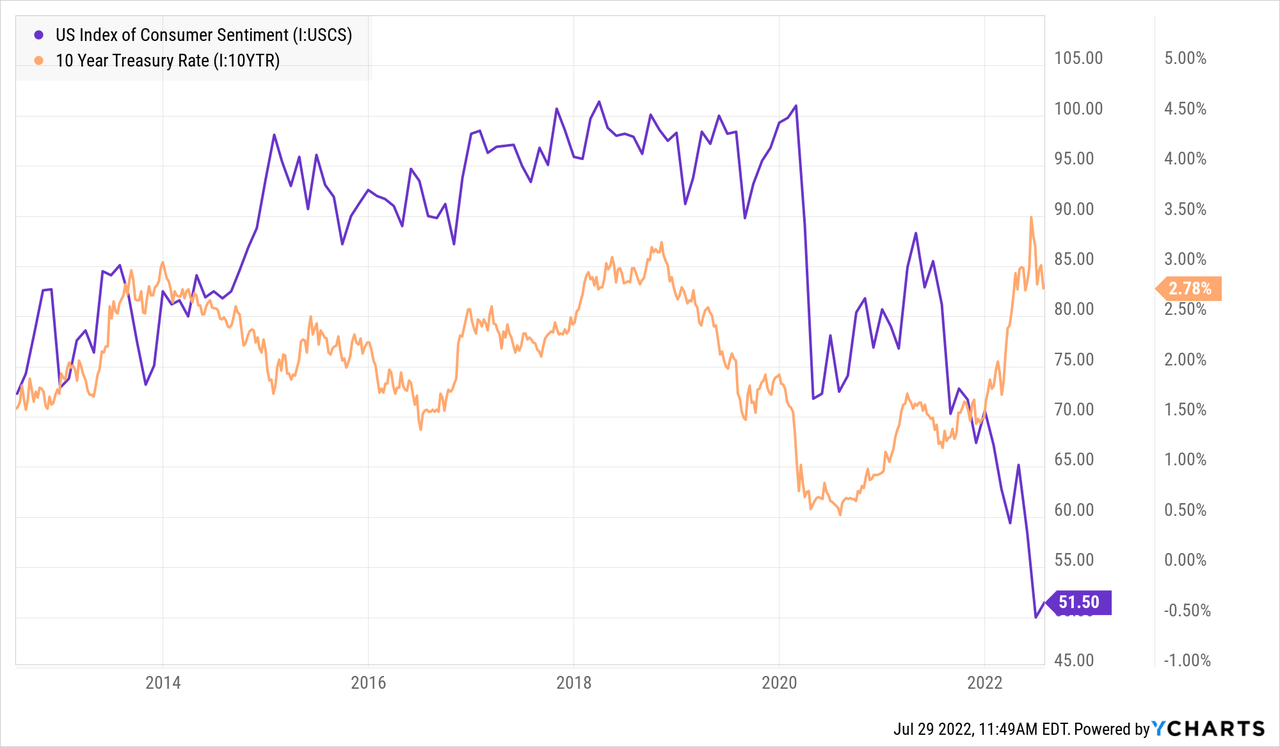
Consumer sentiment in the U.S. is at the lowest levels since 2009. The Consumer Sentiment Index is now at 51.5. The Michigan Consumer Sentiment Index is the lowest on record since 1950. This portends declining economic growth.
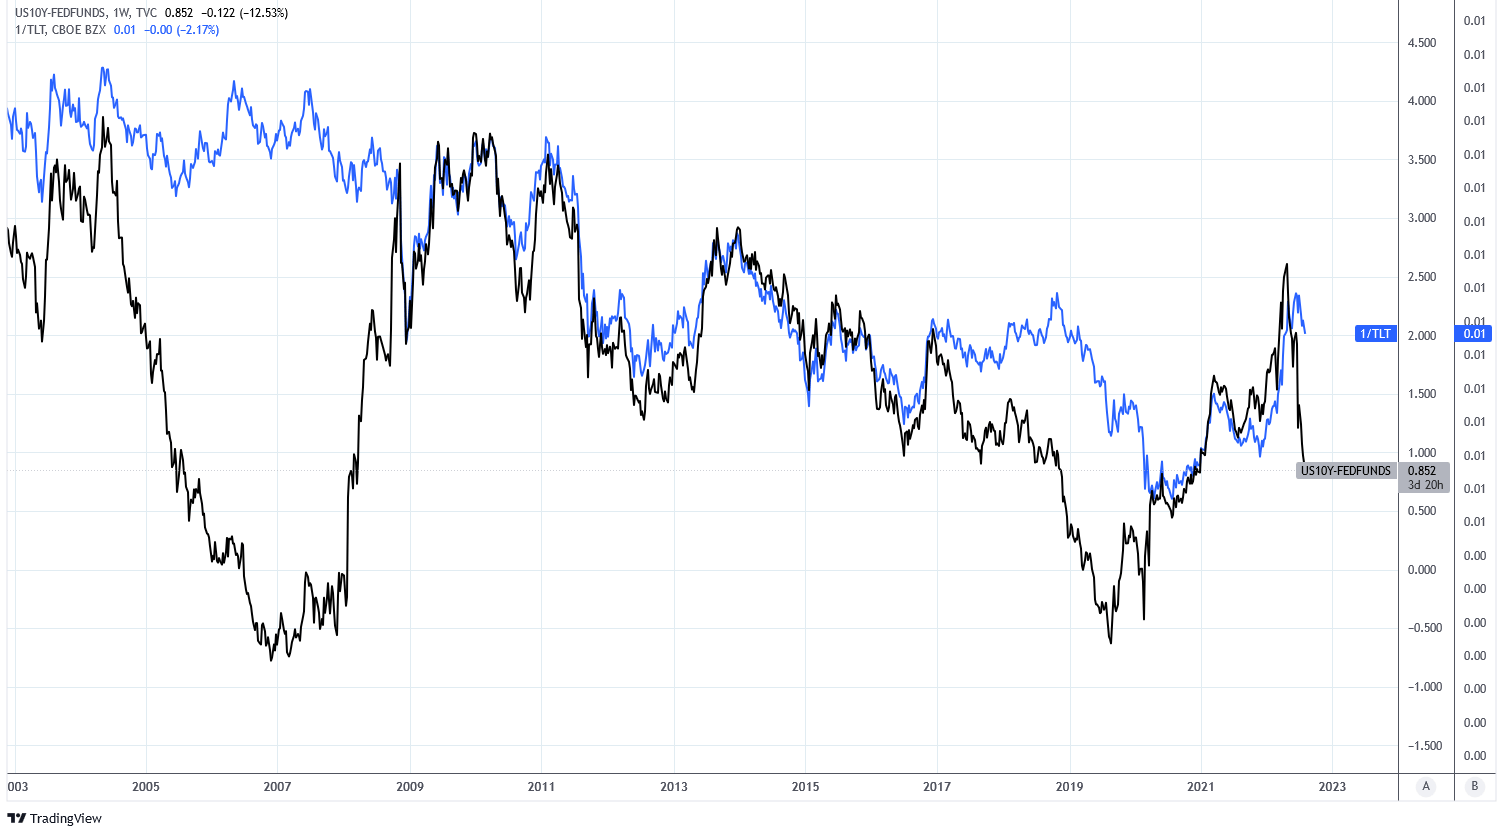
Below is U.S. Jobless claims in black and the 10 year Treasury rate inverted in orange. These data are moderately correlated. Jobless claims bottomed in March 2022 and have been on the rise.
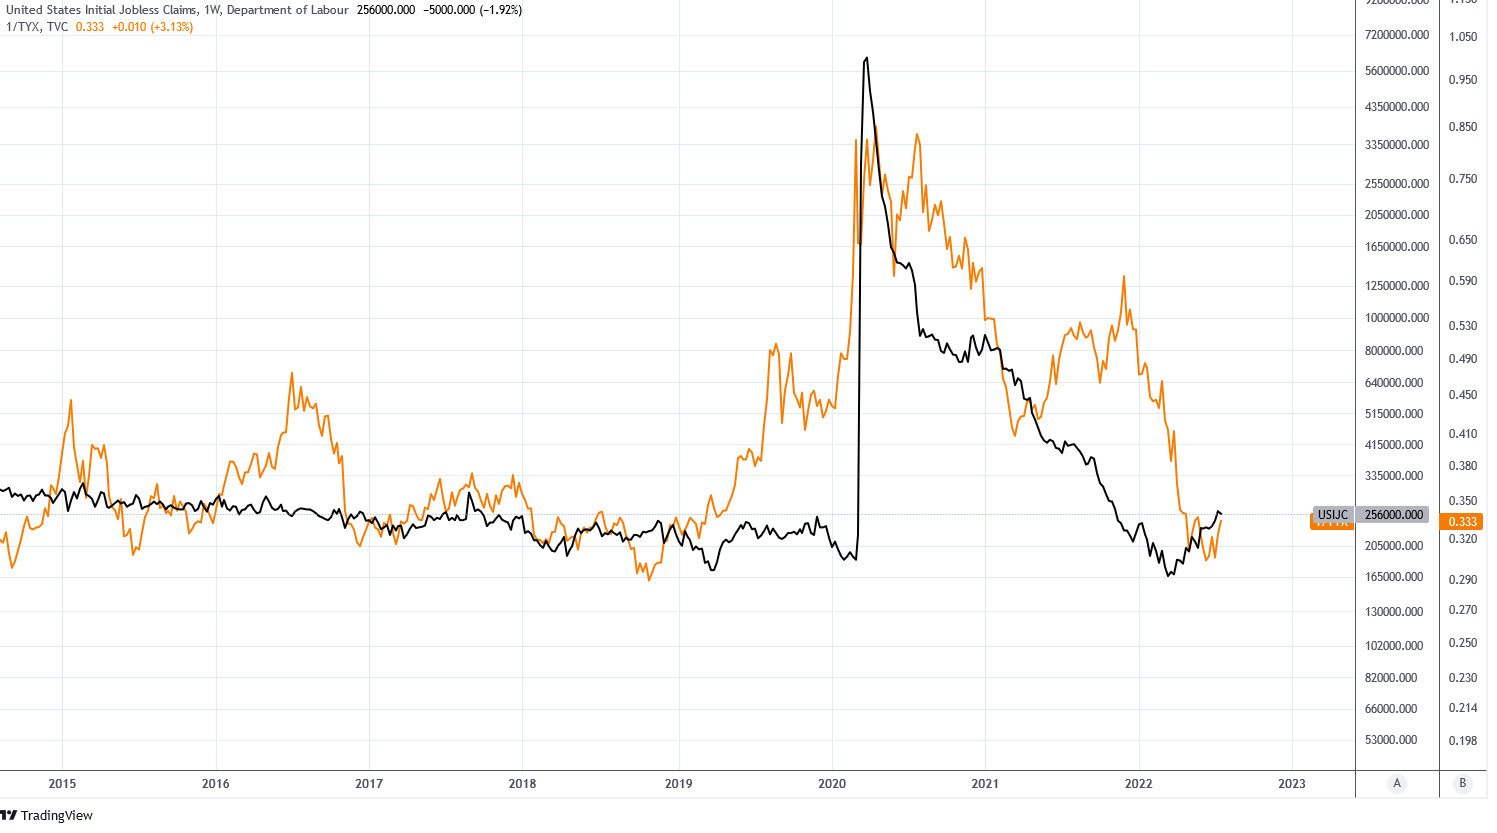
30 Year Rates and Jobless Claims (Charts by TradingView (adapted by author))
Jobless claims are likely to continue rising as announcements of jobs cuts have been increasing over the past quarter. Declines to share price and consumer spending are going to accelerate cuts.
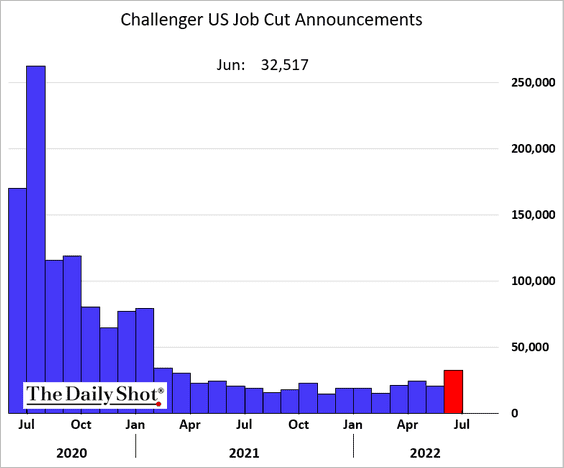
Job cuts (The Daily Shot (used with permission))
Further compromising jobs is that Small Business Outlook and Manufacturing Expected Conditions are at abysmal levels lower than the Great Financial Crisis of 2008.
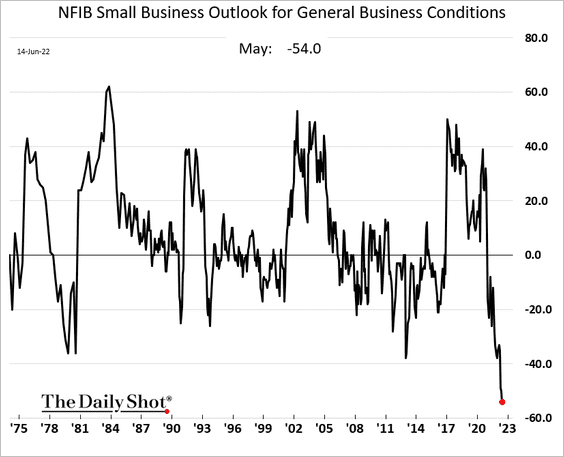
The Daily Shot (used with permission)
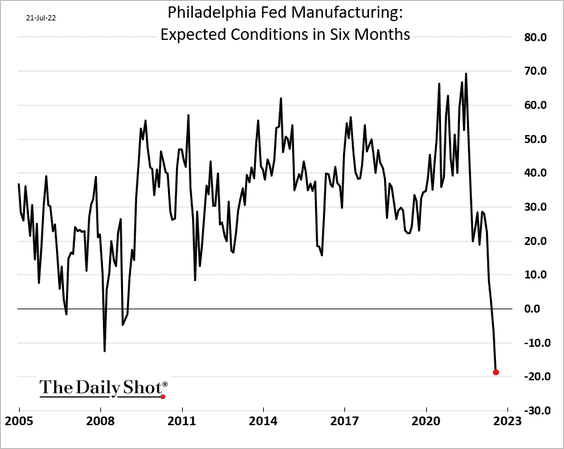
The Daily Shot (used with permission)
Finally, the bond market is signaling a downturn in the business cycle. The Federal Reserve has been raising the Fed Funds Rate through 2022 and until June the rate on the 10-year Treasury rose in unison. But since June the 10-year has been falling, thus closing the spread with the Fed Funds Rate. The bond market is telling the Fed that recession is coming and that higher rates won’t last.
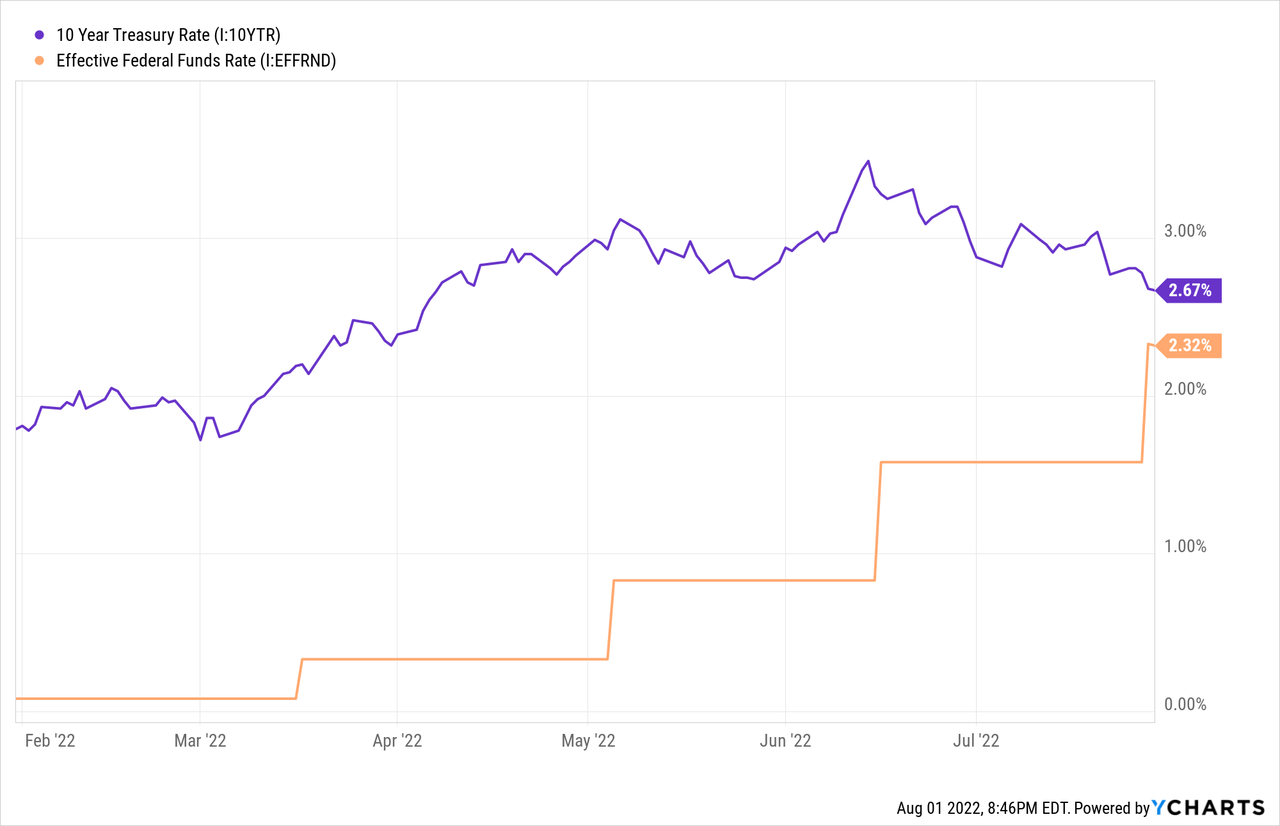
The 10-Year minus Fed Funds Rate spread in black is often correlated with the inverse performance of the TLT bond ETF in blue. Currently the spread is leading TLT higher.
Charts by TradingView (adapted by author)
Trading Bonds with TLT
The technical chart of the 30-year Treasury Rate has printed a head and shoulders pattern with a backtest and a rate target of about 2.5%. This corresponds to a price target of $129 on the iShares 20+ Year Treasury Bond ETF (NASDAQ:TLT).
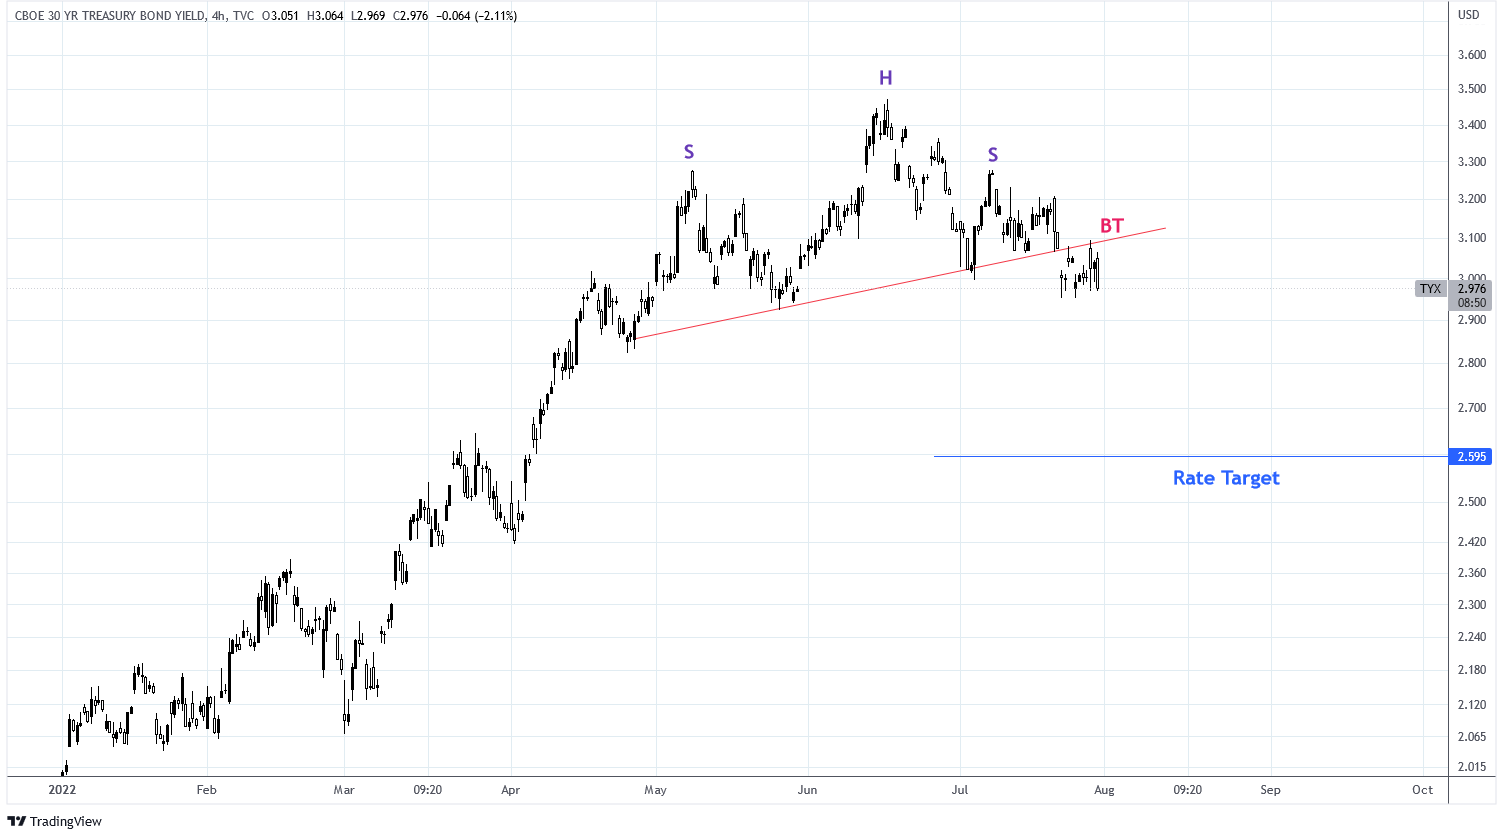
30 Year Treasury Rates (Charts by TradingView (adapted by author))
TLT is rising out of an oversold level on the 14 weekly RSI. The ETF has averaged nominal price returns of 8.67% in the 52 weeks following oversold bottoms in the last 20 years. This suggests a price target of $129 by May 2023.
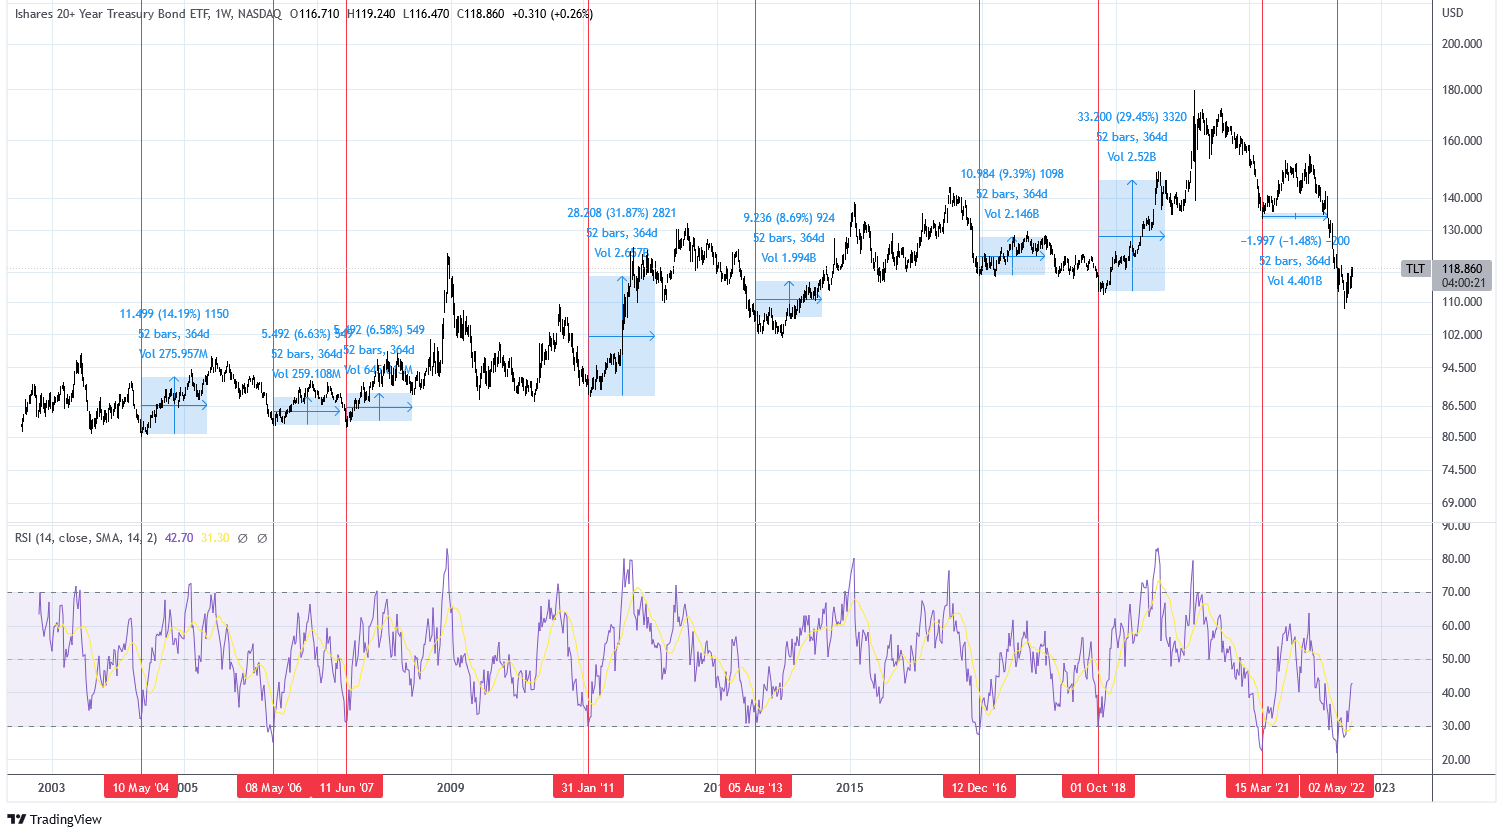
TLT and RSI (Charts by TradingView (adapted by author))
| Date of RSI Bottom | Forward 52 Week Price Returns |
| May 2004 | 14.19% |
| May 2006 | 6.63% |
| June 2007 | 6.58% |
| January 2011 | 31.87% |
| August 2013 | 8.69% |
| December 2016 | 9.39% |
| October 2018 | 29.45% |
| March 2021 | -1.48% |
| Average | 13.17% |
| May 2022 to date | 4.50% |
| Difference | 8.67% |
I am buying bonds by going long TLT call options. I have entered a long position on the March 17, 2023 100 Strike Long Call Contract at an average cost basis of $19.81 per share.
Summary
Bonds are currently offering a very unattractive real yield when using backward looking inflation statistics. It cannot be known when inflation will peak but markets are pricing in an imminent decline. Lower inflation and negative growth in the future is a great macro environment for bonds. The trade may not feel good but it makes sense and is worth a place in my portfolio.
Be the first to comment