

Chip Somodevilla
The TJX Companies, Inc. (NYSE:TJX) is a leading off-price apparel and home fashions retailer in the United States and worldwide that operates over 4,500 stores in four major business segments: Marmaxx, which includes their T.J. Maxx and Marshalls chains; HomeGoods; TJX Canada; and TJX International.
The company is an opportunistic purchaser of merchandise at prices that allow them to resell at 20% to 60% below full-price retail at still profitable levels. With inventory piling up at other traditional retailers, such as Walmart (WMT) and Target (TGT), the acquisition environment is especially attractive for TJX. With margins still below trend, the favorable buying environment provides an attractive opportunity for improvement.
Additionally, with consumers increasingly stretched thin on higher prices in seemingly every category of goods and services, any discount they can get would come as welcome relief. And with the holidays right around the corner, Thanksgiving Day dinner is likely causing anxiety for many households. This could result in greater traffic into TJX’s chain of stores for shoppers addressing their holiday wish lists following the Thanksgiving Day holiday.
With earnings on deck, margins, inventory levels, and the state of the consumer are likely to be three top topics of interest among active investors. With shares already at the top-end of their trading range, there isn’t much room for error. A miss coupled with negative commentary, especially surrounding inventory levels, could send shares tumbling. On the other hand, shares could also soar higher on hints of future outperformance, such as greater traffic levels and better-than-expected margins.
At any rate, it’s best to view TJX on a longer-term horizon. And with this view, the company is among the best retailers to include in a diversified portfolio. Its scale and leadership position sets it apart from their competition, and the value proposition of their goods provides a defensive hedge against broader market downturns. Together, this makes for a durable portfolio holding through any economic environment.
In A Position Of Strength Prior To Their Earnings Date
Heading into their earnings release, TJX is one outlier among the broader S&P 500. At over $70/share, the stock is trading near the top-end of their 52-week range. And YTD, shares are little changed. This compares to a YTD decline of over 15% in the broader index. Comparably, the stock is also holding up better than similar off-price retailers, such as Ross Stores (ROST) and Burlington (BURL), who are down 14% and 50% YTD, respectively.
Seeking Alpha – Total Returns Of TJX Compared To Peers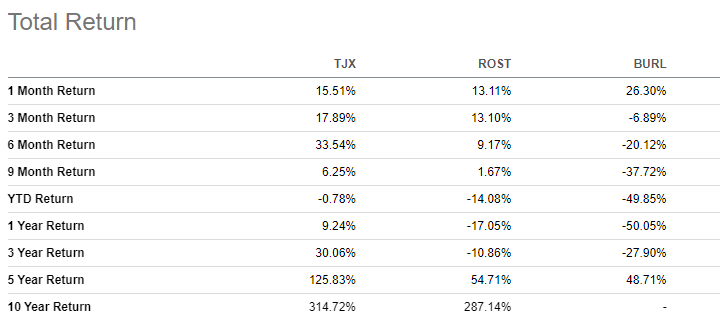
In prior releases, TJX has had a mixed record. While their earnings generally come in ahead of expectations, they have had a greater tendency to miss on revenue projections. Over the last three quarters, for example, they left over +$700M of expectations unfilled.
Seeking Alpha – EPS And Revenue History Of TJX Compared to Consensus Estimates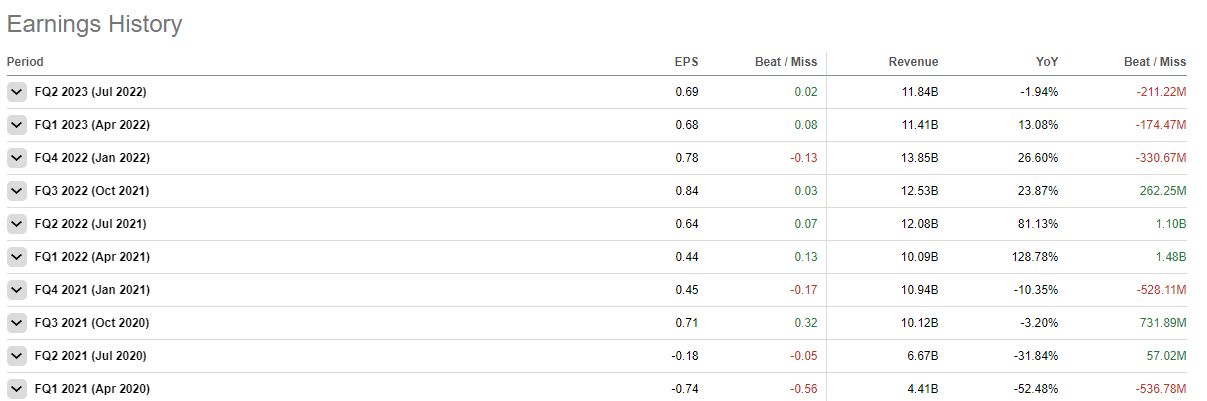
Following the prior four releases, shares tracked lower initially, but always rebounded shortly thereafter. And currently, shares are back to the levels last seen at the beginning of 2022.
YCharts – Recent Share Price History Of TJX Following Release Of Earnings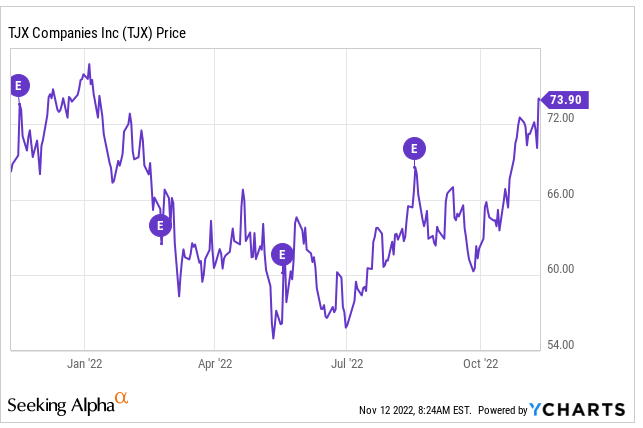
Improving Margins In Relation To Competitors
In Q3, sales are expected to be in the range of +$12.1B to +$12.3B, with a pretax margin of 10.1% to 10.4%, inclusive of higher incremental freight and wage expenses. This would be a notable improvement over pretax margins of 9.3% reported in Q2. That was down 150 basis points (“bps”) from the same period last year. Margins would still be down from last year even if they came in within range in Q3 but by a lesser amount of between 60 and 90bps.
In addition, margins in excess of 10% would also close the gap to ROST, who historically operated on higher margins than TJX, due to the lower margin structure of TJX’s European and HomeGoods businesses, but has experienced a declining rate in recent periods as opposed to TJX, whose performance has strengthened on improving merchandise margin and effective expense management.
YCharts – EBIT Margins Of TJX Compared To Peers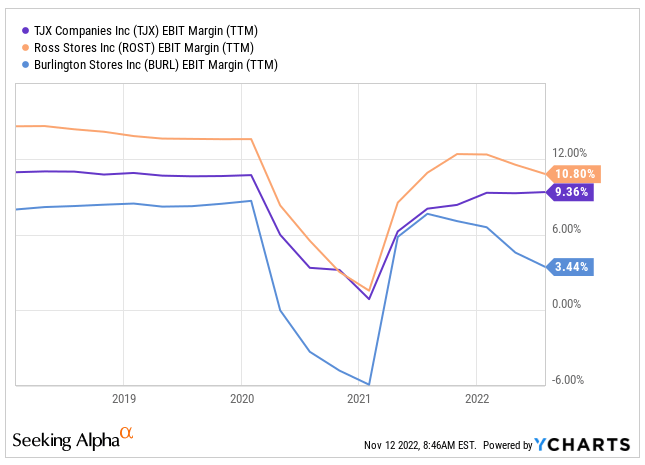
A Glut Of Inventory Creates Opportunities
Q3 earnings may also reflect even stronger merchandise margins resulting from the favorable buying environment created by the inventory woes of major retailers, such as TGT and WMT. TGT’s second quarter earnings, for example, were down 90% from last year due in part to discounting and promotional activity on their excess inventory. Likewise, even after elevated levels of discounting, WMT noted that they still have about +$1.5B in inventory that they would like to sell.
As a percentage of quarterly revenues, inventories are above 10-year averages at most major retailers. Macy’s (M) has been one exception due to company-specific supply chain constraints that allowed them to clear out excess goods but have kept certain items in short supply. But between TGT and WMT, inventories are still tracking ahead of averages, even more so with TGT than WMT.
YCharts – Inventory To Sales Ratio Of TJX Compared To Other Retailers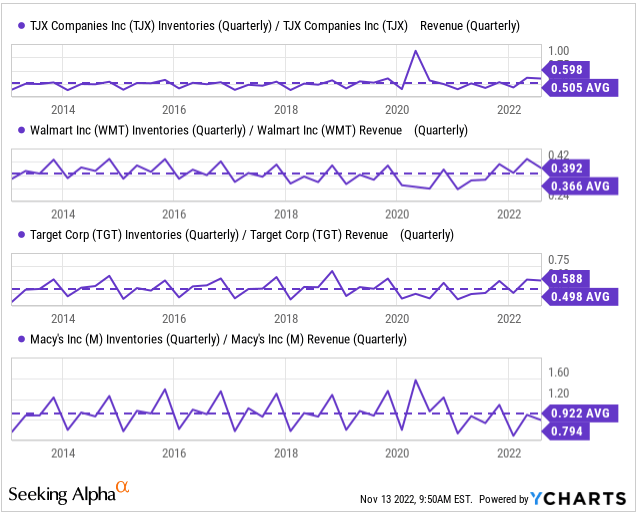
And as a percentage of total quarterly assets, inventories are above averages everywhere, including at Macy’s.
YCharts – Inventories As A Percentage Of Quarterly Assets Of TJX Compared To Other Retailers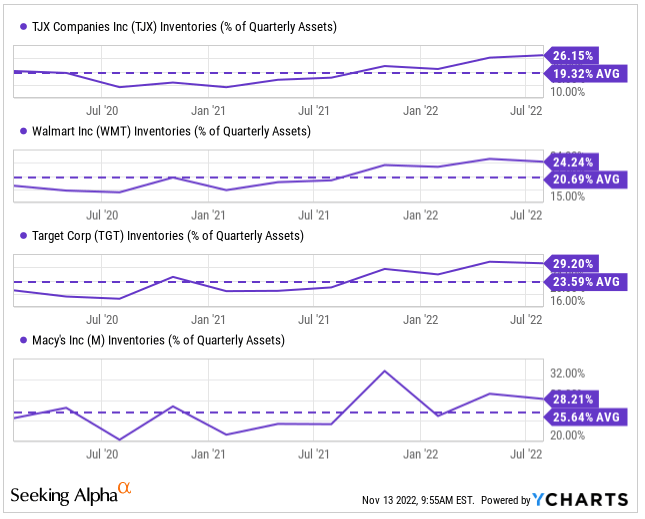
Elevated inventory among the various retailers is notable because, for an off-price retailer such as TJX, it creates a more favorable purchasing environment that was not available last year. Typically, TJX acquires their products through two primary means, via closeout inventory from local stores or directly from vendors and factories located primarily in Asia. Historically, the ratio is weighted significantly to closeout purchases, at about 75% of total purchases.
But due to abnormally tight inventory levels last year, TJX was forced to source more of their merchandise from overseas, which is a lower-margin sourcing method compared to closeout inventory. Record freight costs only made it that much more expensive.
This year, however, with the market flush with wholesale inventory, especially in Q2, TJX was in a prime position to capitalize on the favorable environment. Management recognized as much by noting in their Q2 conference calls the flood of opportunities available in the market.
St. Louis Fed – Chart Of Merchant Wholesale Inventories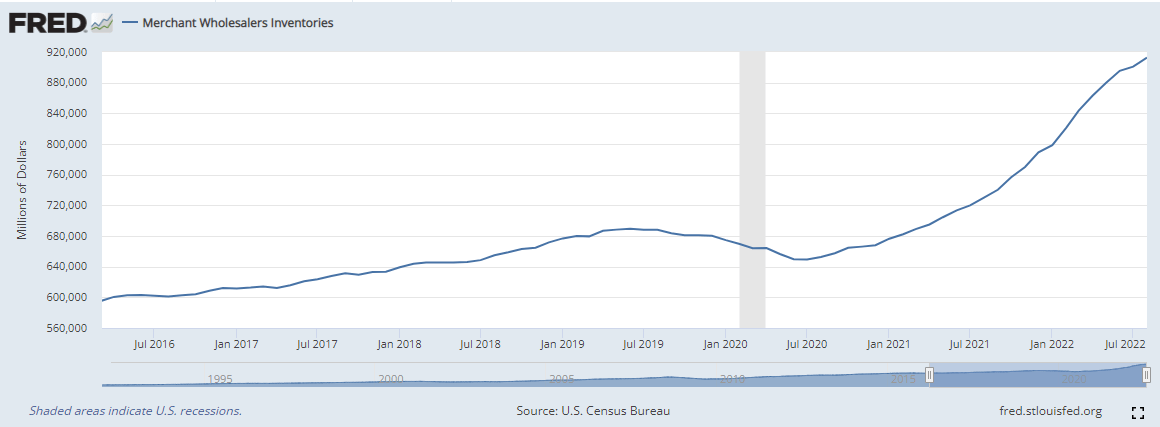
TJX’s Broad Customer Base Is A Competitive Advantage
This doesn’t necessarily imply that boom times are ahead for the company. After all, inventories are at elevated levels at TJX as well. In the prior quarter, inventories were up 39% from last year. Additionally, consumers have increasingly become more price sensitive as rising costs continue to eat away at personal savings rates. Granted, inflationary pressures are down from the record levels seen in June, but it remains elevated at 7.7%.
For lower-income households, there are more pressing spending priorities, such as food and energy bills than treasure hunting at off-price retailers. This was reflected in September’s retail report, which came in flat from the prior month. This, however, is likely to be more of an issue for ROST, who is more exposed to consumers on the lower end of the income spectrum.
TJX, on the other hand, has a broad base of customers. So, while there may be some softness from certain customers, there may be an offset from those with more discretionary purchasing power. Recent sales trends at luxury outlets support the notion that those with the means are unlikely to scale back significantly, despite inflationary pressures. If anything, TJX is likely to see an increase in higher-income customers as they, themselves, increasingly seek out bargains to offset pressures elsewhere.
The Pace Of Inventory Turnover Is Critical
Even though inventories are up, what’s more important is the turnover of existing stock. In the most recent quarter, it took about 75 days to sell inventory. While this is up about five days over the last twelve months ending in the second quarter, it is on par with ROST and significantly better than many other retailers.
Author’s Calculations Of Cash Conversion Cycle Of TJX And Other Retailers Using Data Obtained From Quarterly Financial Statements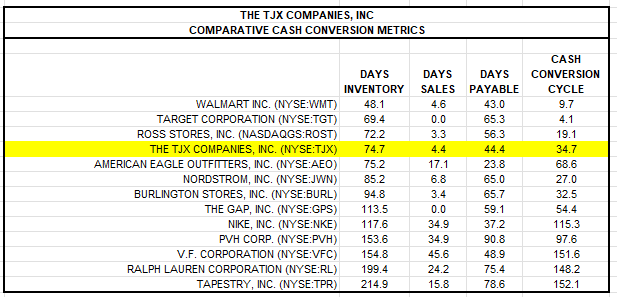
Any further slowdown in the turnover rate, however, is likely to result in greater promotional and discounting activity, which may cut into margins in future periods. Over the last twelve months, there were some signs of this. Compared to the last fiscal year, for example, TJX experienced an increasing ratio in cost of goods sold (“COGS”) and sales in conjunction with a declining turnover ratio for the last twelve months ending in the second quarter. This is indicative of a weakened demand environment marked with price reductions.
Author’s Analysis Of The Relationship Between The COGS/Sales And Inventory Turnover Ratios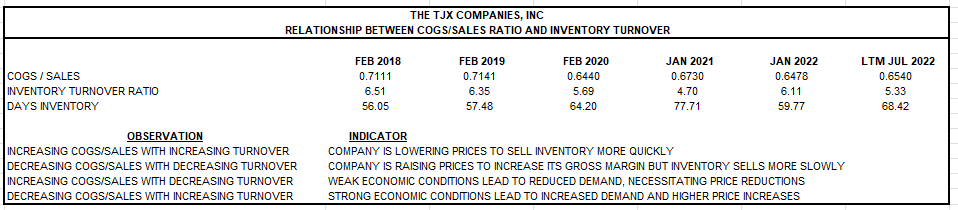
Extended Upside Due To The Value Proposition Of Their Goods And Services
TJX is a leading off-price retailer in apparel and home fashions with a market cap more than double that of their closest competitor, Ross Stores. Its global presence and adeptness in managing their supply chain, along with their top-grade relationships with their vendors are several competitive advantages that set it apart from other retailers.
The company’s business model is particularly advantageous in the current market environment, where value and bargains are forefront on the minds of consumers. Their exposure to consumers across the income spectrum also insulates them from concentration risks of being too dependent on more cash-strapped consumers, as in the case of Ross.
Ahead of earnings, shares are trading at the top end of their 52-week range and are up nearly 14% over the past month. This is ahead of the broader market index and in line with Ross but significantly behind Burlington, which is up over 30% on the month.
At just under 24x forward earnings, shares don’t immediately appear to be a bargain. Additionally, at current levels, shares are trading at an intrinsic price point slightly above a target calculated in a prior analysis. Nevertheless, the company has extended upside due to its value appeal among customers hit hard by rising costs.
With the holidays right around the corner, it wouldn’t be surprising to see more consumers turn to TJX’s chain of stores to fulfill their shopping needs. Inventory that would have likely been acquired at very favorable pricing would also translate to higher margins, which would appeal to larger institutional investors. For investors seeking a quality bargain retailer for their portfolios, TJX is a trusted name to be overweight on and one to be added on any price weakness.
Be the first to comment