

Danai Jetawattana/iStock via Getty Images
My latest article on the inventory cycle was published on 5/18/2021. At that time, the economy was strong, and the business cycle was on an upswing. At that time, the dynamics of the inventory cycle pointed correctly to the following takeaways:
The inventory to sales ratio was pointing to continued strength in manufacturing; commodities and interest rates to rise; commodities and interest rates to peak when the inventory to sales ratio started to rise; CAT and FCX to outperform the market.
The inventory cycle continued to support the above conclusions. Now, however, important changes have occurred. Let me explain.
The Peter Dag Portfolio Strategy and Management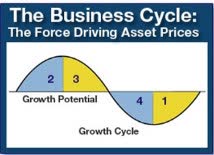
The business cycle goes through four main phases. Each phase has major implications on investment trends and is driven by how business decision-makers react to economic conditions.
In Phase 1 business experiences low inventories and stronger demand. Consumers’ optimism increases as income after inflation improves thanks to declining inflation and interest rates. Business responds to increased sales by raising production targets and building up inventories.
Increasing production implies more demand for raw materials and employment, and increased borrowing to improve and increase capacity. The outcome is commodities and interest rates bottom, and employment increases in this phase.
The positive loop of more income, more sales, more employment, more production takes the business cycle into Phase 2. This is the time the economy strengthens above its historical average pace. Production is now rising rapidly and places upward pressure on commodities, wages, interest rates, and overall inflation. Labor costs increase with inflation. Consumers’ optimism (Univ. of Michigan) declines because of the decline in purchasing power caused by higher inflation.
Toward the end of Phase 2 these trends become a concerning development. The economy is overheating and the increase in inflation causes a slowdown in real demand. The economy now enters Phase 3.
In Phase 3 business does not recognize consumers’ purchasing power is decreasing. Manufacturers keep producing to keep unit costs down and plants operating at full capacity.
There is a time in Phase 3, however, when sales grow at a pace slower than inventories causing costs to rise more than anticipated, negatively impacting earnings. Business decides then to cut production to protect earnings. The outcome is declines in orders for raw materials, declines in borrowing, and layoffs. Inflation, however, keeps rising, further reducing consumers’ purchasing power.
The business cycle is now in Phase 4, the most important phase for investors because of the risk of large drawdowns in equity prices. This is the time full-scale bear markets are rampant and all the excesses created in the previous phases are removed.
The business cycle is in Phase 4. It will last as long as:
- Inventory growth declines and is brought in line with that of sales. Inventory growth will have to decline to about 3% after inflation according to recent history.
- Commodities and interest rates decline as business reduces the purchase of raw materials and borrowing because of the attempt to cut inventory growth.
- Inflation and labor costs finally decline. This is a major development accompanied by rising consumer optimism due to the increase in purchasing power and improvement in earnings.
The business cycle will transition in Phase 1 following the above developments.
BLS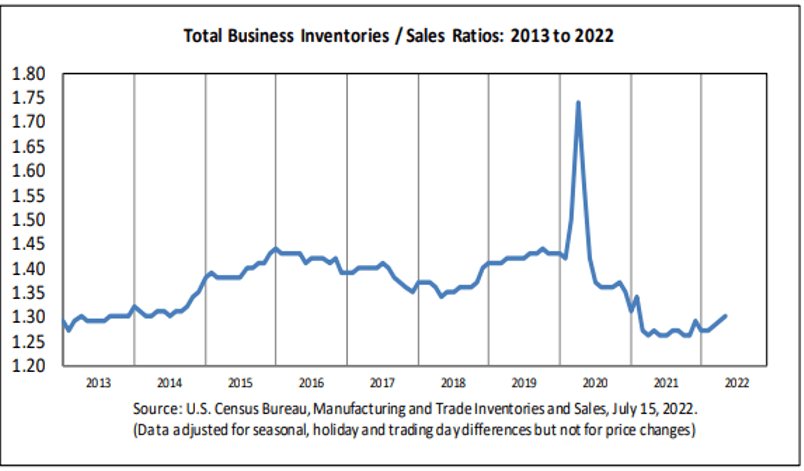
The above graph shows the inventory-to-sales ratio as of May 2022 (published July 15, 2022, by the Bureau of Labor Statistics). The ratio is rising, reflecting inventories growing more rapidly than sales. As of this writing, for instance, wholesalers’ inventories are soaring at a +16.2% y/y pace after inflation. Retail sales after inflation, meanwhile, have declined -0.6% y/y, and personal income is down -3.3% y/y after inflation.
The Peter Dag Portfolio Strategy and Management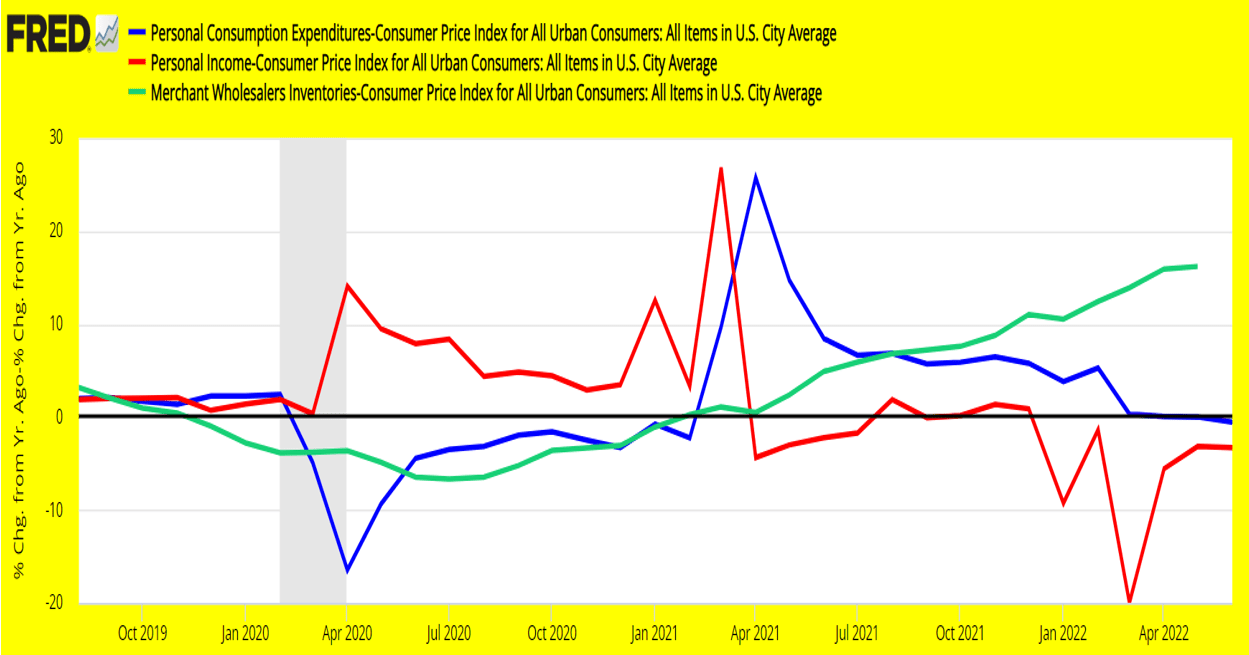
Inventories will be cut aggressively because they are impacting earnings in a major way. Production will be reduced enough to bring inventory growth in the 2%-4% range after inflation.
The Peter Dag Portfolio Strategy and Management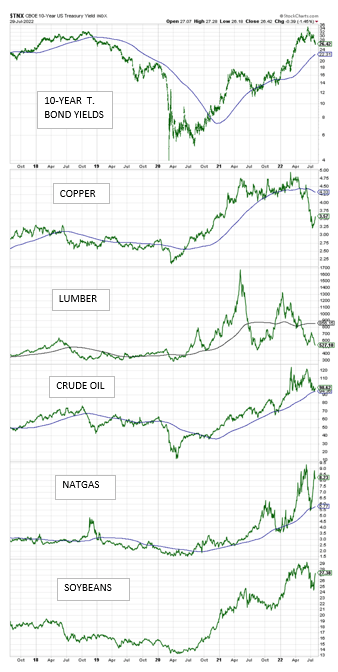
In the meantime, commodities and long-term interest rates will continue to decline to reflect lower growth in business activity caused by the decline in production and inventories (see above chart).
The Peter Dag Portfolio Strategy and Management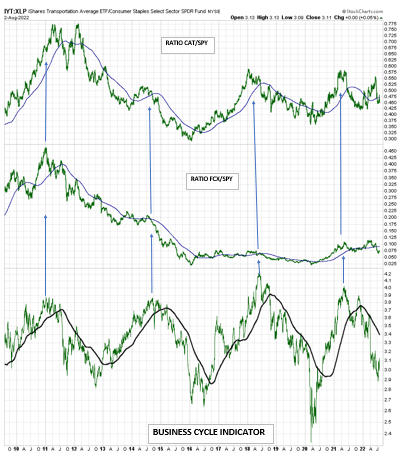
As suggested in the article mentioned above, Caterpillar (CAT) and Freeport-McMoRan (FCX) are likely to outperform the market in a rising business cycle as reflected by the rising ratio CAT/SPY and FCX/SPY (see above panels).
However, now that the inventory correction is forcing the business cycle to decline (see lower panel on the above chart), CAT and FCX are likely to underperform the market – the ratio CAT/SPY and FCX/SPY is declining. This underperformance will continue as long as the business cycle heads lower.
Key takeaway
- The business cycle is in Phase 4. Inventory growth remains excessive, and it must be scaled down to low single-digit growth after inflation.
- The inventory slowdown will be accompanied by lower stock prices (SPY), lower commodities, lower yields, lower growth of production, employment, and overall business activity.
- The process will continue until inflation starts declining in a convincing way, enough to improve consumers’ optimism. Labor costs will slow down as well, improving the outlook of earnings.
- This is the time when the stock market (SPY) bottoms and stocks like Caterpillar and Freeport-McMoRan start outperforming the market (SPY) again.
Be the first to comment