

Torsten Asmus
The bull case for bonds
Central to my asset allocation framework and decision-making process is the outlook for the business cycle. A simple yet highly effective way to manage capital. For months now, the leading indicators of the business cycle have been pointing to a swift and prolonged downturn in growth, with the potential to culminate in recession sometime in 2023. Unsurprisingly, most asset classes have re-rated to reflect this reality. Stocks, commodities and nearly all high-beta and pro-cyclical risk assets have adjusted lower, whilst bonds and duration have too sold-off amid the highest inflationary pressures in decades. Welcome to a world of price discovery.
In markets, the best investment and trading opportunities arise from dislocations. If there is an asset class that has not yet reacted as one might expect from a slowing economy and potential recession, bonds are now looking like they may fit the bill. Clearly, there are a number of important and justified reasons why bonds have sold-off over this past 18 months. Primarily, near four-decade high inflation, aggressive central bank tightening and a material demand and supply mismatch bear much of the responsibility of this bond sell-off, and rightfully so. It doesn’t take a genius to figure out why it has been a terrible time to own bonds. However, I wonder if this sell-off has becomes a little long in the tooth. Have yields permanently decoupled from economic reality, or has this bond sell-off gone too far? Is there a dislocation here, an opportunity perhaps?
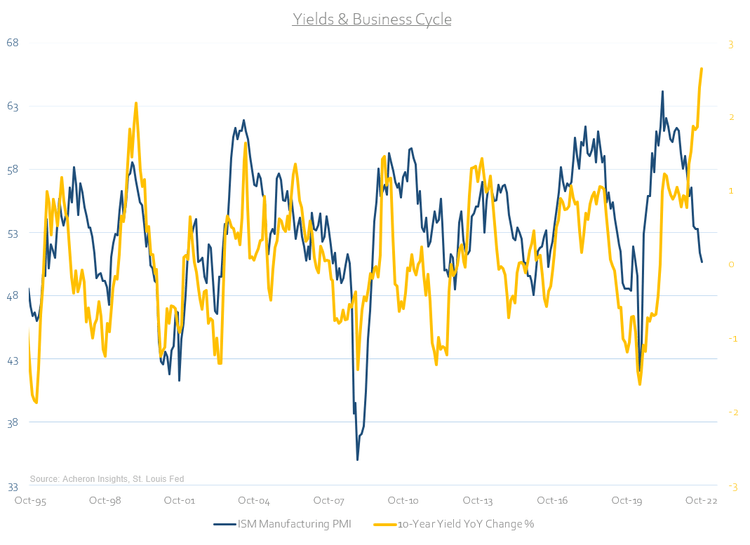
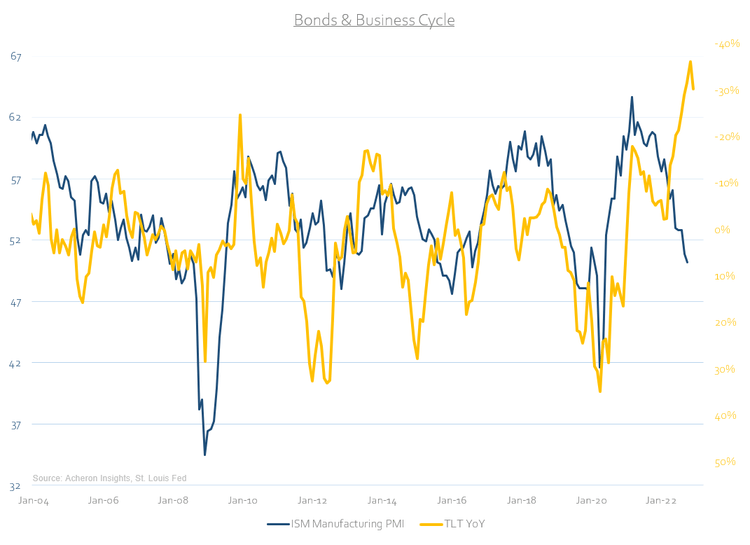
Clearly, from a business cycle perspective bonds are beginning to look undervalued. The ISM Manufacturing PMI has tracked the movements in yields and bond prices fairly well in recent history, with a significant set of alligator jaws opening up between the two. History suggests such divergences are, dare I say it, transitory. It is not hard to make the case that from a business cycle perspective it is only a matter of time before yields move lower to reflect the economic reality facing markets.
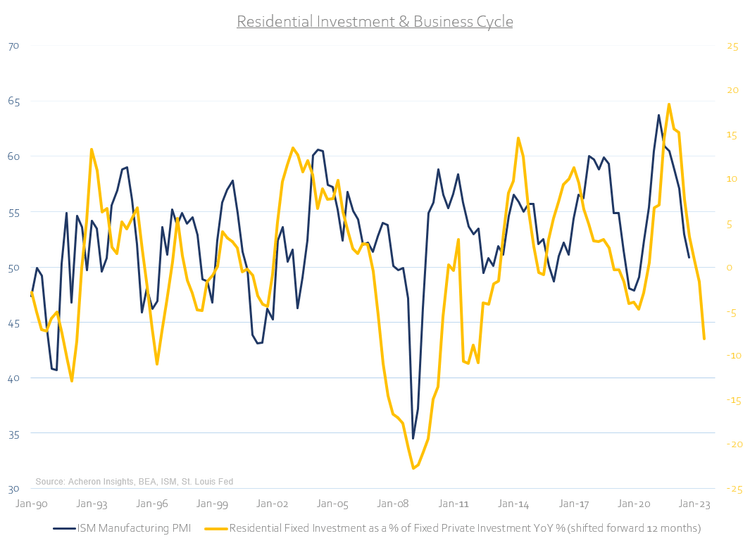
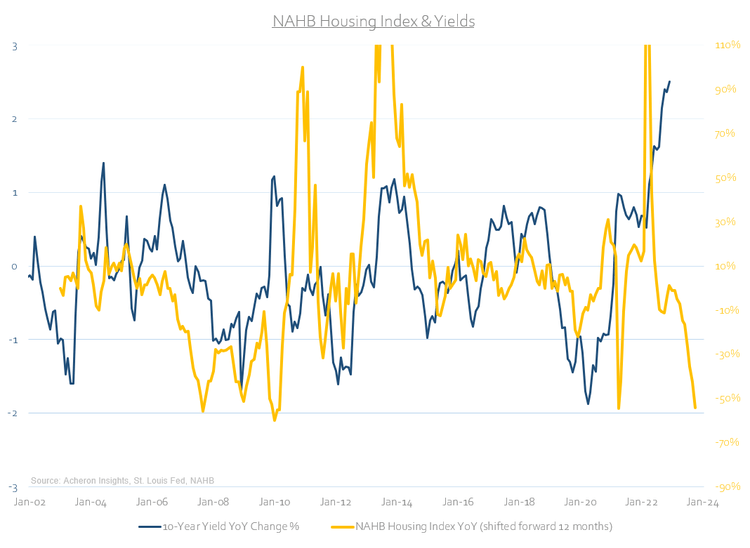
This divergence only grows in intrigue when assessed relative to the outlook for the economic growth cycle, which remains poor. Led by housing in particular, the leading indicators of the business cycle suggest the slowdown will only accelerate in the coming months. Residential investment plays a significant role in driving economic activity, and is suggesting a sub-45 PMI is on the cards next year. Likewise, the NAHB Housing Index trends to provide a good directional lead on yields and is suggesting they should move lower in the coming quarters.
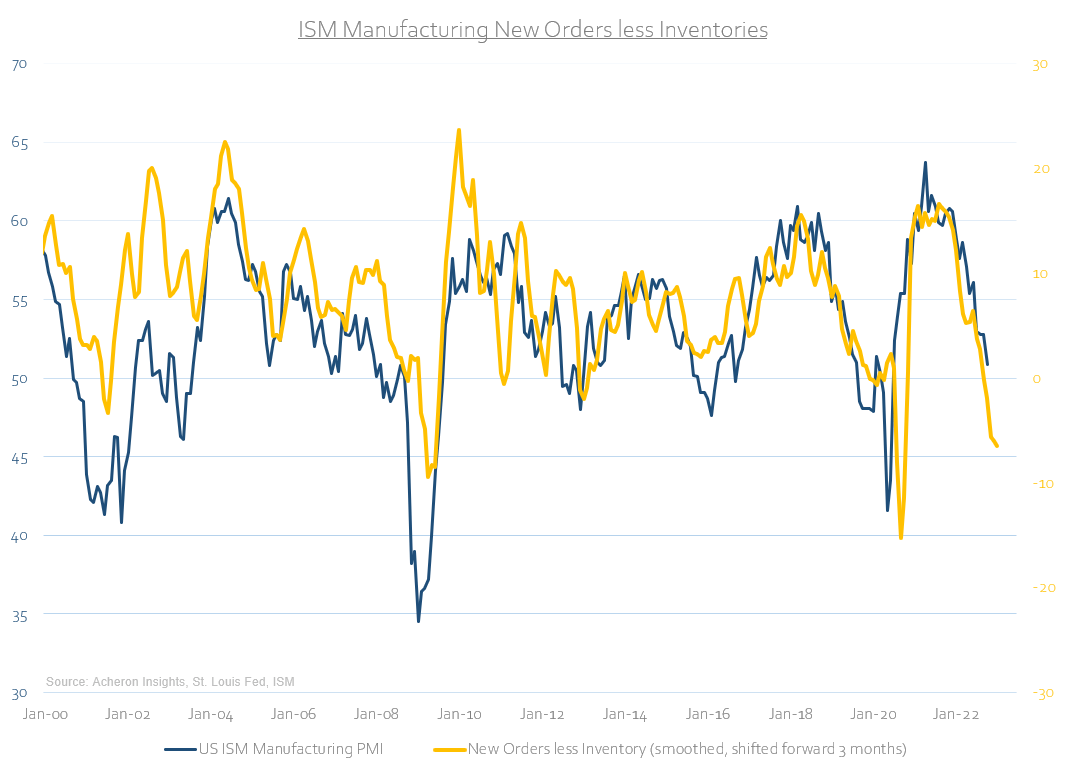
Another reliable leading indicator of the growth cycle is the ISM Manufacturing New Orders less Inventories spread. This indicator generally has a good track record of predicting the near-term moves in the overall Manufacturing PMI. It is suggesting we could see a ~45 reading as soon as February.
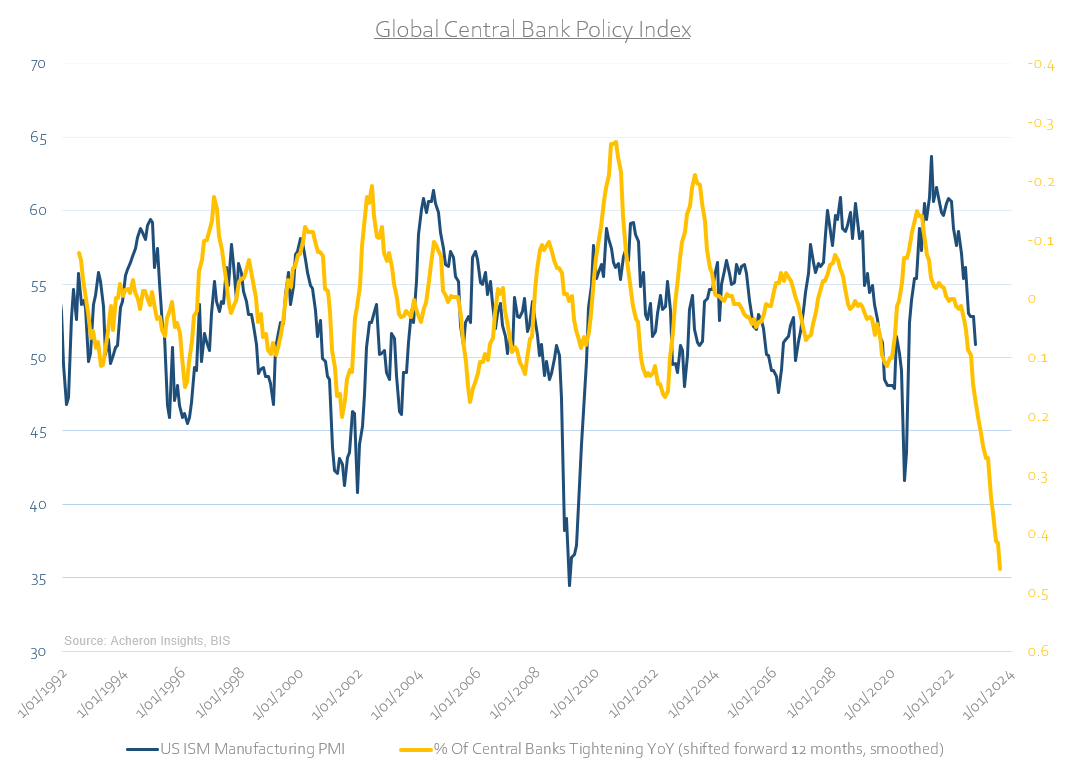
Meanwhile, global central banks continue down their war-path against inflation. Economic growth will be the sacrifice. One would suspect yields will eventually adjust lower accordingly.
Of course, growth expectations are only one part of the term premium associated with bond yields. Inflation expectations play just as important a role, as we have learned in recent times. Is inflation peaking? Yes. What’s more, it will likely roll over quickly in the coming months, as I detailed in-depth here. I am of the opinion inflation will not reset back to the 2-3% range that will comfort policymakers, primarily due to the stickiness of services inflation and the ongoing fundamental case for higher energy prices and thus higher food prices (among many other shifting secular trends). That withstanding, it is true that a material deceleration in inflation back to the 4-5% range in the coming quarters is likely to be supportive of lower bond yields and higher bond prices, particularly when coupled with slowing growth.
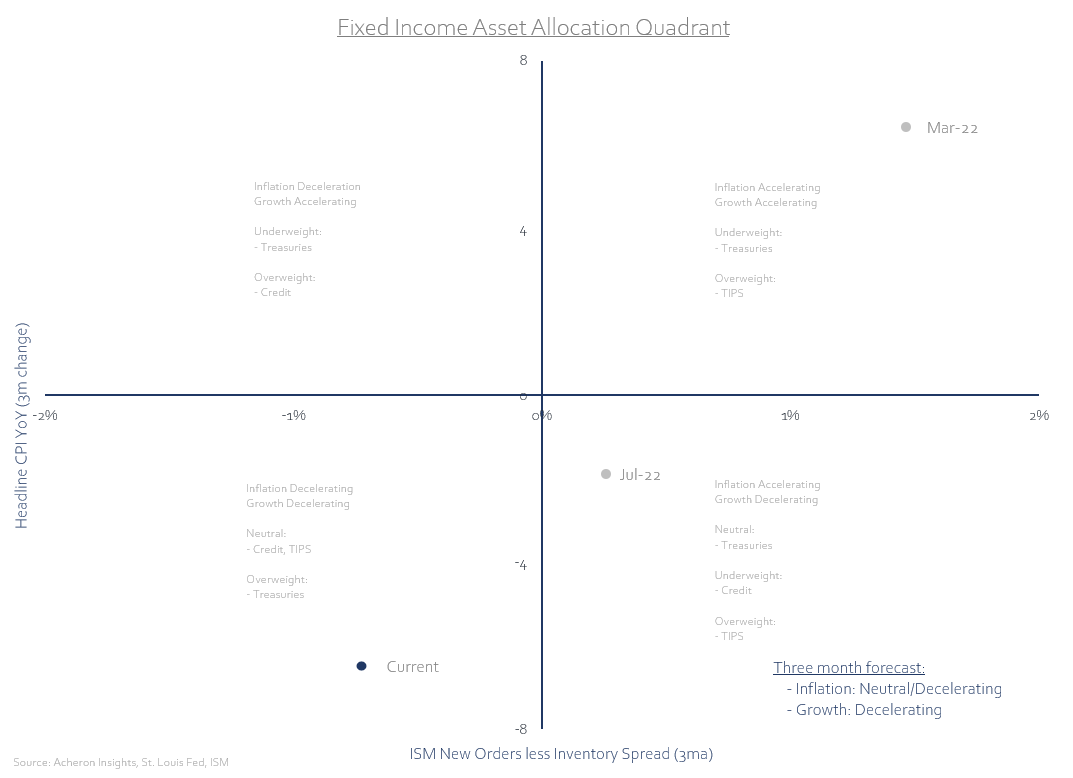
One way I like to visualise my asset allocation decision-making towards fixed income is through the lens of a simple growth and inflation matrix, or quadrant. Decelerating growth expectations and decelerating inflation expectations in unison are generally a good indication it may be time to start considering some exposure to duration, with Treasuries being the obvious candidate. The further we move toward the bottom left corner of this matrix, the stronger the fundamental case for bonds.
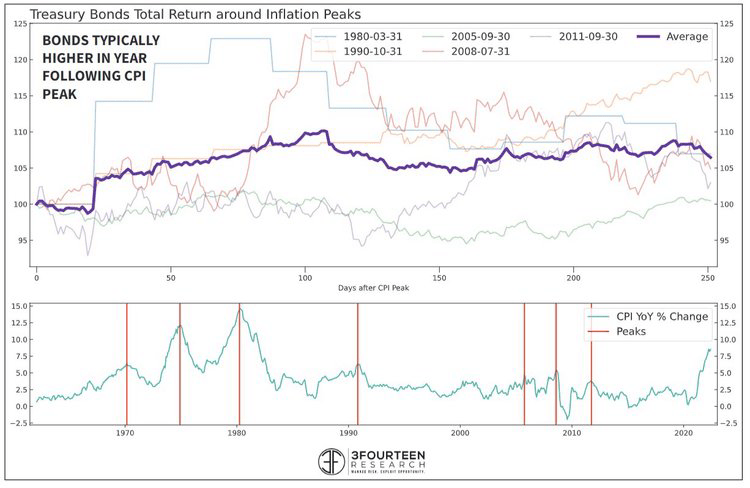
Should my forecast for a peaking or near-peaking inflation prove prescient, then lower bond yields may be the trade for 2023. Unsurprisingly, peaking inflation has an excellent track record of preceding lower bond yields in the year ahead. As noted by 3Fourteen Research, “bonds have never had a down year following a major inflation peak.”
Source: SentimenTrader Source: 3Fourteen Research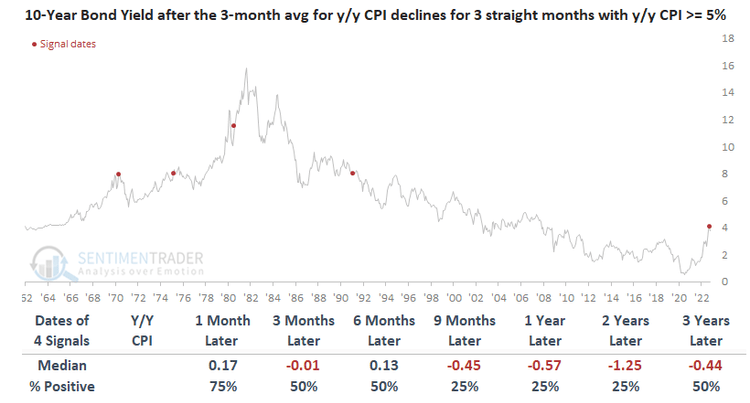
What’s more, in an environment of slowing growth and slowing inflation, history tells us that bonds are a better option than stocks. Despite your opinion on the secular outlook for bonds, they are becoming ever more attractive relative to stocks on a cyclical level.
Source: AQR Capital Management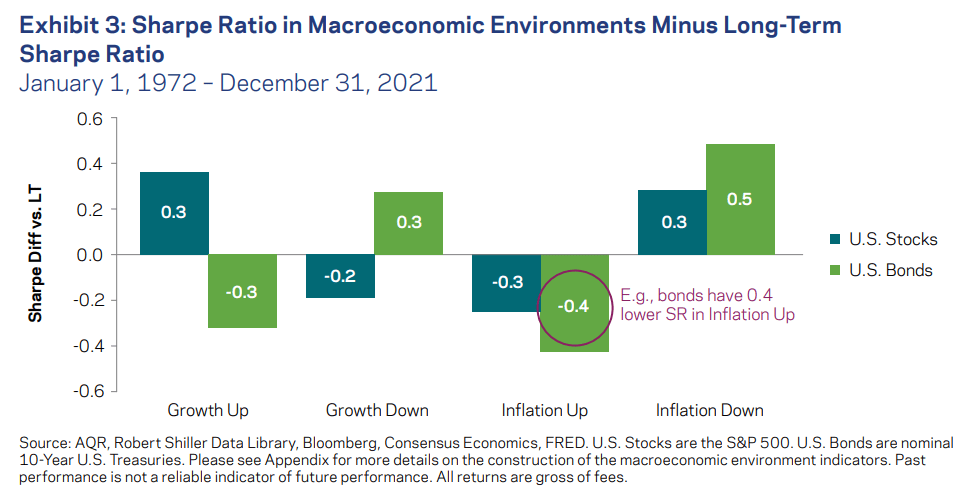
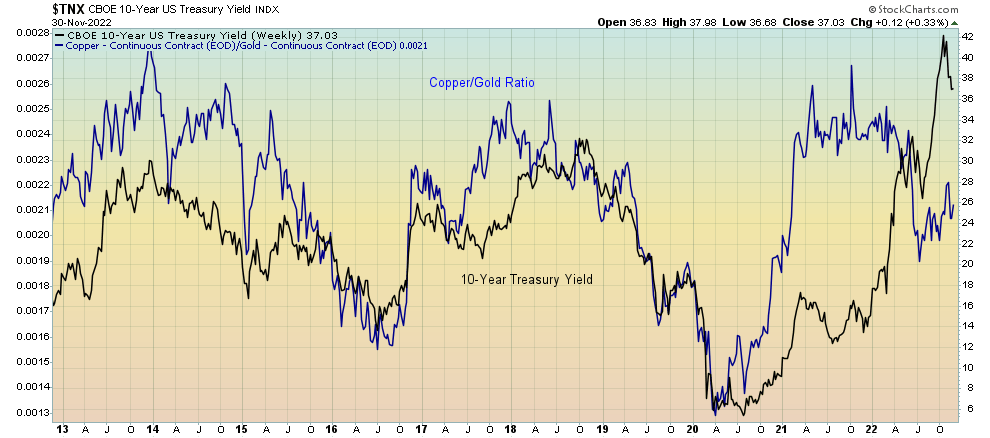
If we turn now to market internals and bond proxies, the case for lower yields becomes even more obvious. Firstly, the copper to gold ratio has a long track record of predicting where yields are heading. Once again, there is a clear divergence between the two and the copper to gold ratio suggests the move in yields has become stretched.
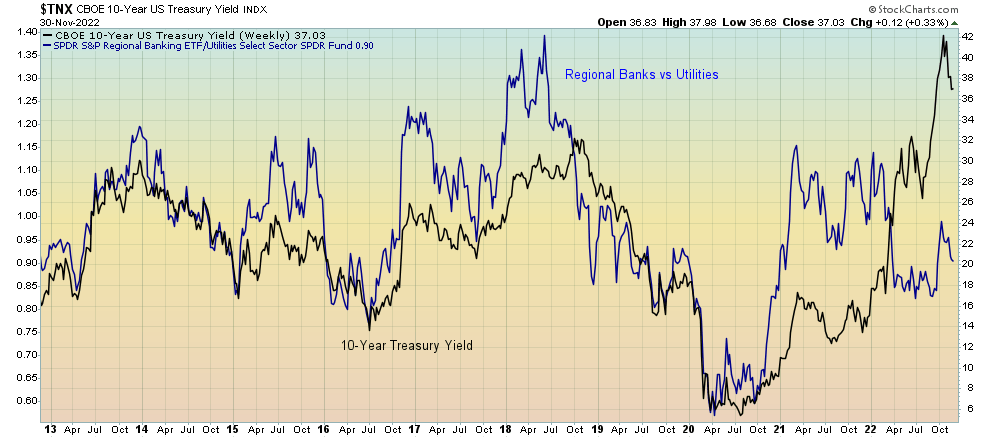
Likewise, the relative performance of regional banks relative to utilities stocks is sending a similar message.
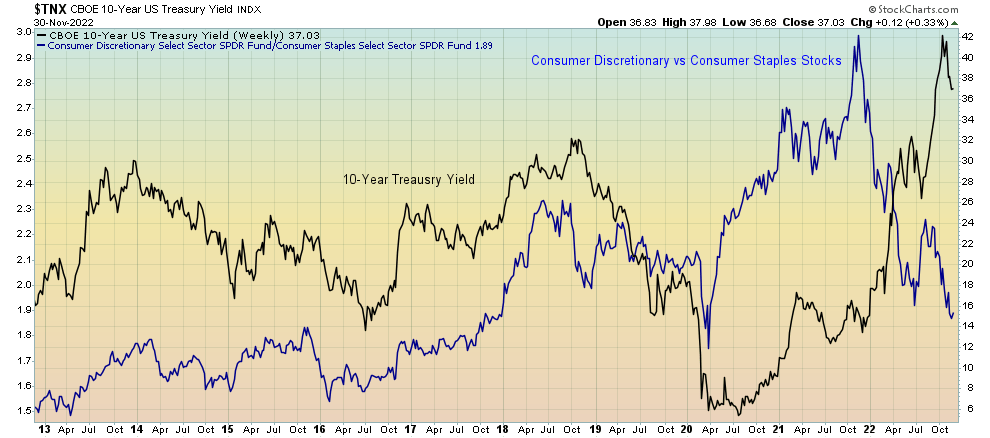
As is the ratio of consumer discretionary stocks versus consumer staples stocks.
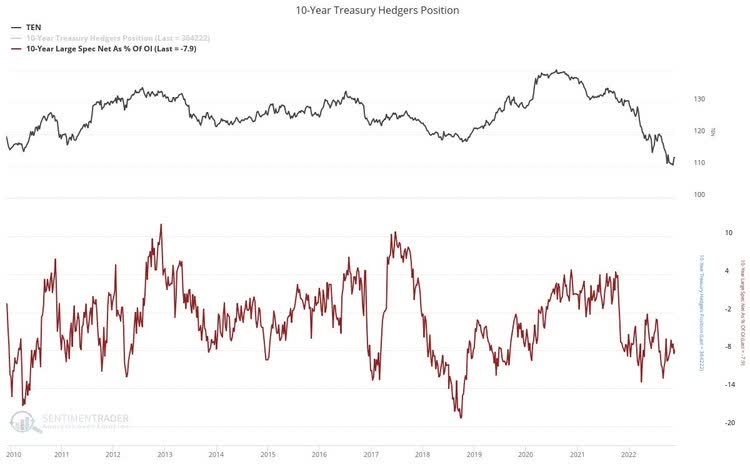
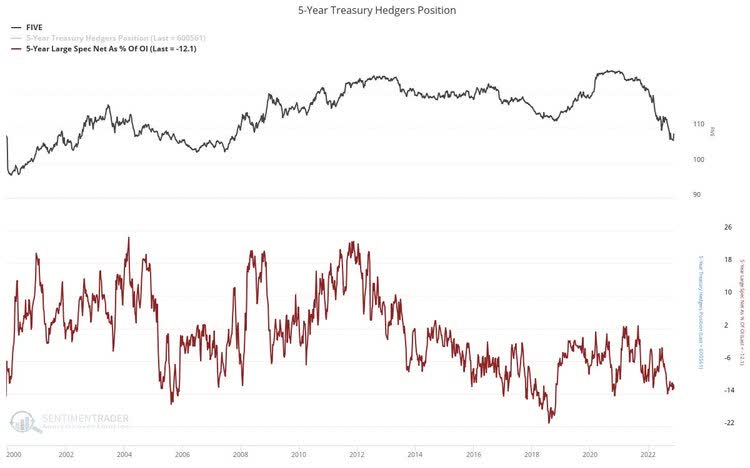
From a sentiment and positioning standpoint, bonds remain despised as an asset class. If we look at speculative positioning in the futures market, speculators are still significantly short. Though not a useful timing tool, this is a fairly reliable contrarian indication. Should yields reverse lower, there is plenty of potential for a prolonged short-squeeze as hedge funds and trend followers close out their shorts and chase bonds higher.
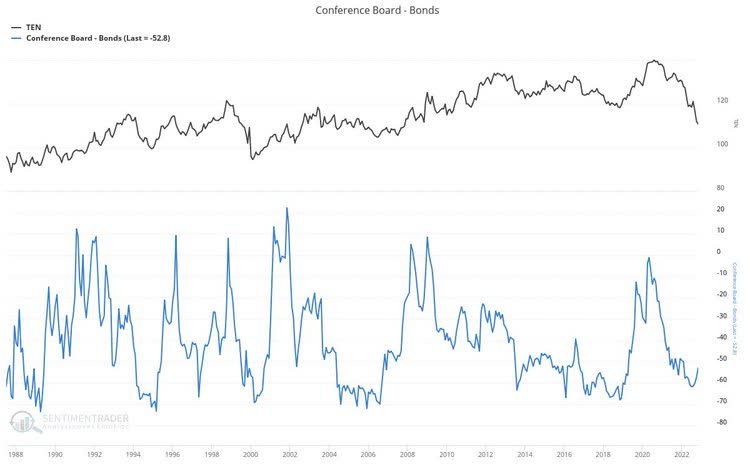
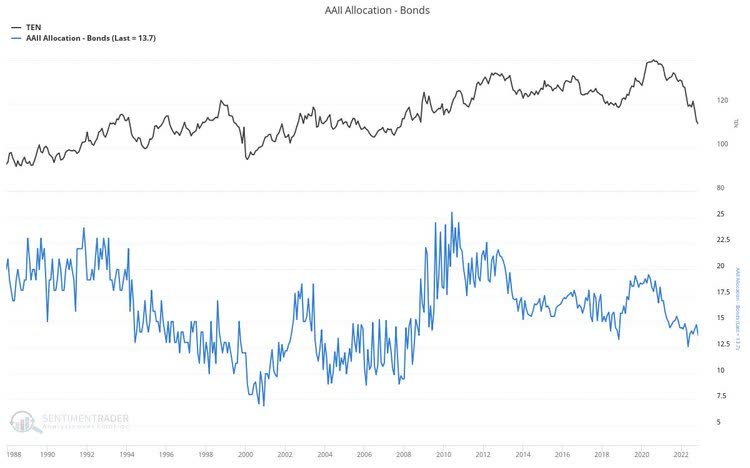
Similarly, the Conference Board survey for bonds, which measures the net percentage of consumers expecting bond prices to increase, has fallen back to near multi-decade lows. The AAII Survey of participants positioned in bonds is too at decade lows.
So, when should we buy bonds?
Though fundamentals, sentiment, and positioning are all useful tools in identifying investment and trading opportunities on a cyclical level, none are overly useful in identifying tactical entry points. For this, market technicals are of greater use.
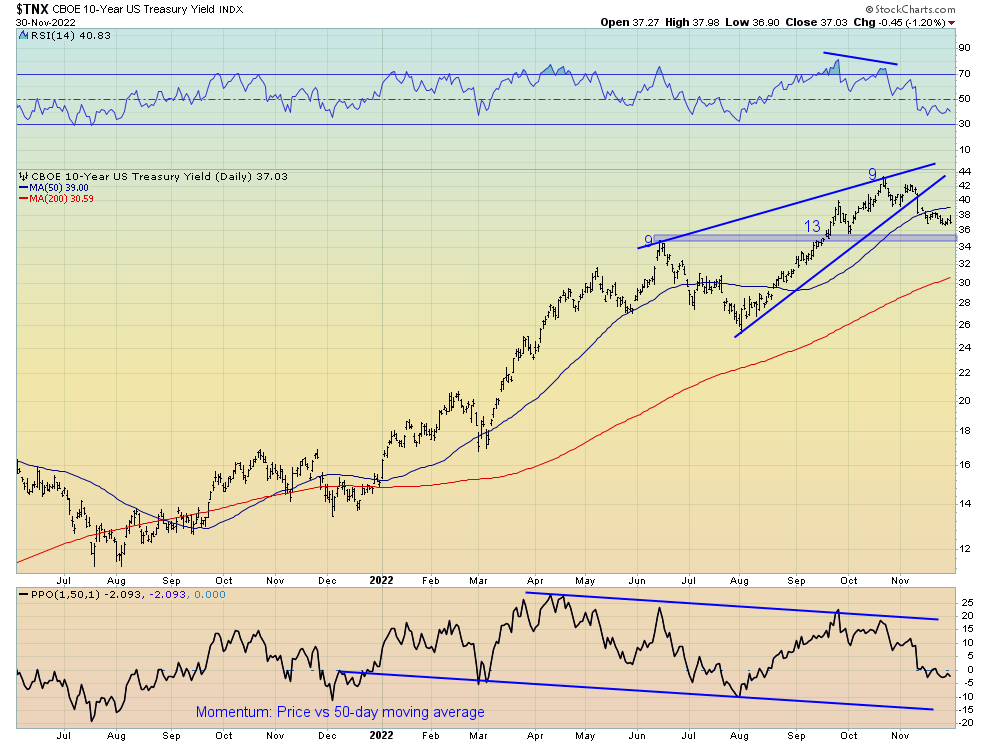
Indeed, from a technical perspective the 10-year Treasury yield recently broke down out of its bearish ascending wedge pattern, which occurred on the back of a daily 9-13-9 DeMark sequential sell signal. Clearly, the price action in yields over the past few months has looking rather toppy, with waning momentum and trend exhaustion. Support now stands around the 3.4-3.6% yield area, and should we break lower it would likely be confirmation the cycle top for yields is in.
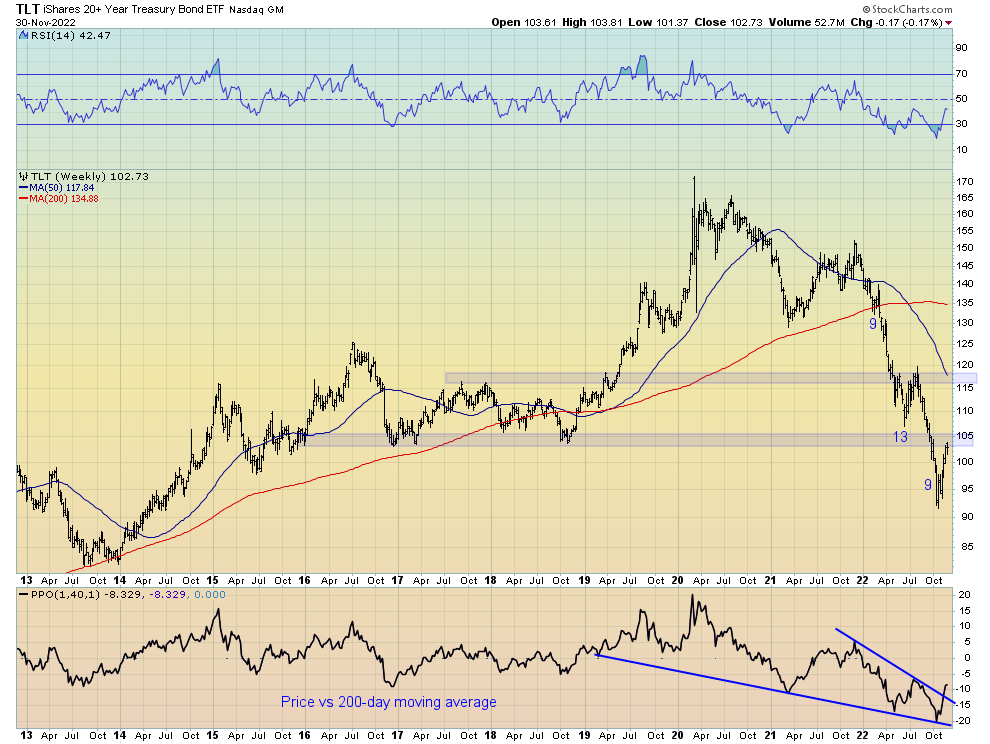
For bonds themselves, here proxied via the TLT ETF, though the recent move higher appears constructive, for me to be more willing to accept a reversal in trend, we ideally need to see a breakout of the downtrend line and for price to form a higher low. Trying to catch falling knives is not good business. Given we are now testing the lower boundary of this downtrend which has coincided with a daily DeMark 9 sequential sell signal, TLT looks in need to a rest for now.
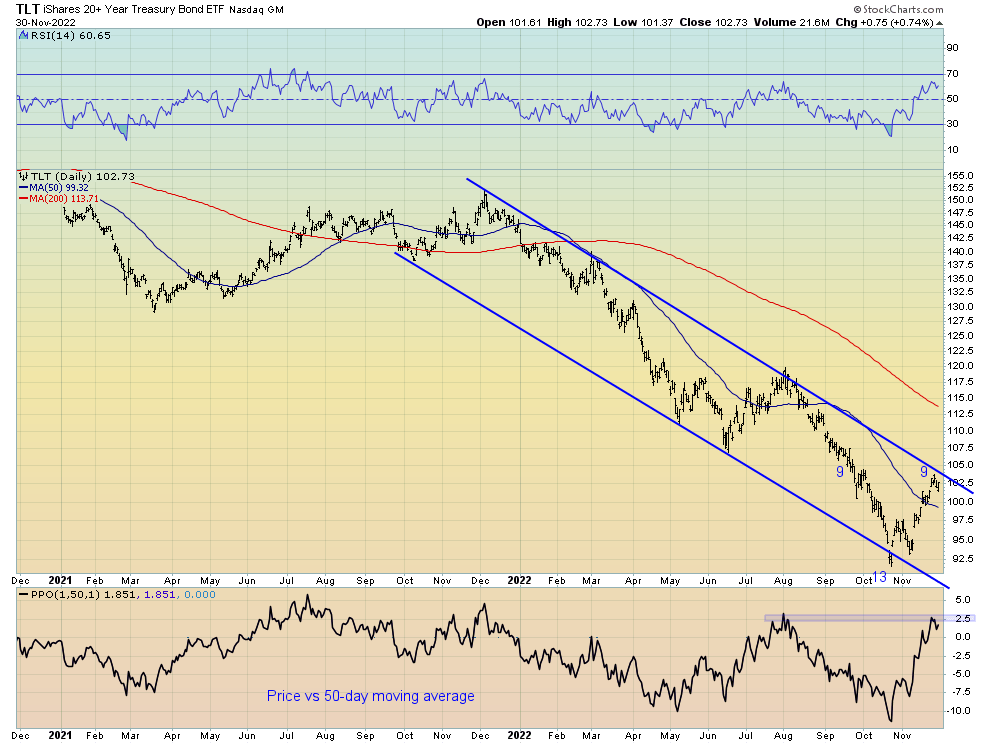
Longer-term, the $105 area represents an important point, having proved a significant support level a number of times over the past six to seven years, and is now acting as resistance. A break above this level or for price to form a higher low around $95-$100 appear intriguing entry points.
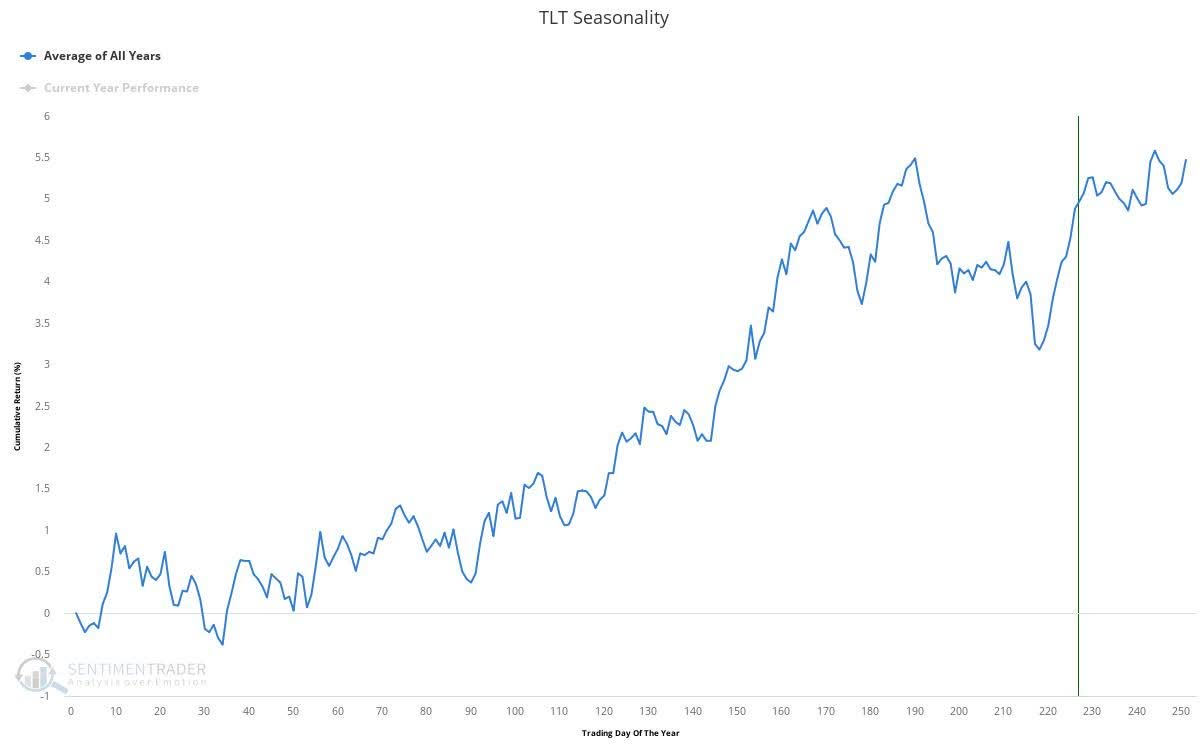
From a seasonality perspective, the recent rally has occurred during what is historically one of the best periods for bonds in the second half of November. While the December through January period has generally seen sideways price action for bonds. Perhaps yields just trend sideways for the next few months before we see a material deceleration in growth and inflation as we progress through 2023.
For now, patience is warranted. The all-in moment for bonds will be when we see inflation momentum truly roll over, and policymakers shift from inflation hikes to growth cuts. This is not likely until recession risk begins to overwhelm markets and enough buyers are willing to absorb the plentiful number of Treasuries for sale.
We are not there yet, but we may not be far off.
Be the first to comment