

malamus-UK/E+ via Getty Images
Written by Nick Ackerman, co-produced by Stanford Chemist. This article was originally published to members of the CEF/ETF Income Laboratory on June 26th, 2022.
Tekla Healthcare Opportunities Fund (NYSE:THQ) enjoyed a strong performance in 2021. In particular, the share price performance had eclipsed the performance of the underlying portfolio quite meaningfully. Of course, that means that THQ’s discount had rapidly disappeared. The fund rushed to a premium. This was along with several other funds that had never traded at a premium before.
Asset prices across the board were inflated and it was really a tough year to find some great values. I always put money to work every single month, no matter what. However, it really was harder to find things to be enthusiastic about in 2021. This has now been reversed as the broader markets have been taken down in valuation. We also are seeing the usual discount widening in the closed-end fund space too. Which once again has put THQ back into a discount.
It isn’t necessarily the most attractive discount this fund has traded at, but certainly much more tempting in terms of being able to add to my position. The overall declines in the broader market have also brought the price down for this fund. So we are getting the market decline and the discount on the fund in combination.
On top of this, the economic picture is uncertain. What better way to add to some healthcare exposure when that is the case. It is a defensive sector and THQ – while leveraged – invests primarily in larger-cap traditional healthcare names (i.e., not heavily tilted towards the volatile biotech space.) If people need a prescription or break an arm, they will require healthcare companies’ services or products if we are in a recession or not.
The Basics
- 1-Year Z-score: -0.40
- Discount: 4.52%
- Distribution Yield: 6.45%
- Expense Ratio: 1.17%
- Leverage: 20.06%
- Managed Assets: $1.122 billion
- Structure: Perpetual
THQ “invests across all healthcare sub-sectors and a company’s full capital structure.” They mention full capital structure, but the majority of the portfolio is in equity securities. Equity positions and warrants came to 85.7% of the fund, a small increase from the last time we visited this fund. The overall strategy leaves them mostly free to invest how they see fit within the healthcare space. The fund will also utilize an options writing strategy.
The fund’s expense ratio comes to 1.17%. When including the leverage expenses, it comes to 1.41%. The fund’s leverage was tied to LIBOR plus 0.75%. With the discontinuation of LIBOR, it is now SOFR plus 0.75%. That means that as interest rates rise, the fund’s interest expense will rise along with it. That being said, the fund is moderately leveraged. That should help keep the negative impact here relatively minimal.
For some context, in fiscal 2019, the expense ratio, including leverage, peaked at 2.42%. This rate hiking cycle is set to be more aggressive, with a higher rate once it is topped out. That means we should expect the expense ratio to be even higher this time around at the peak. That’s something to consider before investing, but it is something that I’m comfortable with.
Performance – Defensive Healthcare Positioning
This fund has delivered some solid results historically. Being in a bull market and having some leverage certainly helped achieve these results.
THQ Historical Performance (Tekla)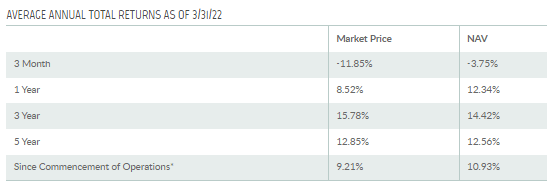
The healthcare sector is down significantly this year. However, relatively speaking, the healthcare sector has been holding up much better than the broader market. The sector is in the upper half of sector performance.
Sector Performance (Seeking Alpha)
I believe that’s the result of the defensiveness of healthcare. At the opening, I mentioned whether we are in a recession or not – people will get the medical treatment they need.
For comparison purposes, we can see the fund has lagged, which most investors would probably assign as its benchmark. That is the Health Care Select Sector SPDR (XLV).
Ycharts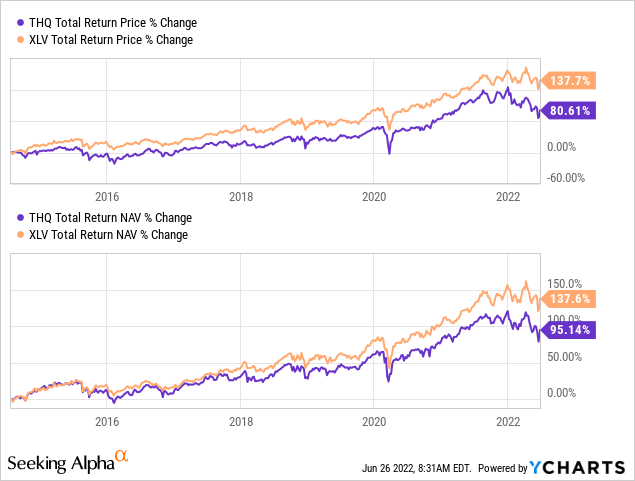
There are a couple of reasons for this. First, the fund does have some bond exposure that XLV doesn’t. They also have an options writing strategy that can limit capital gains in a bull market as the positions are called away. We also have a higher expense ratio that also likely plays a role.
Then it is also the fact that THQ is paying out the majority of its income, capital gains and/or return of capital. That’s how the distribution yield is so high. When the fund pays out its capital gains, those are assets it can’t retain to compound higher. That’s one of the main reasons you won’t see CEFs beat their “benchmark” sector ETFs.
With that, there are still periods where THQ can outperform XLV. One place it can get a good fighting chance is when the fund is at a discount as it is now. Here is a chart from the performance in 2021. On a share price basis, THQ outperformed as the fund stretched to a premium. At the same time, it still lagged a bit on the total NAV return level.
Ycharts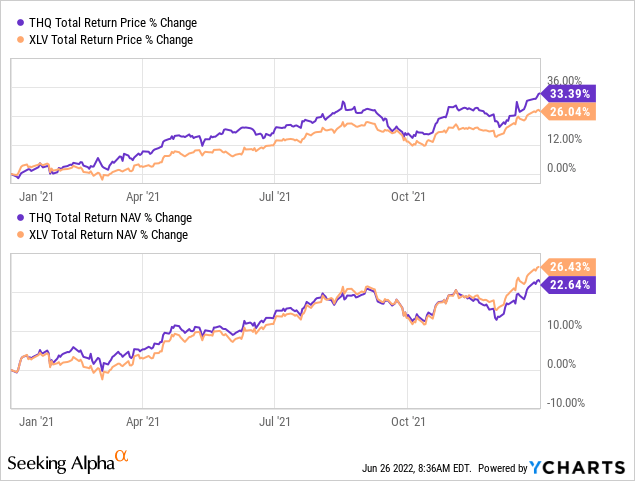
I’m not overly concerned with my THQ position beating XLV, but this helps highlight the importance of discounts/premiums in CEFs overall. This is something I don’t highlight in every single article, assuming a basic understanding of CEFs when writing. However, it’s a good reminder to find examples of this and show them every now and then.
The fund technically traded at a premium when it first launched. That always happened back before ~2018, though. When funds were launched, the fees were taken from the actual fund’s assets.
It was certainly a wild time when you think about it. For a fund sponsor, there was almost no reason not to pump out as many funds as possible. The investors paid for the offering fees. Then the sponsor collected a management fee potentially perpetually. Despite this, there still isn’t a huge amount of CEFs in the market. I digress.
When looking at the discount/premium chart for THQ, we can see the fund had briefly dipped right near its longer-term average discount. We can see how the fund flirted with an unusual premium in 2021. Today, the fund is a bit above its longer-term average but has come down substantially.
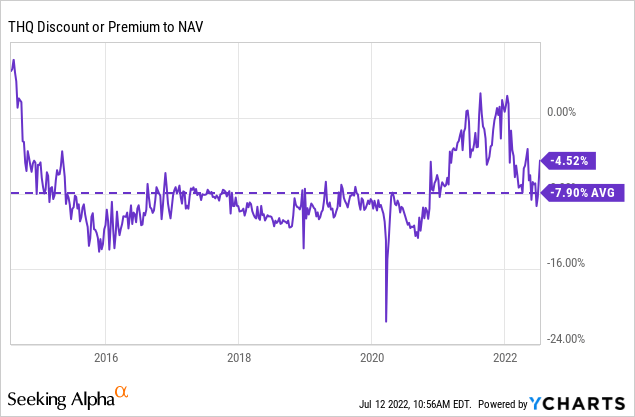
This puts us at a level where the fund might not be a screaming buy, but we are certainly at a more attractive discount level for the fund. Further discount expansion can happen, but there is more upside room than downside, in my opinion. This is especially true when you consider the broader market declines.
Distribution – Monthly, Sustainable Pay
The current distribution yield works out to 6.45%, with a reasonable NAV distribution rate of 6.16%. They’ve paid the same monthly distribution since the fund launched. The fund launched in 2014, so it might not be as impressive as it sounds initially. However, it does mean it survived the 2020 market collapse and, so far, this longer downturn in 2022.
THQ Distribution History (CEFConnect)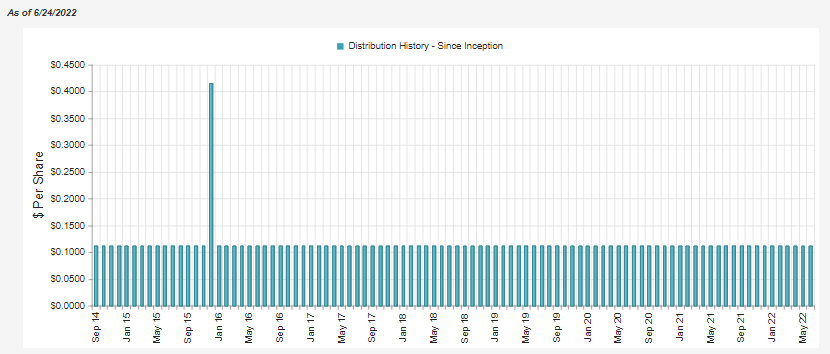
While I know this is a relatively lower yield, I wouldn’t necessarily want to see them boost right now. Instead, I’d rather get through this tough and uncertain economic period and accept a lower distribution for now. If I want a higher payout, I can simply add or DRIP the position for a while. That would create my own growth.
Interestingly, the fund generated no net investment income in the last six-month reporting period ended March 31st, 2022. This is quite unusual given the strong underlying dividend payers.
THQ Semi-Annual Report (Tekla)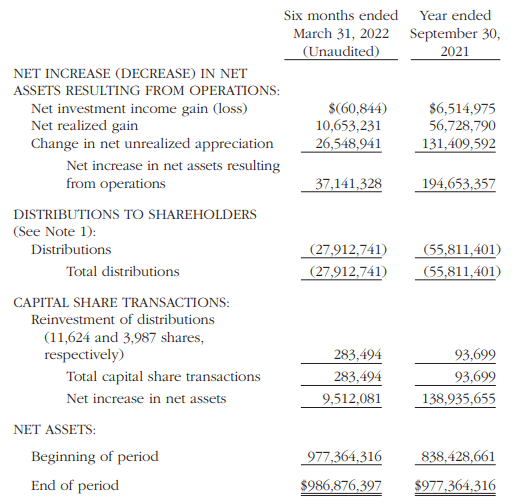
The fund’s expenses had offset all of the total investment income generated on the portfolio. They collected roughly ~$8.091 million in TII in this Semi-Annual Report, but last year, they generated ~$10.384 million for the same period.
The total expenses increased marginally, from $7.43 million to $8.152 million. The change in this would have resulted from the increase in AUM for the year.
Putting the fund into a net investment loss situation seemed to be directly linked to a reduction in TII (fewer dividends and interest collected in the previous six months over the prior six months last year.) This comes about simply from portfolio turnover. It’s a constantly changing, actively managed portfolio. We won’t see steady growth as some might in their own personal dividend growth portfolios when we keep core positions constant for years.
The fund’s options strategy generated meaningful capital gains for the reporting period. This is important to remember because even though the portfolio might be harder to find realized capital gains – the fund’s options strategy can generate gains no matter the market direction.
THQ Semi-Annual Report (Tekla (highlights from author))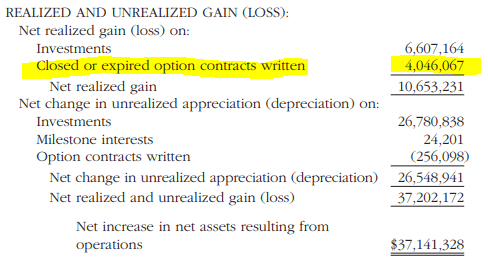
From my own 1099, it appears that the tax classifications for 2021 came out to around 43% capital gains, 35.3% as ordinary income and 21.6% as qualified dividend income. This could make it appropriate for a taxable or a tax-sheltered account. The ordinary income isn’t necessarily great, but the bulk of the distribution is usually more tax-friendly.
THQ Annual Report (Tekla)
THQ’s Portfolio
When discussing the portfolio turnover, it is worthwhile to note that they are quite active. The turnover rate for the last several years has been 55%+. It looks as though it is trending to hit that turnover level again for this fiscal year. For the six months reported, the turnover came in at 23.29%.
More broadly, the portfolio is invested heaviest in equity assets, as mentioned above.
THQ Asset Allocation (Tekla)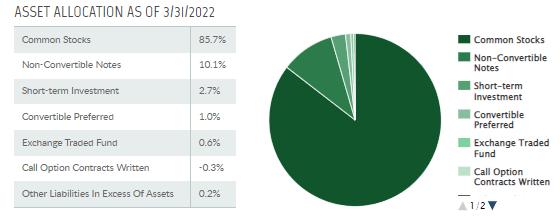
Non-convertible notes also have a fairly meaningful allocation for the fund too.
When digging deeper into the sector positioning of the portfolio, we can see that it is invested heaviest in pharma stocks and healthcare providers and services.
THQ Sector Allocation (Tekla)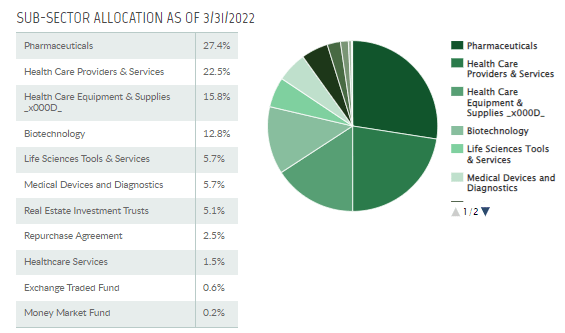
These are traditionally the more defensive healthcare names, those that can still perform well in slowing economic periods. Biotech, a more volatile area, makes up a meaningful ~13% but definitely isn’t holding the portfolio hostage. On a side note, though, biotech has been so beaten up that it is attractive at this time, in my opinion. Still, this highlights that THQ is the more traditional healthcare CEF exposure that some investors want.
With that sub-sector exposure, it isn’t surprising to see some of the top ten positions we do. At least for those that are generally familiar with the healthcare space…or just everyday life as these are the companies that advertise heavily.
THQ Top Ten (Tekla)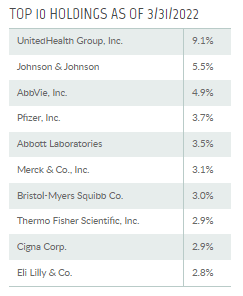
The top ten comprise a lofty 41.4% of the portfolio at this time. That’s only marginally up from the 41% allocation we saw back in September 2021.
UnitedHealth Group (UNH) commands the top spot and has even increased its percentage weighting lead over the others. Previously, we saw the fund carrying a 7.5% allocation, now going up to 9.1%. Though Johnson & Johnson (JNJ) also had its weighting increased.
In this basket of top ten, tracking performance from the end of September to the end of March, we can see that AbbVie (ABBV) was the clear winner by far. UNH had also had a phenomenal run during this time. JNJ languished but still managed to increase its weight in the portfolio without adding any new shares. They held 361,548 shares at the end of both of those reporting periods.
Ycharts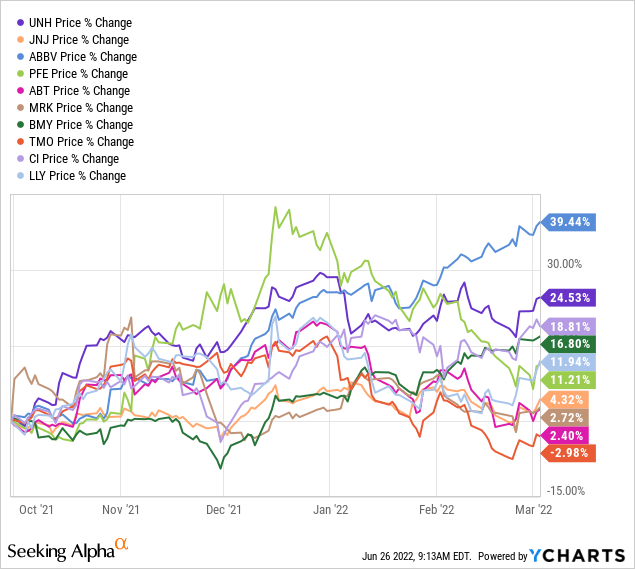
One position that made an appearance in the top ten was Pfizer (PFE). In this case, they substantially increased the number of shares they held during this time. It went from holding 266,910 to 694,625 shares. PFE is a strong dividend payer. They cut their dividend in 2009 but had aggressively grown it back since that time. The latest yield comes to an attractive 3.10%.
PFE Dividend History (Seeking Alpha)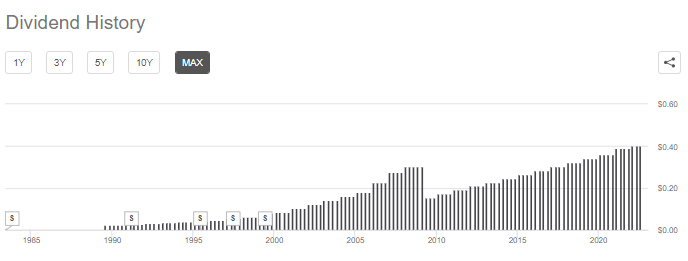
Conclusion
THQ has been struggling with most of the broader markets this year. However, the fund is holding up relatively well thanks to the healthcare exposure. The fund’s distribution is quite attractive and sustainable at this time. It hasn’t been increased since the fund launched, but it also hasn’t been decreased. A steady monthly distribution is exactly what some investors want too. Given the defensiveness of healthcare, this could be a position worth considering in the current environment.
Be the first to comment