

primeimages/iStock via Getty Images
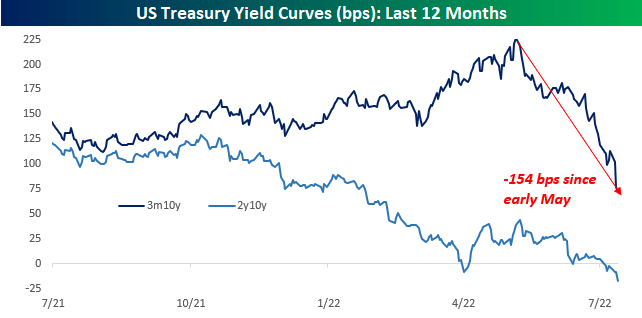
With inflation running out of control and markets furiously attempting to re-price Federal Reserve interest rate policy, we’re seeing some truly wild moves in the fixed income markets. This week, the big moves have come at the short-end of the Treasury yield curve as three-month Treasury yields have surged by 35 basis points this week alone. While the 2y10y US Treasury yield curve has been inverted for seven trading days now, the 3m10y curve, which is the FOMC’s preferred measure of the yield curve, has remained positively sloped, but the rate of flattening has really picked up in recent days and since early May has gone from around 225 bps to under 75 bps today.
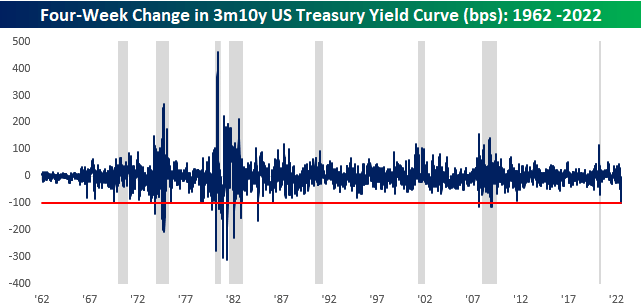
As mentioned above, the bulk of the flattening in the 3m10y curve has occurred more recently. The chart below shows the 20-day rate of change in the 3m10y US Treasury yield curve since 1962. The red line indicates the threshold for 100 bps of flattening in a four-week span which is where we are at now. Prior to the current period, there wasn’t a similar flattening of the 3m10y curve in a four-week span since the Financial Crisis. In August 2011, the rate of flattening got close to 100 bps in a four-week span but came up just shy. In other words, these types of moves in the yield curve don’t happen very often.
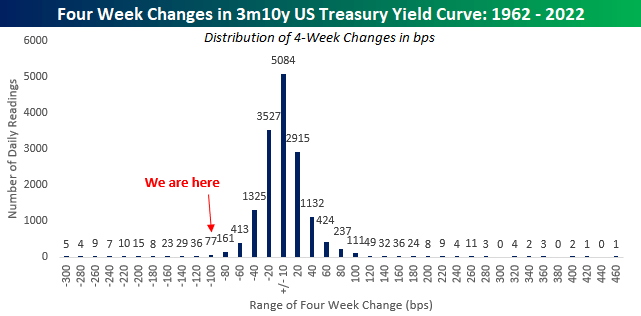
How often are they? The chart below shows the distribution of four-week changes in the 3m10y yield curve over time grouped into 20 bps increments. Including the last few days, where we are at in the current period (-100 to -120 bps of flattening in a four-week span) has only occurred on 77 trading days, and there have only been a total of 223 trading days where the yield curve flattened by 100 bps or more in a four-week period. On a percentage basis, that works out to less than 1.5% of all trading days. When it comes to markets, it seems as though there’s always something unique happening out there, and these days, you don’t see what’s happening at the short end of the Treasury curve very often.
Editor’s Note: The summary bullets for this article were chosen by Seeking Alpha editors.
Be the first to comment