

Jose Luis Pelaez Inc
The world is obviously a mess; all of the world economies are on the verge of collapse, and the Fed is going full-on Volcker (amputating metaphorical-toes to fit shoes instead of spending to get bigger shoes). However, when it comes to the market, what is obvious, is usually wrong.
The market is driven by money and fear. The fear has been here for months and the money is starting to come back into the market. There are reasons to be bullish.
Tuesday’s net-transfer (from the Treasury to the private-sector) was +$6.8B. The 20-day average improved, but remains negative. However, the trend is positive. This is bullish.
Net-transfers (ANG Traders, stockcharts)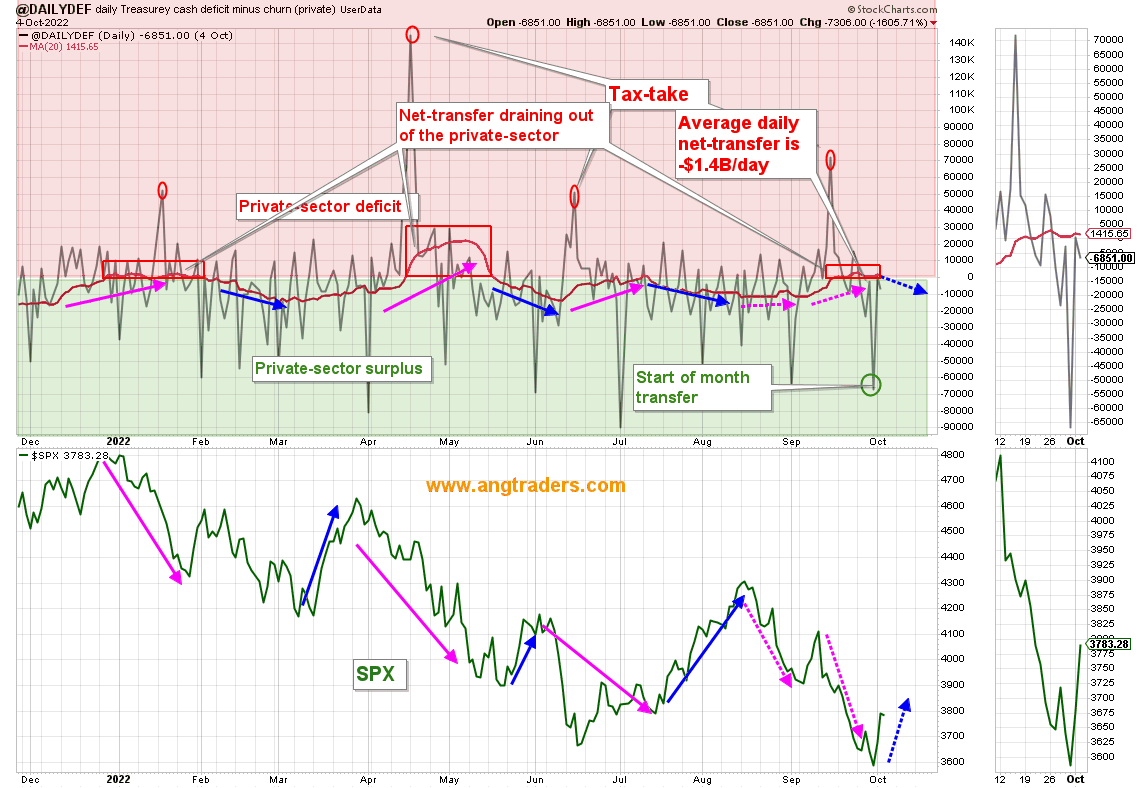
The IT volume oscillator RSI is about to cross above 30. This is bullish.
IT Volume Oscillator (ANG Traders, stockcharts)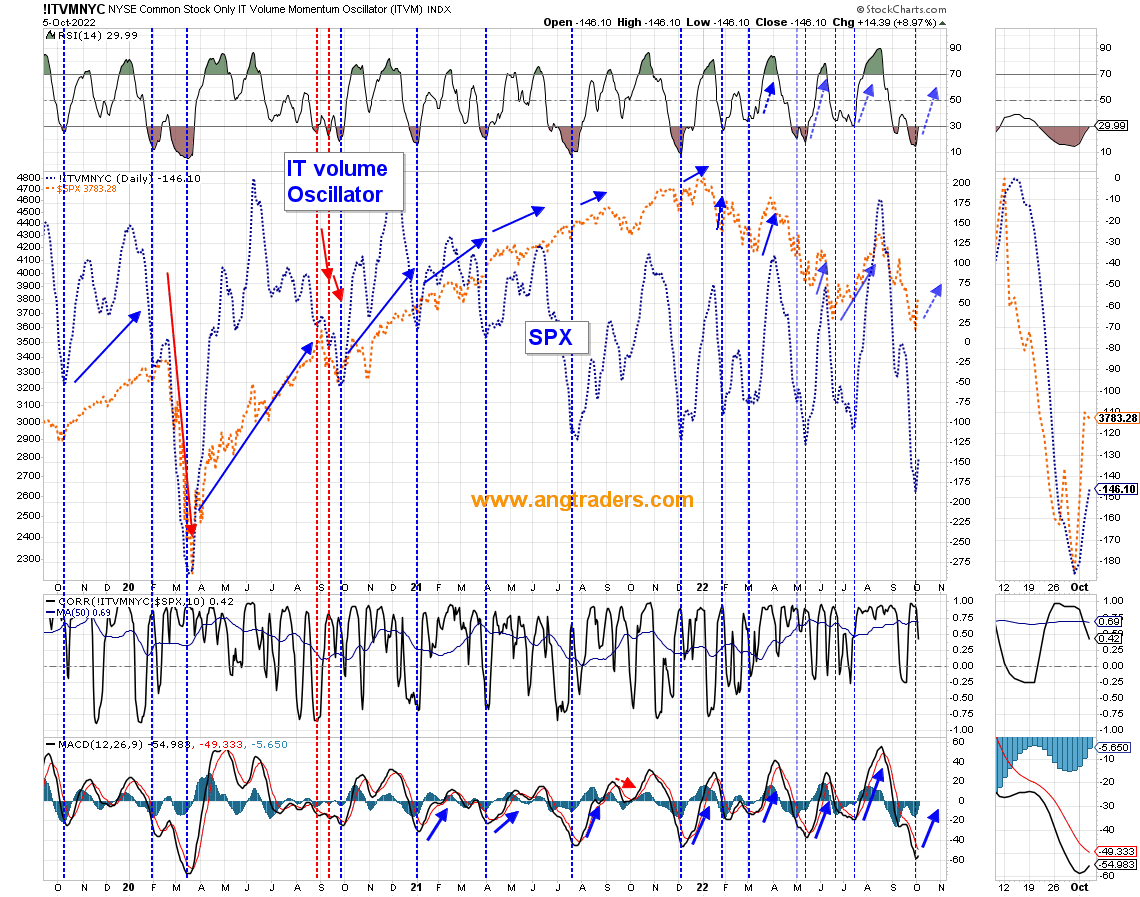
Thrust is bouncing from severally oversold level… and has a distance to cover before it reaches overbought. This is bullish.
Thrust (ANG Traders, stockcharts)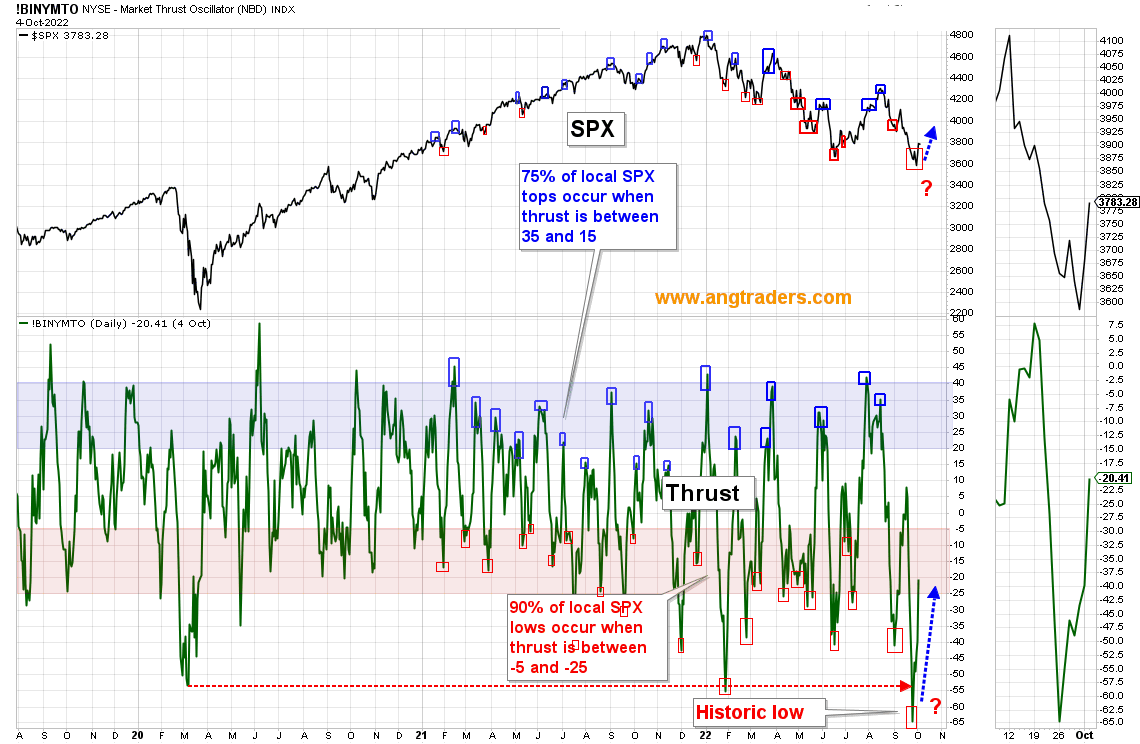
The PE:VIX ratio looks to be climbing out of its downward trend. This is bullish.
PE:VIX Ratio (ANG Traders, stockcharts)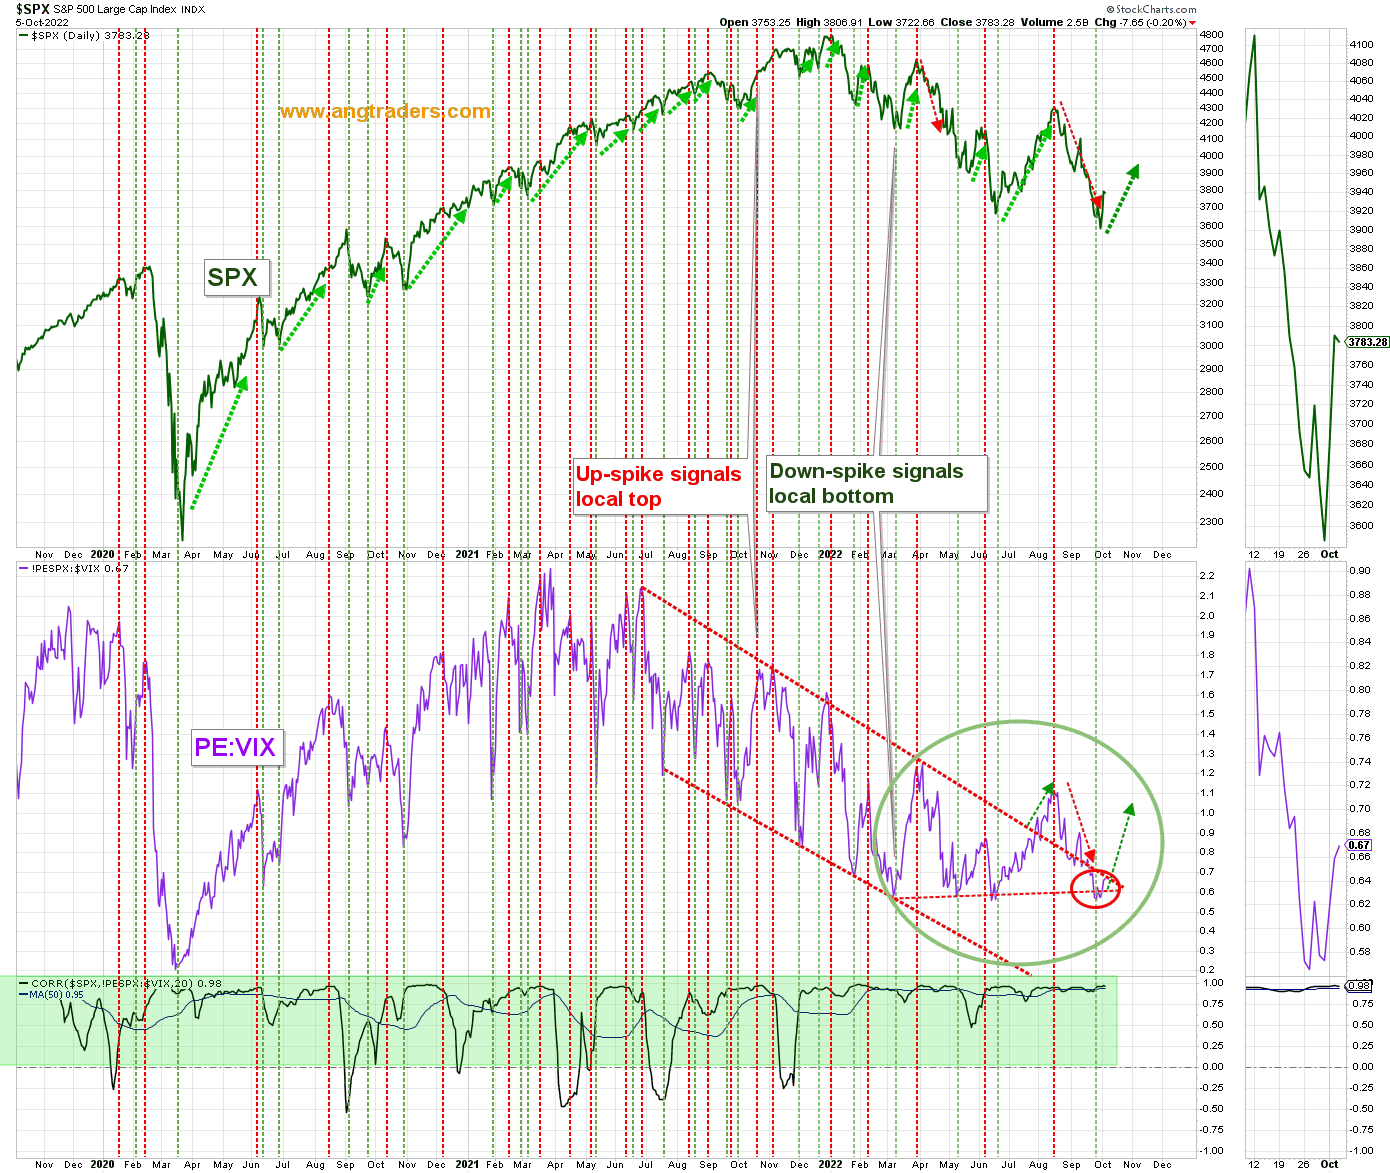
Equity put:call ratio is dropping back from extreme fear level. This is bullish.
Equity Put:Call Ratio (ANG Traders, stockcharts)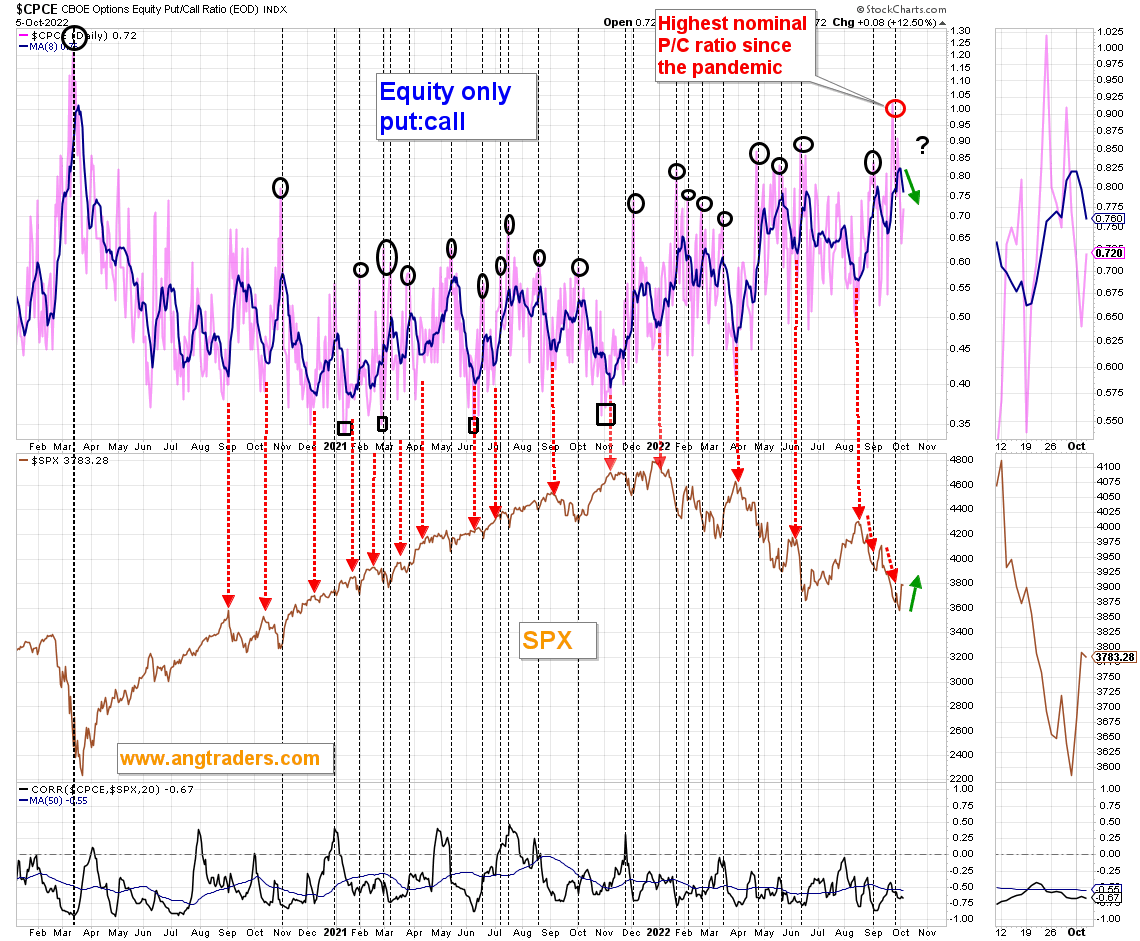
The nominal Rydex Bear:bull asset allocation ratio has spiked (green-oval). This is bullish.
Rydex Bear:Bull Asset Alocation (ANG Traders, stockcharts)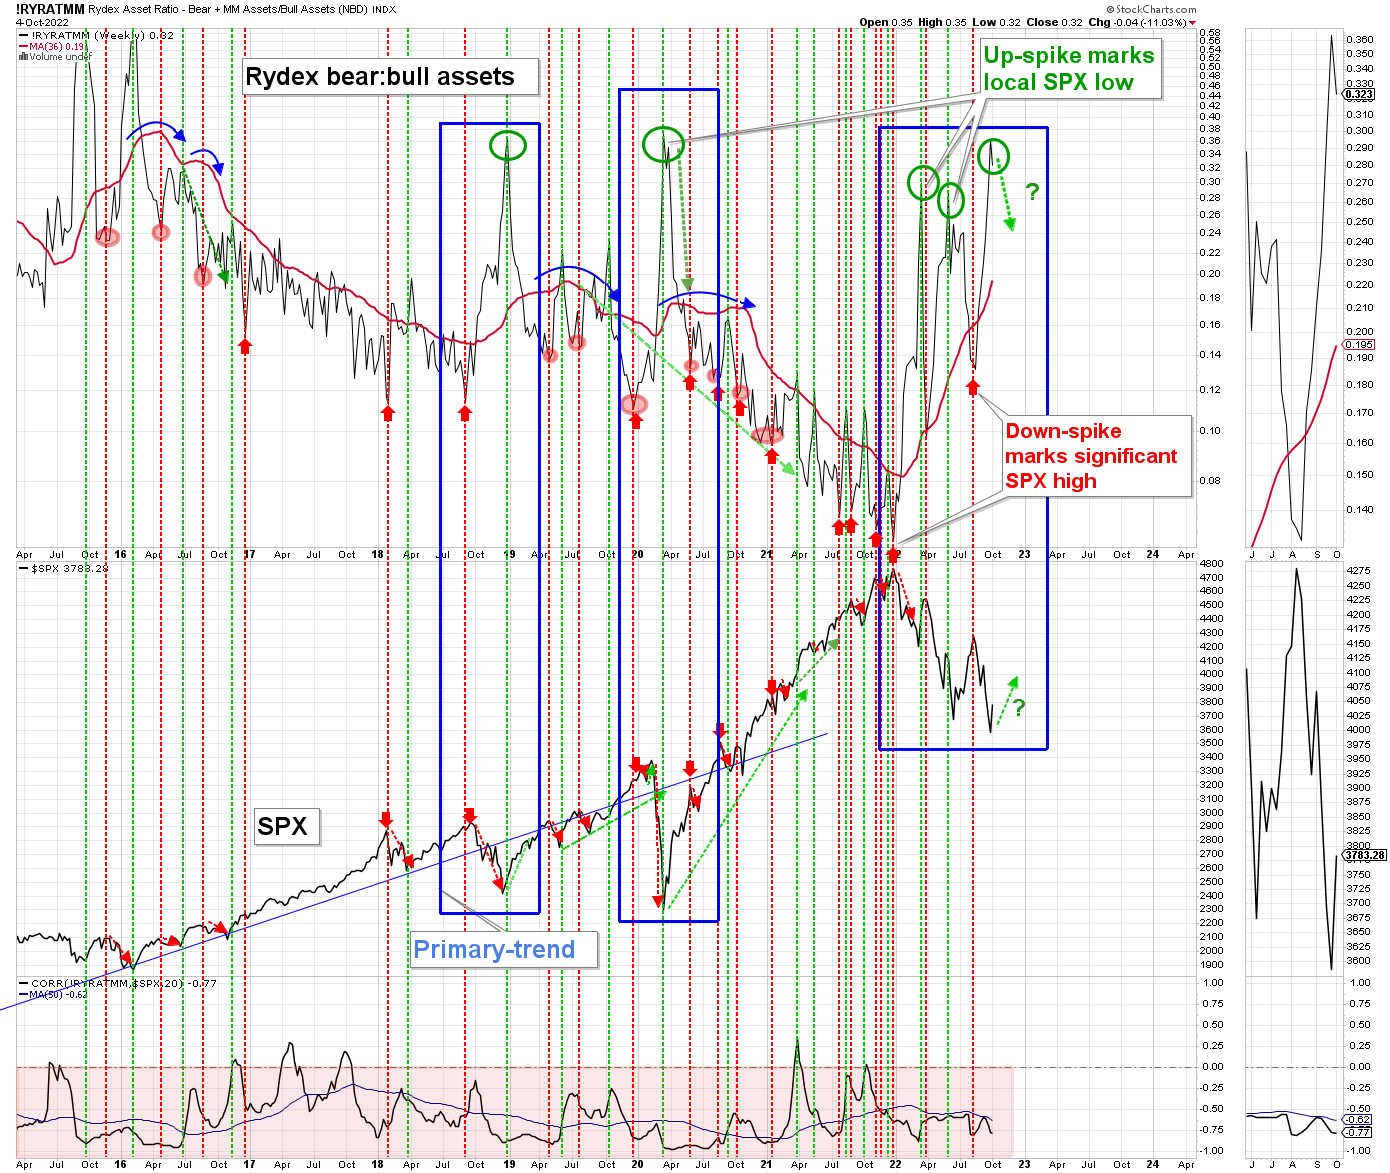
VIX is following the minor sine wave lower (green arrow). This is bullish.
VIX Weekly (ANG Traders, stockcharts)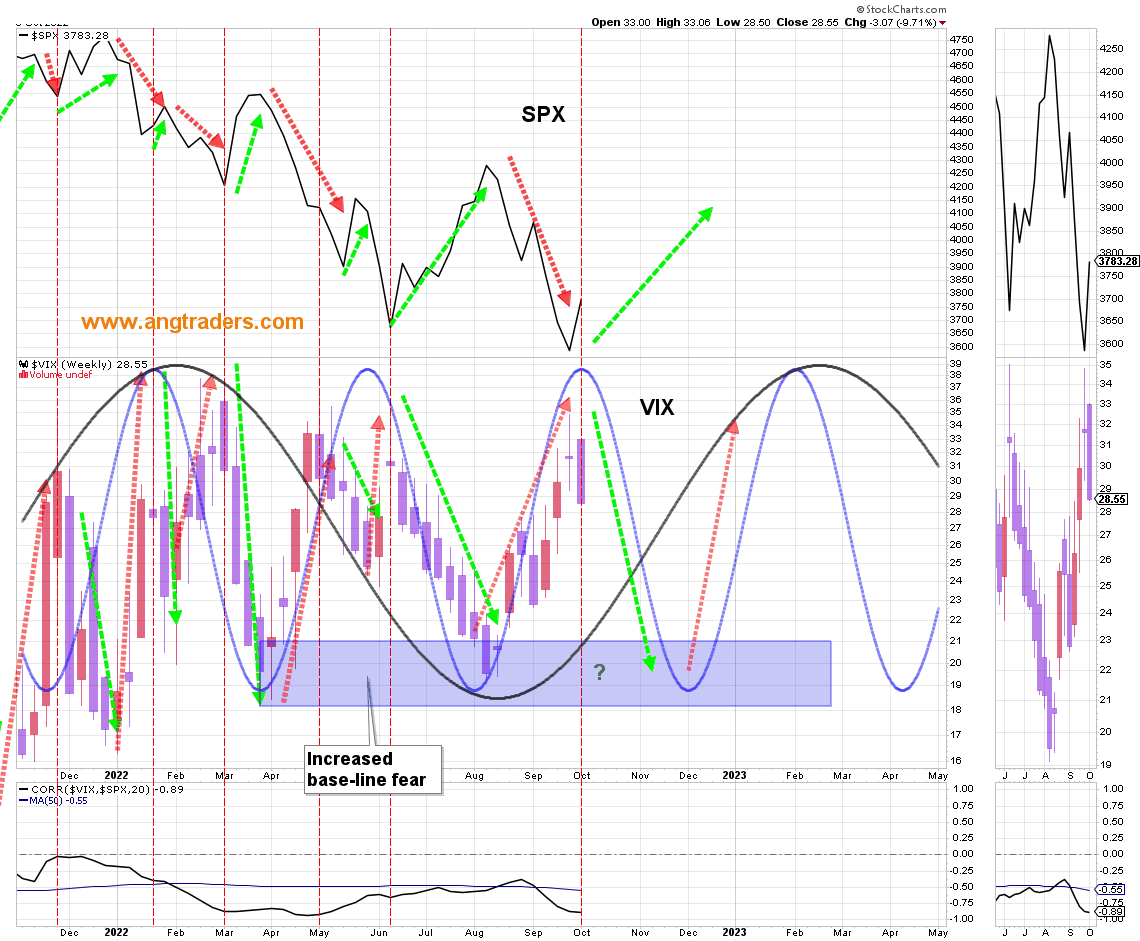
The hi-lo diff has made a down-spike. This is bullish.
HI-LO Difference (ANG Traders, stockcharts)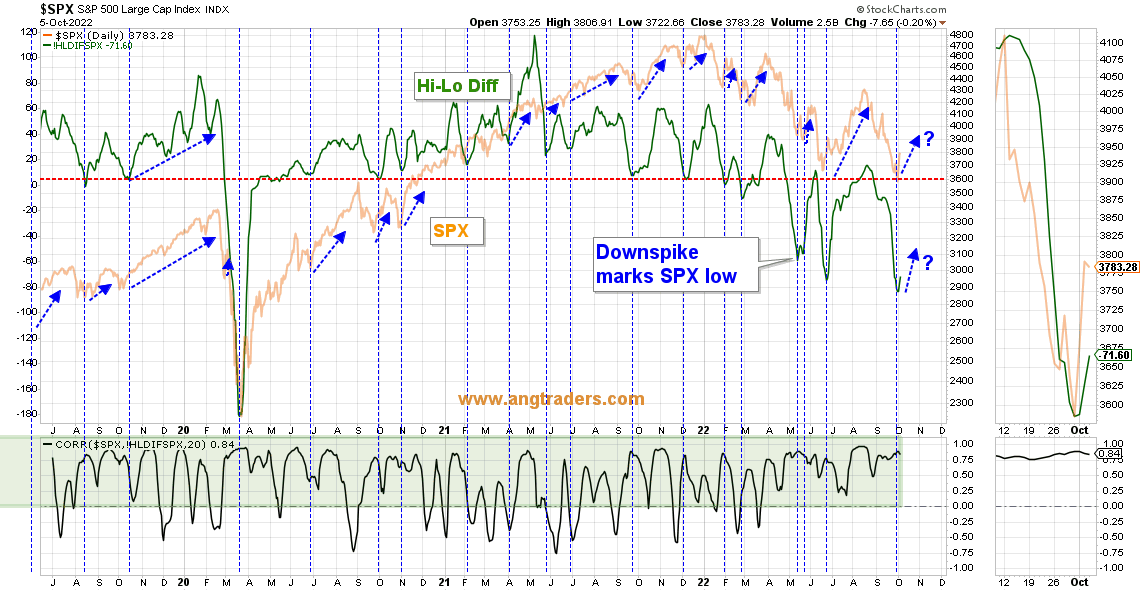
The fractal trading-range has made a double-bottom like occurred in the 2011 and 2015. These trading ranges last ~1-year so expect the market to push higher in Q4. This is bullish.
Fractal trading-range. (ANG traders, stockcharts.com)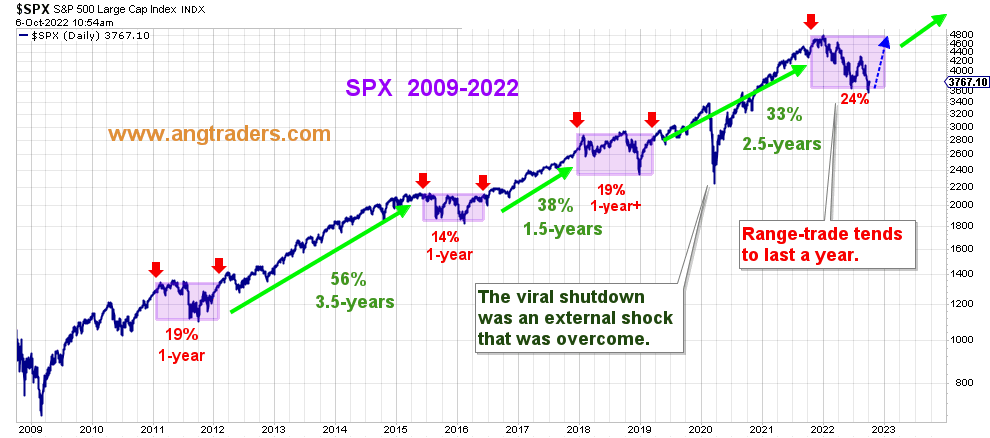
The QQQ technicals are rising above oversold levels. This is bullish.
QQQ (ANG Traders, stockcharts)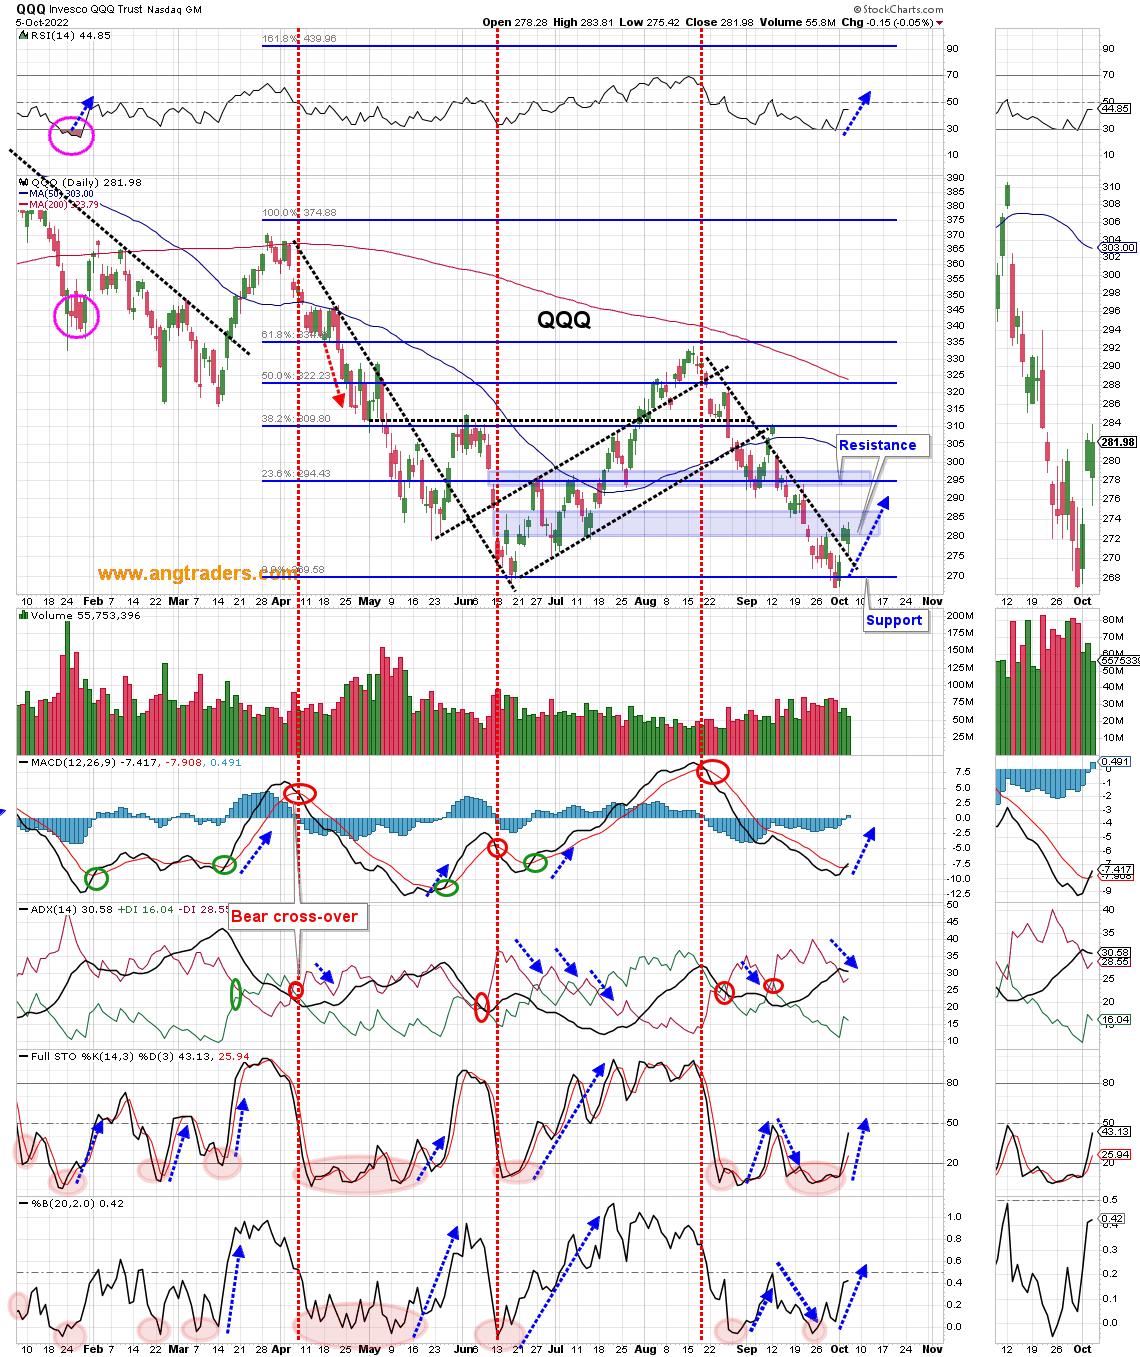
The S&P 500 technicals are bouncing off of oversold levels. This is bullish.
S&P 500 (ANG Traders, stockcharts)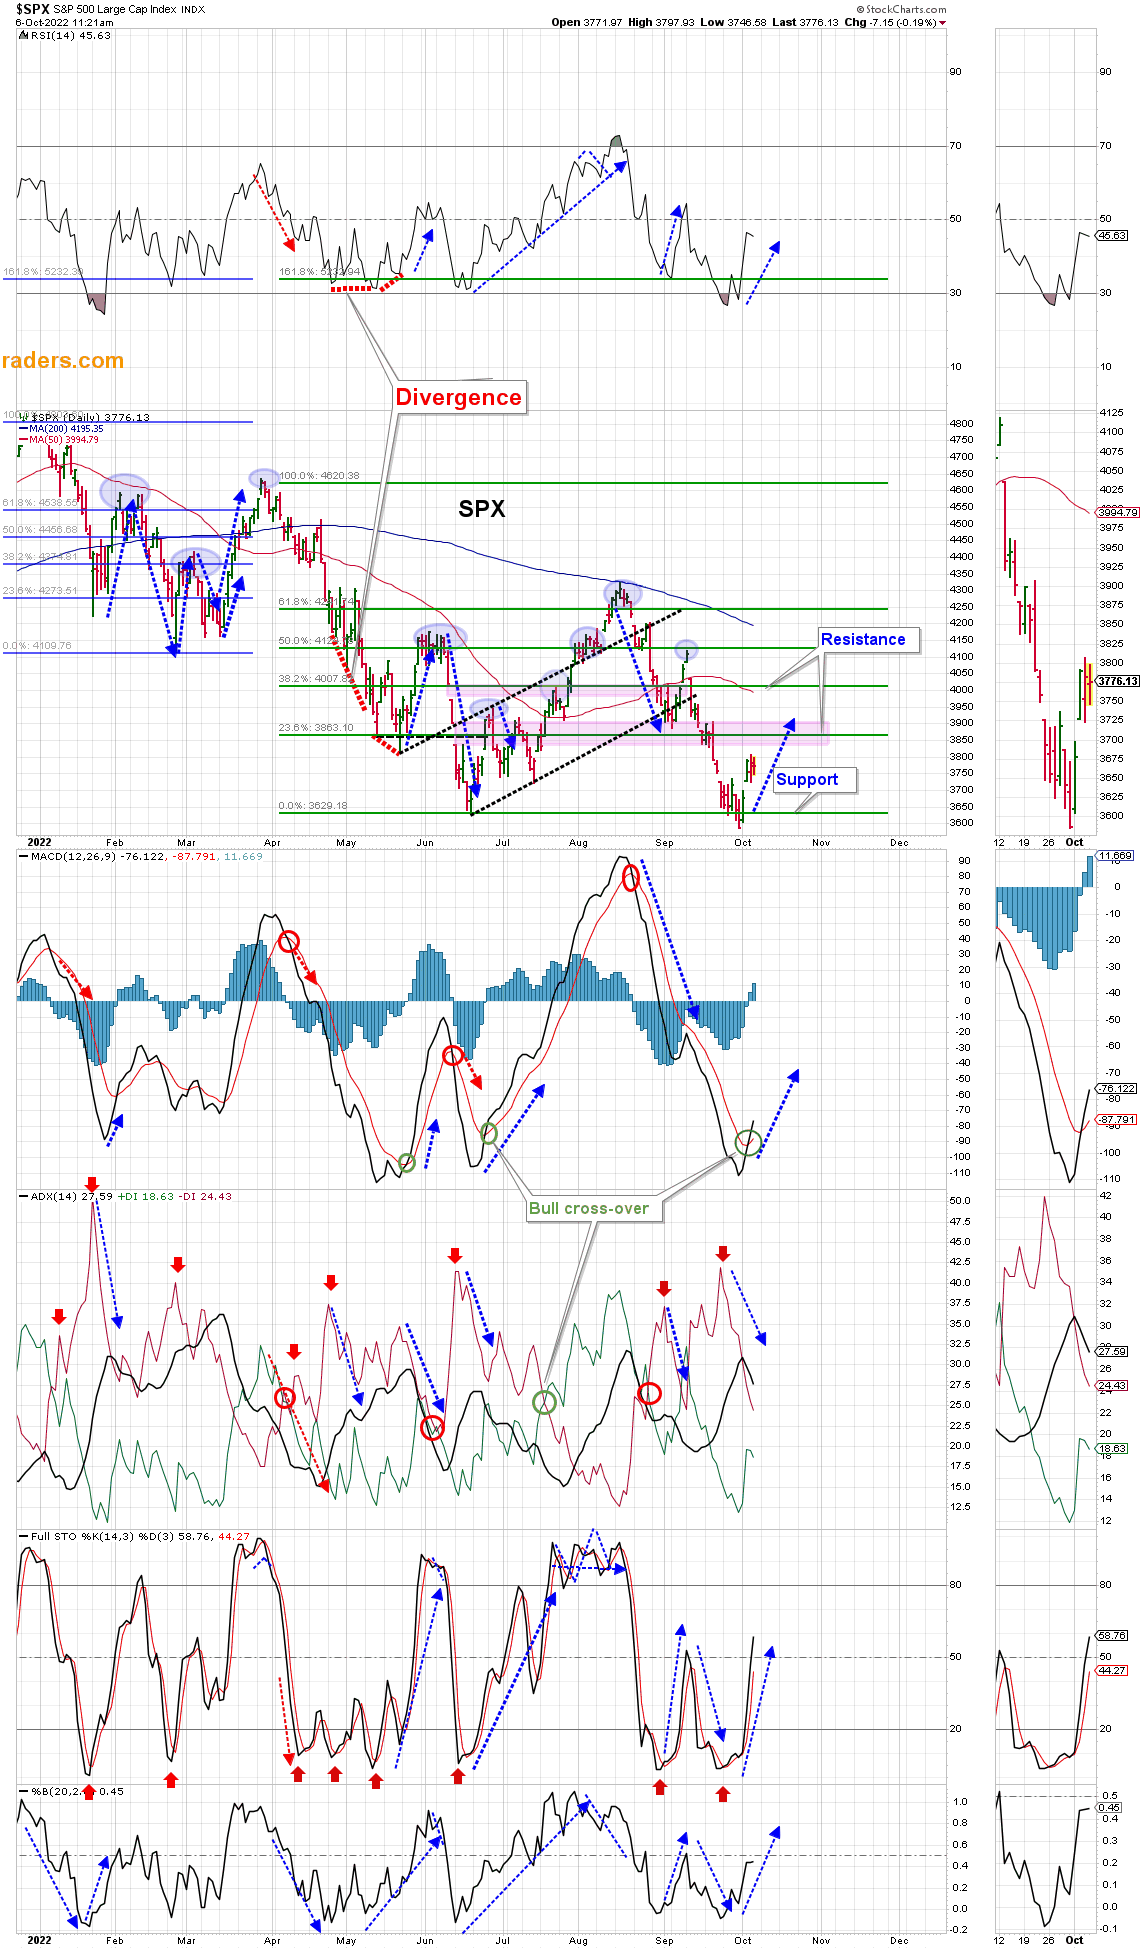
Contrary to what seems obvious — that the stock market is about to completely collapse — because everyone is thinking the same way, we see reasons to go long in Q4. The easiest way to do this is through the following index ETFs: QQQ, SPY, IWM.
“Editor’s Note: This article was submitted as part of Seeking Alpha’s best contrarian investment competition which runs through October 10. With cash prizes and a chance to chat with the CEO, this competition – open to all contributors – is not one you want to miss. Click here to find out more and submit your article today!”
Be the first to comment