

RoJDesign/iStock via Getty Images
This dividend ETF article series aims at evaluating products regarding the relative past performance of their strategies and quality metrics of their current portfolios. Holdings and their weights change over time: reviews are updated when necessary.
DON strategy and portfolio
The WisdomTree MidCap Dividend Fund (NYSEARCA:DON) has 351 holdings, a 12-month distribution yield of 2.71% and an expense ratio of 0.38%. Distributions are monthly. It has been tracking the WisdomTree U.S. MidCap Dividend Index since 06/16/2006.
As described in the prospectus by WisdomTree, the underlying index selects companies in the top 75% of the market capitalization of the WisdomTree U.S. Dividend Index after the 300 largest companies have been removed. They are rebalanced annually based on paid dividends (not yields).
The fund invests exclusively in U.S. companies, about 70% mid-caps and 30% small-caps per Fidelity. Financials are the heaviest sector with 24% of asset value. Industrials and consumer discretionary follow with 14.7% and 11.3%, respectively. Other sectors are below 10%. Compared to the SPDR S&P MidCap 400 ETF (MDY), DON significantly overweights financials, utilities and energy. It underweights mostly technology, industrials and healthcare. Sector composition may change over time.
Sector breakdown (chart: author, data: Fidelity)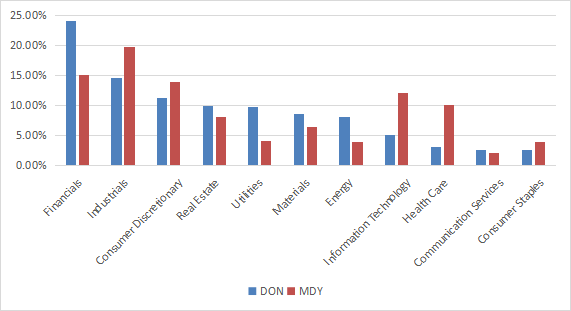
The portfolio is well-diversified: less than 9% is in the top 10 holdings, listed below with fundamental ratios. The heaviest holding weighs 1.31%, so risks related to individual companies is very low.
|
Ticker |
Name |
Weight% |
EPS growth %ttm |
P/E ttm |
P/E fwd |
Yield % |
|
Chesapeake Energy Corp. |
1.31% |
170.92 |
4.67 |
5.65 |
2.33 |
|
|
Packaging Corporation of America |
0.98% |
40.09 |
11.64 |
11.61 |
3.91 |
|
|
International Paper Co. |
0.93% |
15.43 |
6.58 |
9.38 |
5.34 |
|
|
Evergy, Inc. |
0.91% |
-9.39 |
18.16 |
17.61 |
3.89 |
|
|
Viatris, Inc. |
0.89% |
134.66 |
16.87 |
3.29 |
4.31 |
|
|
Franklin Resources, Inc. |
0.86% |
-29.29 |
10.43 |
10.67 |
4.55 |
|
|
Paramount Global |
0.81% |
-8.44 |
3.60 |
8.51 |
5.69 |
|
|
OGE Energy Corp. |
0.77% |
97.32 |
8.49 |
18.95 |
4.19 |
|
|
Fidelity National Financial, Inc. |
0.75% |
-38.77 |
6.61 |
6.98 |
4.78 |
|
|
Snap-on, Inc. |
0.74% |
12.71 |
13.84 |
13.77 |
2.84 |
Ratios from Portfolio123
Past performance
Since inception in June 2006, DON has been very close to MDY in return and risk metrics (see next table). Both funds have the same risk-adjusted performance measured by Sharpe ratio. They underperform the S&P 500 (SPY) by a short margin.
|
Total Return |
Annual.Return |
Drawdown |
Sharpe ratio |
Volatility |
|
|
DON |
296.39% |
8.69% |
-62.08% |
0.48 |
18.87% |
|
MDY |
306.30% |
8.85% |
-55.37% |
0.48 |
19.09% |
|
SPY |
324.76% |
9.14% |
-55.42% |
0.56 |
15.80% |
However, DON has outperformed MDY by about 8 percentage points in 2022:
DON vs. MDY in 2022 (Portfolio123)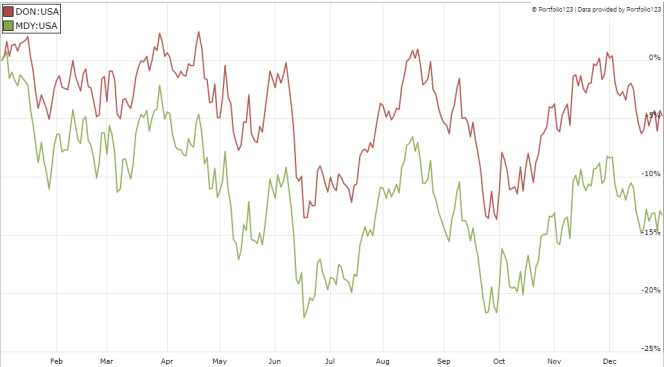
In previous articles, I have shown how three factors may help cut the risk in a dividend portfolio: Return on Assets, Piotroski F-score, and Altman Z-score.
The next table compares DON with a subset of the S&P 500: stocks with an above-average dividend yield, an above-average ROA, a good Altman Z-score, a good Piotroski F-score and a sustainable payout ratio. The subset is rebalanced annually to make it comparable with a passive index.
|
Total Return |
Annual.Return |
Drawdown |
Sharpe ratio |
Volatility |
|
|
DON |
296.39% |
8.69% |
-62.08% |
0.48 |
18.87% |
|
Large cap reference subset |
477.07% |
11.19% |
-41.97% |
0.69 |
15.45% |
Past performance is not a guarantee of future returns. Data Source: Portfolio123
DON underperforms the dividend quality subset by 2.5 percentage points in annualized return. However, the ETF performance is real and this subset is hypothetical. My core portfolio holds 14 stocks selected in this subset (more info at the end of this post).
The next chart plots the annual sum of distributions in the last 16 years, from 2007 to 2022. Distributions have been quarterly until 2012. The annualized dividend growth rate since 2007 is 4.8%.
Annualized distributions per share from 2007 to 2022 (Chart: author; data: WisdomTree)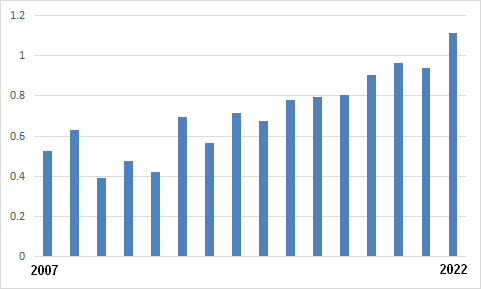
Scanning DON portfolio
DON is a bit cheaper than MDY regarding the usual valuation ratios:
|
DON |
MDY |
|
|
Price/Earnings TTM |
12.11 |
13.5 |
|
Price/Book |
2.21 |
2.31 |
|
Price/Sales |
1.12 |
1.25 |
|
Price/Cash Flow |
9.58 |
11 |
I have scanned holdings with the quality metrics described in the previous paragraph. I consider that risky stocks are companies with at least 2 red flags among: bad Piotroski score, negative ROA, unsustainable payout ratio, bad or dubious Altman Z-score, excluding financials and real estate where these metrics are less relevant. With these assumptions, 26 stocks out of 351 are risky and they weigh about 8% of asset value, which is acceptable.
Based on my calculation, DON is superior to the mid-cap benchmark regarding the aggregate return on assets. The Piotroski F-score is similar. These metrics point to a portfolio quality slightly superior to the mid-cap benchmark.
|
DON |
MDY |
|
|
Atman Z-score |
2.48 |
2.97 |
|
Piotroski F-score |
5.37 |
5.38 |
|
ROA % TTM |
7.32 |
5.82 |
Takeaway
DON holds 351 dividend stocks, mostly in the mid-cap segment, weighted based on paid dividends. It pays monthly distributions, but the annual rate of 2.7% is unattractive for income-seeking investors. The portfolio is heavy in financials: this sector represents 24% of asset value. DON looks slightly more attractive than the mid-cap benchmark S&P 400 regarding valuation and quality metrics. It is close behind it in total return since inception, but has outperformed in 2022. The annualized dividend growth rate since 2007 is 4.8%. As a conclusion, this fund is not a bad product, but it has no convincing argument either. For transparency, a dividend-oriented part of my equity investments is split between a passive ETF allocation (DON is not part of it) and my actively managed Stability portfolio (14 stocks), disclosed and updated in Quantitative Risk & Value.
Editor’s Note: This article discusses one or more securities that do not trade on a major U.S. exchange. Please be aware of the risks associated with these stocks.
Be the first to comment