

KanawatTH/iStock via Getty Images
Dear Fellow Shareholders:
We are pleased to provide you with the Third Avenue Real Estate Value Fund’s (the “Fund”) report for the period ended March 31, 2022. For the first quarter of the calendar year, the Fund generated a return of -7.40% (after fees) versus -3.79% (before fees) for the Fund’s most relevant benchmark, the FTSE EPRA NAREIT Developed Index.1
The most notable contributor to performance during the quarter was the Fund’s investment in the common stock of Preferred Apartment Communities. The primary detractors to performance related to the Fund’s holdings involved with transactional- related businesses including homebuilding [Lennar Corp. (LEN) and Berkeley Group (OTCPK:BKGFY)] and real estate services [CBRE Group (CBRE) and Savills plc (OTCPK:SVLPF)] -each of which is remarkably well-capitalized and very strategically positioned for the next phase of their respective industries, in Fund Management’s view. Further details on these holdings, as well as the Fund’s activity relating to D.R. Horton (DHI) (the largest U.S.-based homebuilder by deliveries), are included herein.
Recognizing that security prices can fluctuate from quarter-to- quarter, and that true value-oriented investments can oftentimes take years to materialize, Fund Management maintains the view that the Fund’s long-term results are the most relevant gauge of performance. Since the Fund’s inception in 1998, it has generated an annualized return of +9.43% (after fees). As highlighted in the chart below, this performance indicates that an initial investment of $100,000 in the Fund would have a market value in excess of $830,000 (assuming distributions had been reinvested), or more than the same $100,000 would be worth had it been placed into a passive fund tracking the Fund’s most relevant benchmark (as well as the S&P 500).2
VALUE OF $100,000 SINCE SEPTEMBER 1998
As of March 31, 2022
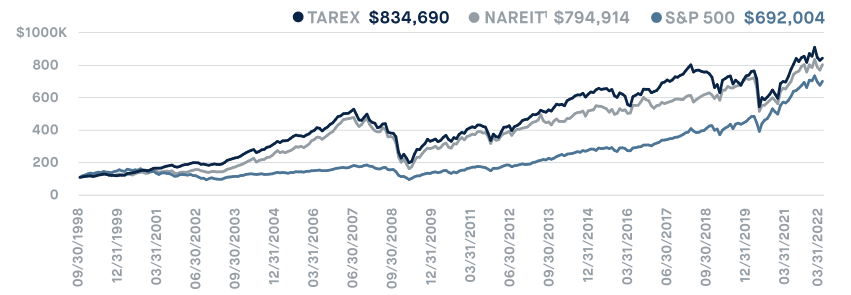
Hypothetical Investment since September 30, 1998 (Fund Inception Date September 17, 1998).
Past performance does not guarantee future performance results.
ACTIVITY
In Real Estate Returns: A Comparison with Other Investments, accomplished co-authors Roger Ibbotson and Laurence Siegel observe that “Real Estate provides diversification for the investor, while supplying a far better inflation hedge than that available from any other asset except Treasury bills.” In fact, in the period analyzed (1947-1982) the Real Estate composite3 under study generated an annualized return of +8.27% with a particularly strong period during the 1970’s (widely recognized as a decade with higher rates of inflation) when the composite generated an annualized return of +12.17%.
Market participants have undoubtedly taken notice. That is to say that as the money supply has increased in the U.S. by more than 40% in a two-year time period (as measured by “M-2” per the Board of Governors of the U.S. Federal Reserve System through February 2022) and the U.S. Consumer Price Index (CPI) has increased by +8.5% on a year-over-year basis, allocations to Real Estate have accelerated. As a result, private real estate vehicles received more than $60 billion of inflows during the fourth quarter of 2021 and entered the year with more than $300 billion of “buying power” in the U.S. alone per industry data (Green Street, SNL, Preqin, and Robert A. Stranger & Co.)
As noted in the Fund’s Q3 2021 shareholder letter, these substantial capital shifts are likely to have major ramifications for the Third Avenue Real Estate Value Fund. While not all encompassing, these primarily include the “pace of corporate actions involving the Fund’s holdings gathering momentum” as “buying portfolios from listed real estate players (or even public companies outright) will be the path of least resistance for the sponsors of these private vehicles to deploy such large pools of capital.”
Along these lines, funds affiliated with the Blackstone Group launched a takeover offer for one of the Fund’s holdings for the second time in the previous three quarters. In this case, the bid related to Preferred Apartment Communities, Inc. (APTS) – a US-based Real Estate Investment Trust (“REIT”) that predominantly owns a portfolio of modern and well-located multi-family properties in the Sunbelt region as well as grocery-anchored retail properties across the same geographic footprint. While the Fund’s investment was only established in 2021, Blackstone’s (BX) offer price represented a substantial premium to the Fund’s cost basis. The process undertaken by the Board to eliminate the disconnect between the company’s public and private market values also seemed robust. As a result, the Fund exited its investment in the common stock of Preferred Apartments prior to quarter-end and recycled the capital into two existing holdings that also seem to trade at material discounts to Net- Asset Value (“NAV”): AMERCO (UHAL) and Grainger plc (OTC:GRGTF).
Held in the Fund since 2018, AMERCO is widely recognized as the leader in self-moving in North America through its U-Haul subsidiary where it has an unrivaled network with approximately 176,000 trucks, 126,000 trailers, and 46,000 towing devices available across more than 23,000 locations. What is not as widely recognized, in Fund Management’s opinion, is that the company’s forward thinking management team has also spent the last decade assembling one of the largest self-storage portfolios in North America-not only solidifying the “moat” around its core business but also creating substantial value in the process.
Due to these efforts, AMERCO owned and managed more than 73 million square feet of self-storage facilities at the end of the 2021, placing it as the third largest owner of such properties in the US. Notwithstanding, the company does not seem to get much (if any) recognition for this transformation. To wit, if one were to apply the implied price per square foot for AMERCO’s closest comparable on the self-storage side of the business (e.g., Life Storage), they would arrive at an implied value for its impossible-to-replicate self-moving business of basically $0- despite it generating more than $1.0 billion of operating profits per year more recently, implying $7-8 billion of value based upon comparables within the rental segment.
This disconnect does not seem to be lost on Chairman and CEO Edward Shoen (who owns 42.7% of the company’s stock along with beneficiaries). In fact, in response to a question about the price-to-value discrepancy during the company’s most recent quarterly conference call, he remarked that “it’s a question that is regularly discussed at the board level” and that “hopefully we’ll have some news for you before the year is out.” In the meantime, AMERCO is not only continuing to self-finance the expansion of its self-storage portfolio with more than 7 million square feet of projects in development, but the company is also expanding its “U-Box” offering as it gains further market share in the portable storage and moving segment.
Held in the Fund since 2019, Grainger plc (“Grainger”) is a UK-based real estate operating company that is the leading owner, manager, and developer of multi-family properties in the supply-constrained markets of the UK (where the multi-family business is more commonly referred to as the private-rental sector or “PRS”). At the end of the 2021 calendar year, the company owned a portfolio of 7,100 PRS units that were 95.0% leased with two-thirds of the value in the greater London area and the remaining one-third in the other UK regions.
In addition to its stabilized portfolio of “market-rate” PRS properties, Grainger also owns a portfolio of approximately 2,500 “rent-controlled” units dating back to its roots as a more diversified residential company (Grainger was founded in 1912). Due to the regulated nature of these properties, only about 8-10% of the units can be disposed of each year. However, the proceeds from these sales, as well as the earnings the company retains as an operating company as opposed to a REIT, are being utilized to build out its strategic development pipeline with planning for almost 8,400 additional PRS units- including 3,000 very well-located units through its joint venture with the Transport for London (TFL).
Despite being well-capitalized with a loan-to-value ratio of approximately 30% alongside prospects to self-finance its development pipeline that is expected to increase its recurring cash flows by more than 90% through 2025, Grainger’s common stock continues to trade at a discount to its stated NAV (which is provided annually based upon third-party appraisals under International Financial Reporting Standards). This inefficiency may very well relate to Grainger’s status as an operating company, not a REIT, which leaves the company out of certain Real Estate indices and mandates. It is not inconceivable, though, that as the company further builds out its stabilized PRS portfolio it may ultimately elect REIT tax status, serving to boost its annual dividend and widening its potential investor base. Should such a modification not materialize, and the price- to-value gap remain, there would also likely be a great deal of strategic interest in the platform given Grainger’s scale in this emerging asset class within the UK.
Outside of these additions, the Fund also sold “out-of-the- money” put options on the common stock of D.R. Horton, Inc. (“DR Horton”)-the largest homebuilder in the U.S. that accounted for nearly 1 out 9 new homes sold in the U.S. last year. Having followed the company for years, Fund Management can say without hesitation that DR Horton is an incredibly efficient builder focused on delivering quality product at the entry-level price point (its average selling price was less than $325,000 last year) with leading positions in key Sunbelt markets including Dallas, Houston, Austin, Atlanta, and Phoenix.
While the near-term outlook for DR Horton is somewhat uncertain given mortgage rate and supply chain volatility, the medium-to-long-term prospects for volume-based homebuilders with super-strong balance sheets and scale advantages seem promising (such as DR Horton and Lennar Corp.) in Fund Management’s view. This is especially the case when considering that:
- residential inventories are at record- low levels in most major markets whether gauged by “month’s supply” or aggregate units available,
- demand for single- family residences is accelerating as the largest generation in U.S. history (the “millennial cohort”) enters its prime home buying years and desires more space not only due to “life events” but also “remote” and “hybrid” working arrangements, and
- significant inflation in rental rates for multi-family units in urban areas has left the rent-to-own proposition for single- family homes in suburban areas in a compelling range.
At the same time, Third Avenue’s due-diligence efforts indicate there are structural changes unfolding within the homebuilding industry on three fronts. One, homebuilders with significant share are utilizing their scale to secure land, labor, and materials on more favorable terms and with a greater degree of reliability. Two, the same group is also pivoting to “land light” strategies by obtaining lots through option arrangements as opposed to outright ownership-while offsetting the reduced margins associated with such an approach by eliminating external brokerage fees through a “direct-to-consumer” sales strategy given enhanced digital capabilities. And three, the single-family rental offering or “SFR” product has much wider consumer acceptance than recognized and the large pools of capital targeting this niche asset class offers builders a more diversified sales channel than in previous cycles. As a result, it seems that a select few volume-builders are likely to earn higher returns on invested capital (with less leverage) while also delivering homes at a steadier pace, which should ultimately result in an improved cost of capital for these issuers (i.e., a higher price to book multiple).4
Should the DR Horton options be exercised during the term, the Fund would have approximately 7.0% of its capital invested in US-based homebuilders when also factoring in its long- held position in Lennar Corp. B shares (which remain at more than 15% discount to Lennar’s A shares despite equal economics). Fund Management would also consider increasing this allocation further should the implied valuations become even more compelling, while remaining exclusively focused on well-capitalized participants poised to benefit from the aforementioned dynamics-as well as those with leading positions in the Sunbelt region where net migration trends (and demographics) form a vastly different fundamental backdrop than more frequently cited national statistics.
In addition to this activity, the Fund also:
- exited Essex Property Trust (ESS) and recycled the capital into InvenTrust Properties (IVT),
- reduced its holding in Lowe’s (LOW) and increased Catchmark Timber Trust (CTT), and
- extended out its hedge related to its Hong Kong dollar exposure.
POSITIONING
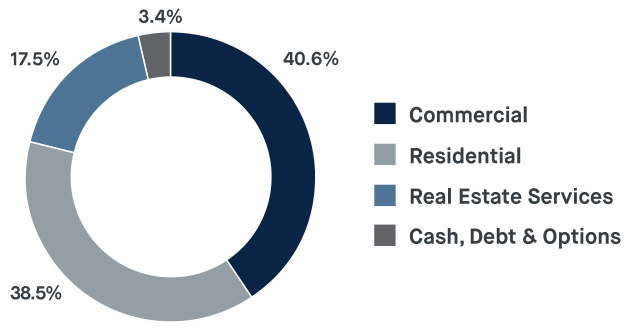
After incorporating this activity, the Fund had 41% of its capital invested in Commercial Real Estate enterprises that are primarily involved in long-term wealth creation. These holdings are largely capitalizing on secular trends within property, including structural changes that are driving more demand for industrial properties, self-storage facilities, and last-mile fulfillment [Prologis (PLD), Segro plc (OTCPK:SEGXF), First Industrial (FR), U-Haul (UHAL), InvenTrust, Big Yellow (OTC:BYLOF), and National Storage (NSA)] as well as the further densification and improvements taking place in select urban corridors [CK Asset Holdings (OTCPK:CHKGF), Derwent London (OTCPK:DWVYF), Wharf Holdings (OTCPK:WARFY), Henderson Land (OTCPK:HLDCY), and JBG Smith Properties (JBGS)]. In Fund Management’s view, each of these enterprises is very well-capitalized, their securities trade at discounts to private-market values (especially in light of the demand for income-producing “real assets”), and they seem capable of increasing NAV-primarily by increasing rents, undertaking development and redevelopment activities, as well as by making opportunistic acquisitions.
The Fund also had 38% of its capital invested in Residential Real Estate companies that have strong ties to the U.S. and U.K. residential markets, where there are serious supply deficits after years of under-building. In conjunction with record-low inventory levels and vacancy rates, there is also very substantial demand for new product at an affordable price point (both for-sale and for-rent) as previously outlined. Therefore, these holdings seem poised to benefit from a further recovery in residential construction and ancillary activities. At the end of the quarter, these positions included a diversified set of businesses including homebuilding (Lennar Group and Berkeley Group), timberland ownership and management (Weyerhaeuser (WY), Rayonier (RYN), and Catchmark), land development [Five Point Holdings (FPH) and Stratus Properties (STRS)], the ownership and development of rental properties (American Homes 4 Rent (AMH) and Grainger plc), as well as other ancillary businesses [Lowe’s and Trinity Place Holdings (TPHS)].
An additional 18% of the Fund’s capital is invested in Real Estate Services. These businesses are generally less capital- intensive than direct property ownership and as a result have historically offered much higher returns on capital over the course of a cycle-provided the business has a favorable competitive positioning within the real estate value chain. At the present time, these holdings primarily include franchises involved with asset management [Brookfield Asset Management (BAM) and Patrizia Immobilien (OTC:PTZIF)], brokerage and property management [CBRE Group and Savills plc (OTCPK:SVLPF)], as well as mortgage and title insurance [FNF Group, Fannie Mae (OTCQB:FNMA), and Freddie Mac (OTCQB:FMCC)].
The remaining 3% of the Fund’s capital is in Cash & Equivalents. The Fund also has certain hedges in place, primarily relating to foreign currency exposures (Hong Kong Dollar) as well as options outstanding relating to DR Horton.
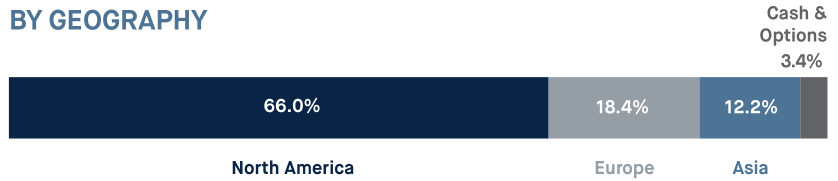
The Fund’s allocations across these various business types are outlined in the chart below. In addition, Fund Management reports the Fund’s exposure by geography (North America, Europe, and Asia-Pacific) and strategy (Core/Core-Plus, Value-Added, Opportunistic, and Debt) for comparison with institutional reporting standards for direct real estate allocations.
ASSET ALLOCATION AS OF MARCH 31, 2022
(allocations subject to change)
BY BUSINESS TYPE
BY GEOGRAPHY
BY STRATEGY

FUND COMMENTARY
The investment community lost a true titan of the industry when famed value investor Michael Price passed away in March 2022. Fund Management had the good fortune of getting to interact with Michael over the years and was always inspired by his modest disposition (despite incredible success) as well his uncanny ability to cut through the noise and get to the matter at hand-a testament to his quick wit and vast knowledge. It will be hard to forget someone who was so influential in shaping the modern-day practice of value investing.
In the ethos of conducting deep-dive research to make sense of complex issues, the Third Avenue Real Estate team was active this quarter attending global real estate conferences, participating in property tours, conducting site visits, traveling to corporate headquarters, and reviewing annual reports. Throughout these efforts it was clear that there were four prominent “macro” themes on the top of mind for most industry participants, with some less conspicuous “micro” implications for key Fund holdings, including:
- Russia-Ukraine Conflict: While the Fund has less than 1.5% of assets invested in companies listed in continental Europe, the implications of Russia’s assault on Ukraine is undoubtedly vast with ramifications globally-including in the UK, where the Fund has approximately 17.5% of capital invested. With an exclusive focus on super well-capitalized issuers in the region, it is Fund Management’s view that these enterprises can navigate through market volatility and absorb (or even pass through) the significant increase in energy prices that have transpired in the region. Although not as widely documented as oil and gas prices, Russia is also an important source of logs (and fiber) utilized in wood (and cellulose) products globally accounting for more than 20% of supply to certain regions. As a result of more recent trade restrictions, as well as previous curtailments, producers that have historically sourced timber from Russia (e.g., Europe, China, India, et al) are increasingly looking to other key wood baskets which is abruptly changing the supply and demand backdrop in those markets-such as those in the US South and New Zealand where the Fund has meaningful exposure with approximately 11.9% of its capital invested in some of the leading owners in these regions including Rayonier, Weyerhaeuser, and Catchmark.
- Supply Chain Disruptions: After nearly 40 years of supply chains being transformed to capitalize on lower production costs in Asia alongside a shift to “just-in-time” inventory management practices, more recent events have seemingly turned the focus on supply chains from “efficiency” to “resiliency”. While still at early stages, efforts are being made by most multi-nationals to rebuild inventories to more sustainable levels following the pandemic while also expanding production capabilities in lower-cost areas within key trading blocks. Consequently, industrial real estate owners (that have already enjoyed a near decade-long fundamental tailwind stemming from e-commerce related demand) are now experiencing record amounts of leasing activity (and rental rate growth) as inventories are restocked to more reliable levels around key consumption hubs-such as those in the US, UK, and Western Europe, including the Fund’s holdings Prologis, Segro, and First Industrial which collectively account for 14.4% of the Fund’s capital.
- Inflationary Pressures: At the present time, cost increases for labor, materials, energy, and everyday items are accelerating at a pace not witnessed since the early 1980’s. Notwithstanding certain deflationary forces on the horizon (e.g., high debt to GDP ratios, declining velocity rates, quantitative tightening, proposed tax changes, et al), the Third Avenue Real Estate Value Fund remains focused on owning the securities of companies with “pricing power” in an effort to be positioned as a real estate alternative that can guard against the prospects of inflation over time. As outlined in greater detail in the Fund’s Q1 2021 Shareholder Letter, this primarily includes allocations to (i) commercial real estate owners with shorter-term leases and more favorable supply and demand dynamics, (ii) residential real estate businesses tied to higher levels of production as opposed to further increases in average selling prices, as well as (iii) leading real estate (and real asset) investment management companies that exhibit significant operating leverage with revenues tied to inflation-linked properties and expanding allocations to real asset mandates. Even though this final segment was not included in the previously referenced Ibbotson and Siegel Real Estate composite, its appeal amid an inflationary environment has led to a number of recent transactions for leading alternative asset management platforms. In fact, recent deals in the space have taken place at multiples in excess of 25 times operating profits (e.g., KKR’s (KKR) purchase of a Japanese-REIT manger, EQT’s (EQT) acquisition of Baring Private Equity Asia, etc.), implying a significant discount for many publicly-listed enterprises with similarly strong investment management franchises-including Fund holdings Brookfield Asset Management, Patrizia Immobilien, CBRE Group, and Savills, which collectively account for 11.8% of the Fund’s assets.
- Interest Rate Volatility: During the period, there was a well- documented increase in interest rates with the yield for 10- Year US Treasuries increasing from 1.51% at the beginning of the year to 2.65% through early April-representing the swiftest increase in percentage terms since 1994. While the vast majority of the Fund’s investments performed according to expectations during this sudden shift, those with strong ties to the transaction markets (e.g., homebuilders and real estate services companies) diverged during the period. Insofar as Fund Management can tell this is largely due to mortgage rates (and credit spreads) increasing at a more rapid clip than government bond yields. For instance, the fixed-rate for a 30-year “conforming” residential mortgage in the US currently exceeds the yield on 10-Year Treasuries by more than 2.0%-a level that has only been exceeded in two other brief periods in the past 40 years (i.e., the “financial crisis” and the “Covid-19 Pandemic”). With that perspective, it is Fund Management’s view that this spread will narrow in the ensuing quarters alleviating some uncertainty around transaction activity. At the same time, it is a development that could place a greater emphasis on maintaining “safety and soundness” within the US residential markets by recapitalizing the Federal National Mortgage Association (“Fannie Mae”) and the Federal Home Loan Mortgage Corporation (“Freddie Mac”) so that these “mission-critical” entities can continue to foster liquidity within the mortgage market while promoting housing affordability. In fact, the recently nominated director of the Federal Housing Finance Agency (FHFA), which acts as the regulator for Fannie Mae and Freddie Mac, remarked that she would like to see them “continue to retain earnings and build capital and be in a strong position” while also noting that the FHFA is “working with the Enterprises to take those steps so that they can exit from conservatorship in a responsible manner”-a narrative that adds further context to the one outlined in the FHFA Strategic Plan: Fiscal Years 2022-2026 and a process that could surface considerable value for stakeholders, including the Fund with its investment in the Preferred Equity of these privately-owned and utility-like entities.
We thank you for your continued support and look forward to writing to you again next quarter, which will likely include updates on spin-offs from FNF Group and Lennar Corp. anticipated later this year. In the meantime, please don’t hesitate to contact us with any questions, comments, or ideas at realestate@thirdave.com.
Sincerely,
The Third Avenue Real Estate Value Team
Jason Wolf, CFA Ryan Dobratz, CFA
Footnotes
- The FTSE EPRA/NAREIT Developed Real Estate Index was developed by the European Public Real Estate Associa on (EPRA), a common interest group aiming to promote, develop and represent the European public real estate sector, and the North American Association of Real Estate Investment Trusts (NAREIT), the representative voice of the US REIT industry. The index series is designed to reflect the stock performance of companies engaged in specific aspects of the North American, European and Asian Real Estate markets. The Index is capitalization-weighted. Please see Appendix for performance table and information.
- S&P 500 Index – The S&P 500 Index, or Standard & Poor’s 500 Index, is a market-capitalization-weighted index of 500 leading publicly traded companies in the U.S.
- Ibbotson and Siegel weighted the annual real estate component returns by the components’ previous year-end aggregate values to arrive at the annual real estate composite returns. The aggregate values were obtained from the following sources: I) for residential real estate, they used the series for current dollar net stock of owner-occupied residential structures from Musgrave, and multiplied each value by 1.2 to account for the value of the land beneath the structures (based on a consensus of several urban land value studies); 2) for farm real estate, they obtained the market value of farms, including farm houses, from “Income and Balance Sheet Statistics” ; and 3) for business real estate, they used the series for current dollar net stocks of noncorporate nonresidential structures from Musgrave.
- Price-to-Book Ratio: Price-to-book ratio (P/B ratio) measures the market’s valuation of a company relative to its book value. Source: Investopedia.
|
FUND PERFORMANCE |
|||||||
|
As of March 31, 2022 |
3 mo |
1 yr |
3 yr |
5 yr |
10 yr |
Inception |
Inception Date |
|
Third Ave Real Estate Value Fund (Inst. Class) |
-7.40% |
9.20% |
5.08% |
3.99% |
7.37% |
9.43% |
9/17/1998 |
|
Third Ave Real Estate Value Fund (Inv. Class) |
-7.46% |
8.89% |
4.80% |
3.72% |
7.10% |
7.44% |
12/31/2009 |
|
Third Ave Real Estate Value Fund (Z Class) |
-7.38% |
9.28% |
5.16% |
N/A |
N/A |
2.80% |
3/1/2018 |
TOP TEN HOLDINGS
Allocations are subject to change without notice
TAREX
|
Prologis, Inc. |
6.9% |
|
Brookfield Asset Management, Inc. |
6.8% |
|
Five Point Holdings, LLC, Class A |
6.0% |
|
Rayonier, Inc. |
5.6% |
|
Lennar Corp. |
5.3% |
|
Weyerhaeuser Co. |
5.2% |
|
Segro PLC |
5.0% |
|
AMERCO |
4.6% |
|
CK Asset Holdings, Ltd. |
4.5% |
|
Wharf Holdings, Ltd. |
3.7% |
|
Total |
53.6% |
Editor’s Note: The summary bullets for this article were chosen by Seeking Alpha editors.
Be the first to comment