

matejmo
As of Friday, December 16, the S&P 500 Index is down -19.7% from the most speculative level of valuations in U.S. history – exceeding even the 1929 and 2000 extremes, based on the valuation measures we find best-correlated with actual subsequent market returns in cycles across history. The apparent shallowness of this loss isn’t a sign of “resilience.” Despite being nearly a year into what we expect to be a far deeper retreat, the relatively shallow loss isn’t even surprising. The same thing happened in the first year of each of the three deepest post-war stock market collapses: the 2000-2002, 2007-2009, and 1973-74.
Specifically, from the March 24, 2000, bubble peak through March 9, 2001 (just under a year into that bear market, as today), the S&P 500 index lost only -19.3%. Similarly, from October 7, 2007, through September 19, 2008, in what was soon to be known as the global financial crisis, the S&P 500 lost just -19.8%. From January 11, 1973, market peak to January 2, 1974, the S&P 500 lost just -18.8%, amid a bear market that would ultimately take the stock market down by half.
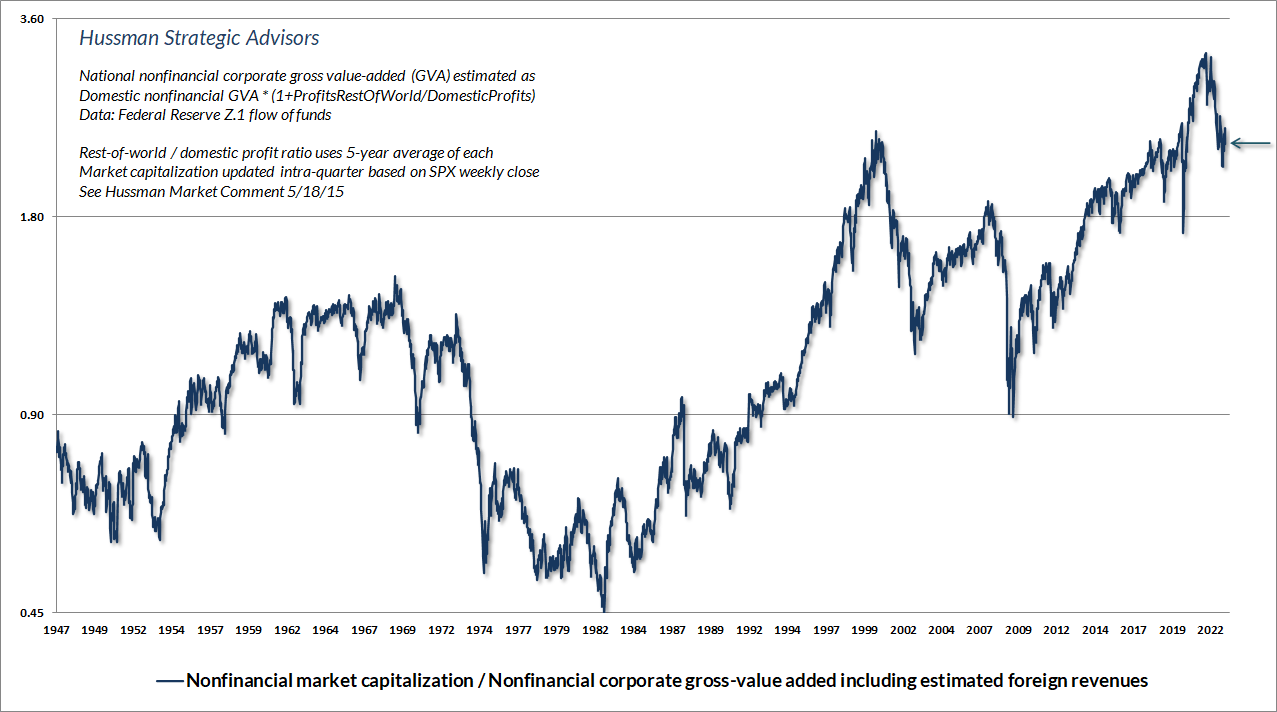
The chart below presents the ratio of nonfinancial market capitalization to gross value-added. MarketCap/GVA is our most reliable valuation gauge in market cycles across history, including recent decades. Notice how little impact the 2022 market decline to-date has had on valuations. Though recent market losses have removed the most extreme speculative froth, our most reliable valuation measures remain near their 1929 and 2000 extremes.
Our Margin-Adjusted P/E (MAPE) presents a similar and longer-term view.
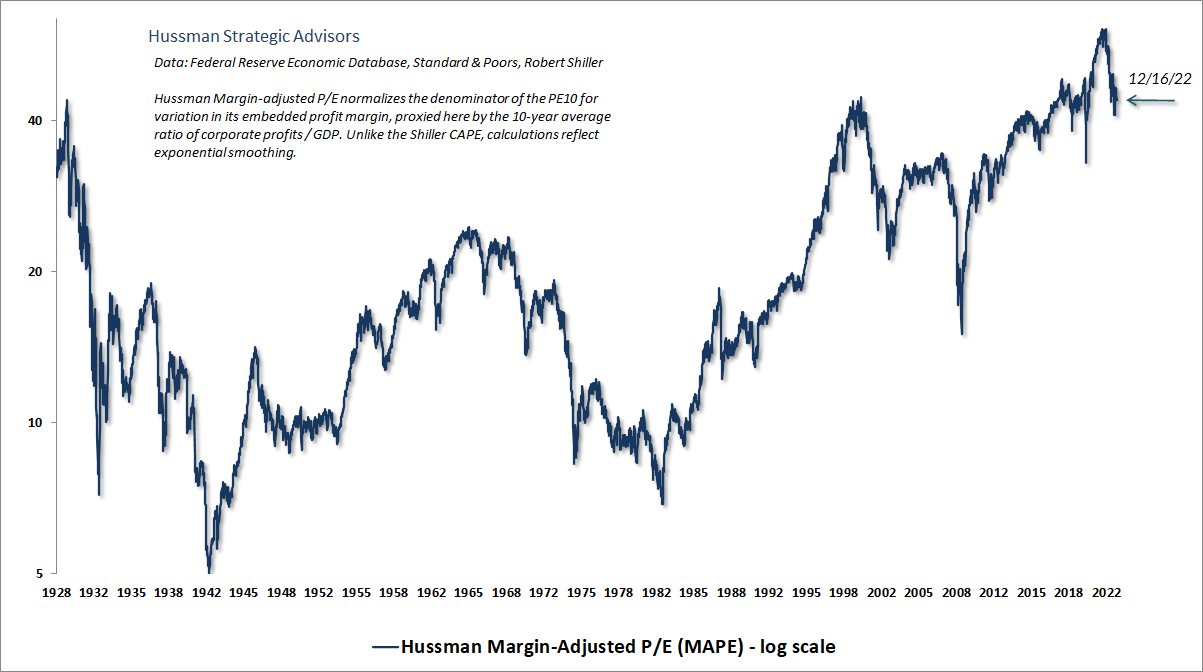
The spike to historically unprecedented levels at the beginning of 2022 was encouraged by Federal Reserve actions that forced the public to choke down 36% of GDP in zero-interest base money. The Fed is now paying banks 4.4% interest on this base money, which greatly reduces its speculative effect, but it must still be held by someone in the economy – mainly indirectly as personal and corporate bank balances – until it is retired by the Fed. If one bank decides to lend the money, a customer deposit is now backed by that loan instead of base money. The base money goes to the borrower’s bank and now backs that borrower’s new deposit. If the borrower puts the base money “into” stocks, the seller of those stocks takes the base money right back “out.” Somebody has to hold the stuff until the Fed retires it, and for most of the past decade, it was earning nothing. That, coupled with the direct, indirect, and likely temporary impact on profits of massive pandemic deficits, encouraged the most profoundly reckless yield-seeking speculative bubble in U.S. history.
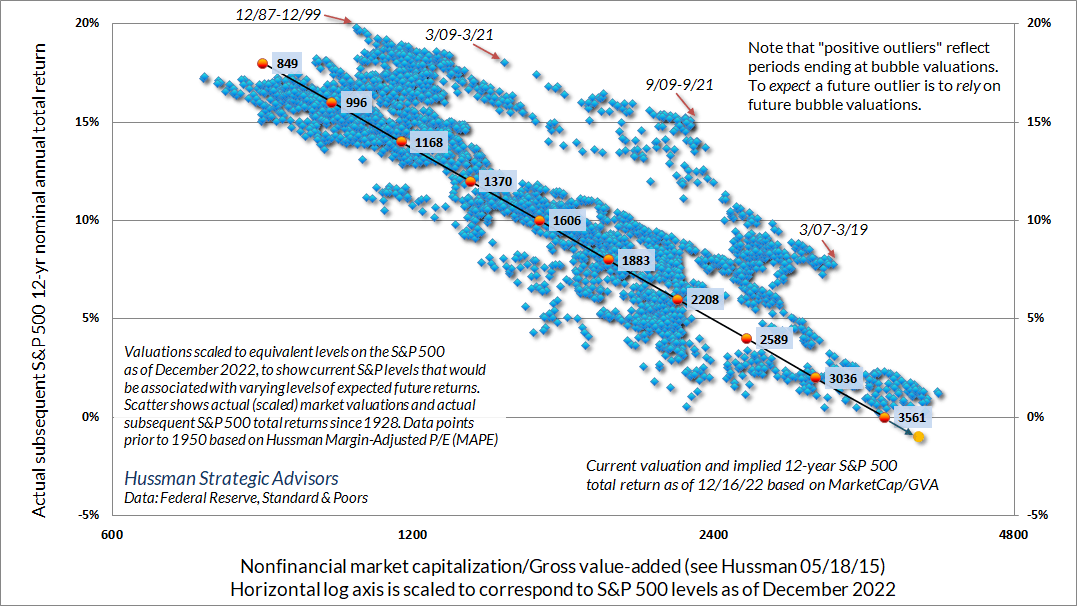
The chart below shows the relationship between MarketCap/GVA and actual subsequent 12-year S&P 500 nominal total returns. The horizontal axis is scaled to show levels of the S&P 500 that would presently be associated with various levels of expected market returns, as of December 2022. The yellow dot shows the present level of valuations, from which we estimate the S&P 500 is likely to produce negative total returns over the coming 10-12 years. By contrast, a historically “normal” 10% total return would presently be associated with a level of about 1600 on the S&P 500.
I’ve annotated some of the most extreme “positive outliers” with small red arrows. When actual returns substantially exceed those that would have been expected based on initial valuations, it’s invariably because the end of the period occurred during a speculative bubble. To expect a large positive outlier over the coming years is to rely on bubble valuations to prevail at the end of the holding period.
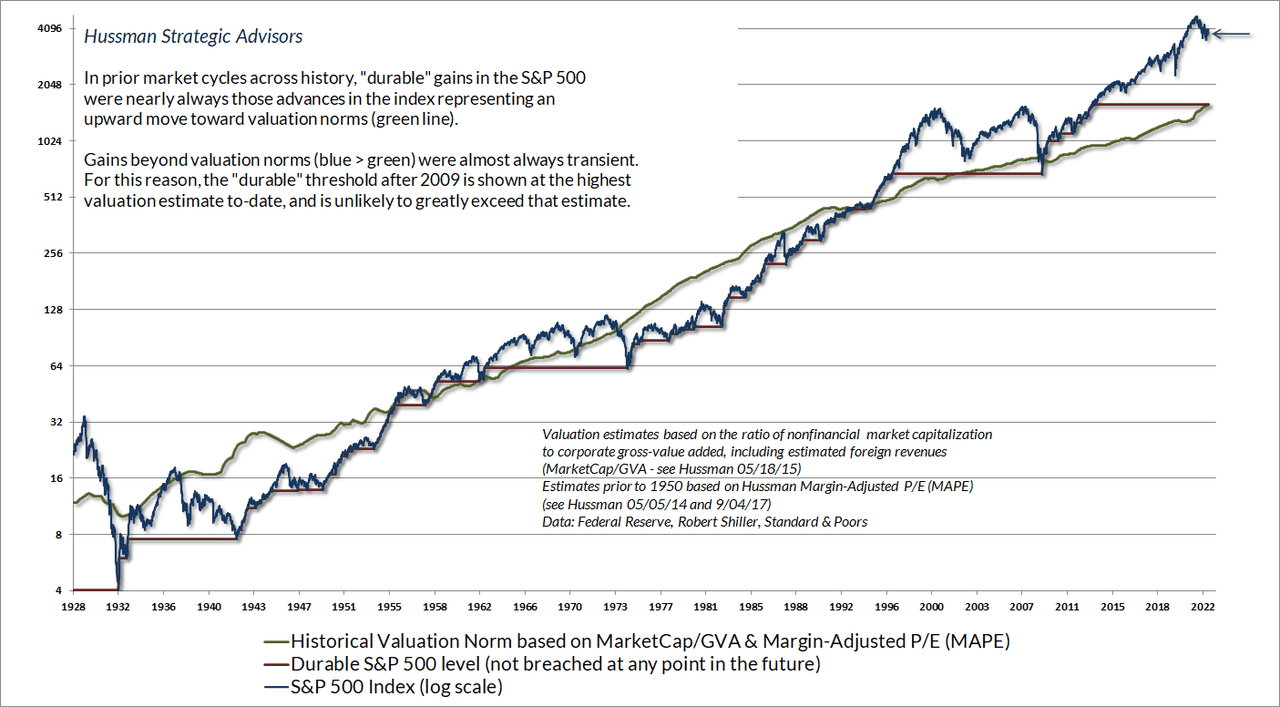
The chart below provides yet another illustration of where the market stands from a valuation perspective. Notice that in prior market cycles across history, “durable” gains in the S&P 500 were nearly always those advances in the index representing an upward move toward valuation norms (green line). Gains beyond valuation norms (blue > green) were almost always transient. For this reason, the “durable” threshold (red line) is shown at the highest valuation estimate to-date. Again, a historically run-of-the-mill 10% expected return would be associated with a level of roughly 1600 by our estimates. That doesn’t mean that the market must retreat to that level. It certainly doesn’t mean that we would require such a retreat in order to adopt a constructive market outlook. It only means that current market extremes are unlikely to prove durable, and that investors should allow for a very long, interesting trip to nowhere for the S&P 500 in the years ahead.
It’s essential for investors to understand what valuations mean, and how they should be used, lest they ignore them at the worst possible points in the market cycle. Overvaluation tells you that the prospects for long-term returns are below their historical norms. That effect is proportional – the greater the valuation extreme, the poorer long-term returns are likely to be. Valuations also tell you a great deal about the potential extent of market losses over a given market cycle.
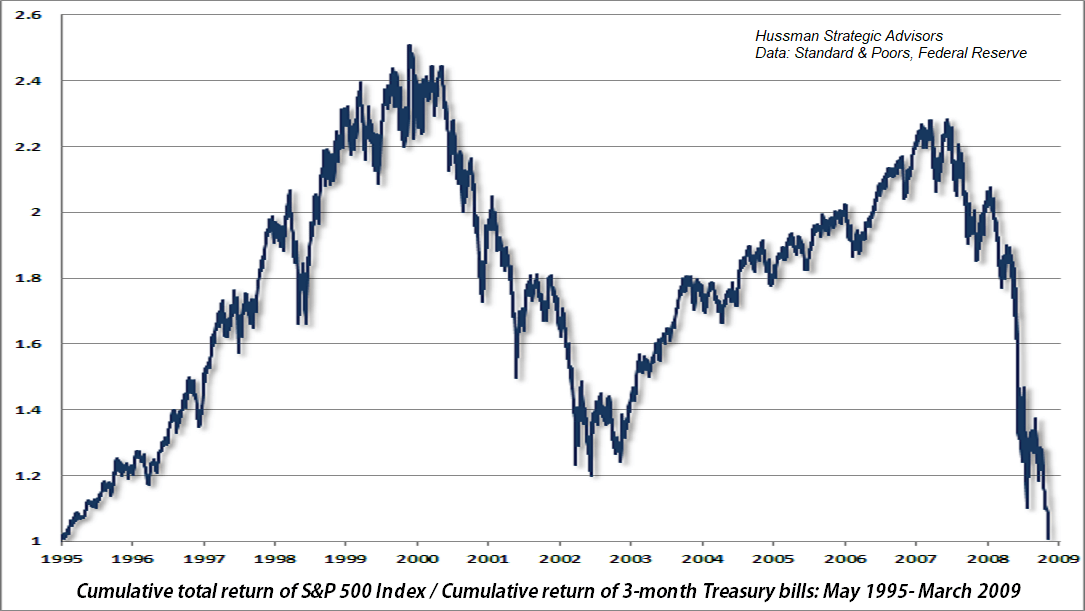
At the same time, overvaluation alone emphatically does not imply that the market will decline immediately, or even in the next few years. Think about it. The only way that the market could reach hyper valued extreme like 1929, 2000 and early-2022 was for prices to relentlessly advance beyond every lesser level of overvaluation. The tendency of investors to respond to extended bubbles by concluding that reliable valuation measures no longer “work” has always left them vulnerable to subsequent collapses that wipe out years of prior returns. Recall that the total return of the S&P 500 did no better than Treasury bills for the full period from May 1995 to March 2009, despite two intervening bubbles.
As Graham & Dodd lamented about the 1929 bubble peak, the reason investors abandoned their attention to valuations was “first, that the records of the past were proving an undependable guide to investment; and second, that the rewards offered by the future had become irresistibly alluring.”
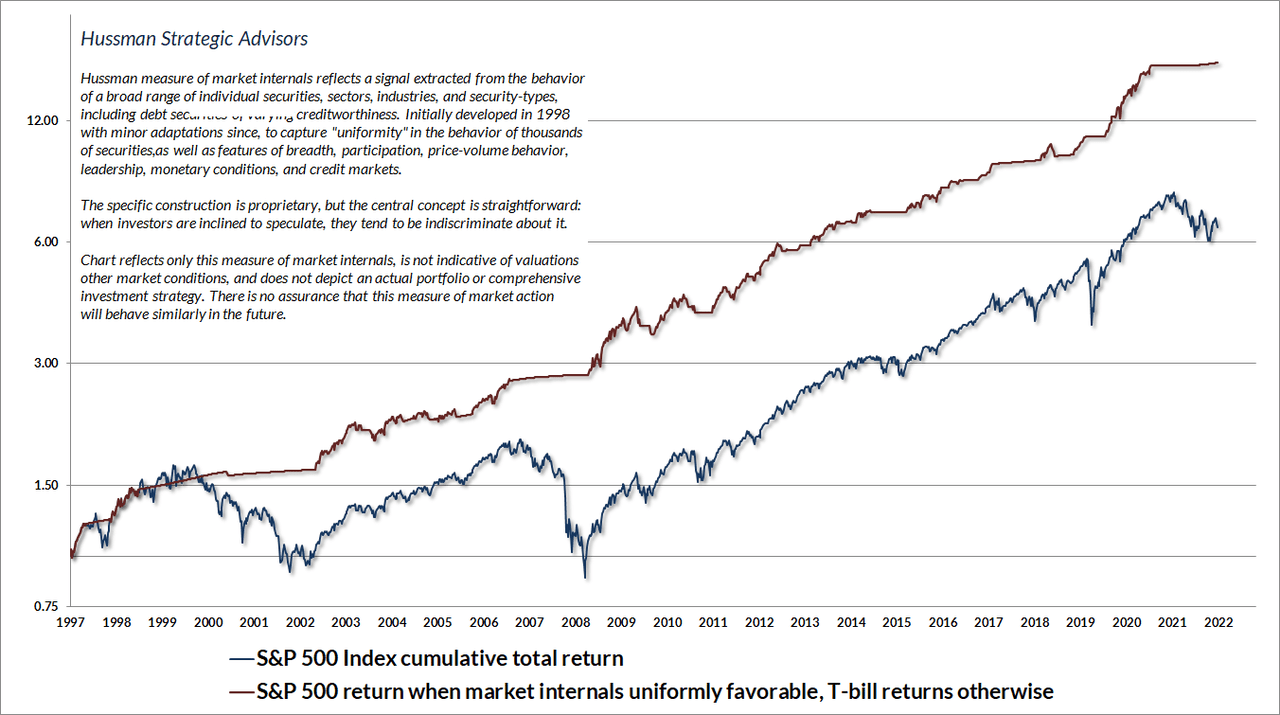
All of this is why it’s important to consider the “pressure” on valuations at any given time – specifically, the extent that investor psychology is inclined toward speculation or risk-aversion. Because investors tend to become indiscriminate during periods of speculation, we find that the best measure of speculative investor psychology is the uniformity of market internals across thousands of individual stocks, industries, sectors, and security-types, including debt securities of varying creditworthiness. We introduced our primary measure of market internals in 1998, with only minor adaptations since. The chart below presents the cumulative total return of the S&P 500 in periods where our measures of market internals have been favorable, accruing Treasury bill interest otherwise. The chart is historical, does not represent any investment portfolio, does not reflect valuations or other features of our investment approach, and is not an assurance of future outcomes.
If our measures of market internals were to improve, and particularly if interest rates were to move back to zero, the combined speculative pressure would likely defer the downside risk of extreme valuations – at least temporarily. Presently, based on our most reliable measures, we observe still-extreme valuations along with ragged, unfavorable market internals. That combination remains a “trap door” situation for the market. Meanwhile, interest rates are nowhere near the levels that contributed to the breathtaking level of speculation that we saw at the beginning of the year. That leaves a steeply overvalued market supported by neither speculative pressures nor interest rates.
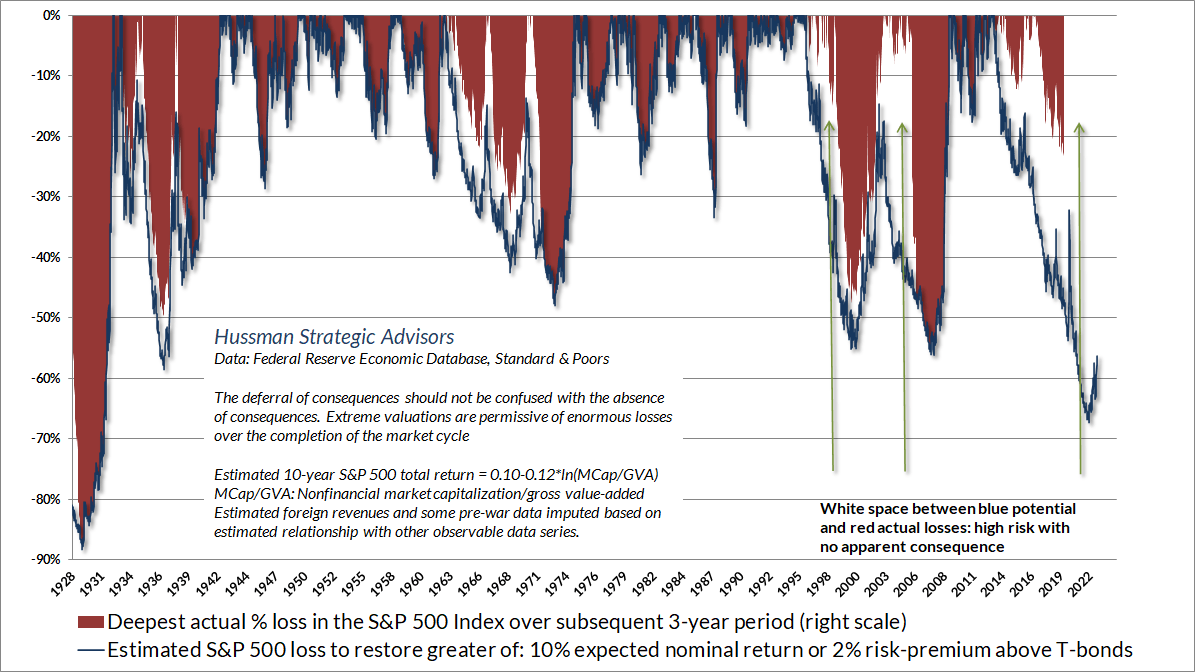
The chart below, from Estimating Downside Risk, is a reminder that the level of valuation at a speculative extreme is a strong guide – though absolutely not an immediate guide – to potential market losses over the completion of the market cycle.
A historically run-of-the-mill 10% expected return would be associated with a level of roughly 1600 on the S&P 500 by our estimates. That doesn’t mean that the market must retreat to that level. It certainly doesn’t mean that we would require such a retreat in order to adopt a constructive market outlook. It only means that current market extremes are unlikely to prove durable, and that investors should allow for a very long, interesting trip to nowhere for the S&P 500 in the years ahead.
For our part, our most reliable valuation measures imply negative 10-12 year market returns, and a potential market loss on the order of -60% from current levels over the completion of the present market cycle. Despite those expectations, we can’t rule out periodic shifts toward speculative investor psychology, which we would infer from uniformly favorable market internals. We don’t have a 2023 ‘forecast’ or ‘year-end target’ because that’s not how we think about investing. As always, our discipline is to respond to prevailing, measurable, observable market conditions – mainly valuations and market internals – and to shift our investment outlook as those conditions shift. No forecasts or scenarios are required.
Interest rates, inflation, and the Fed
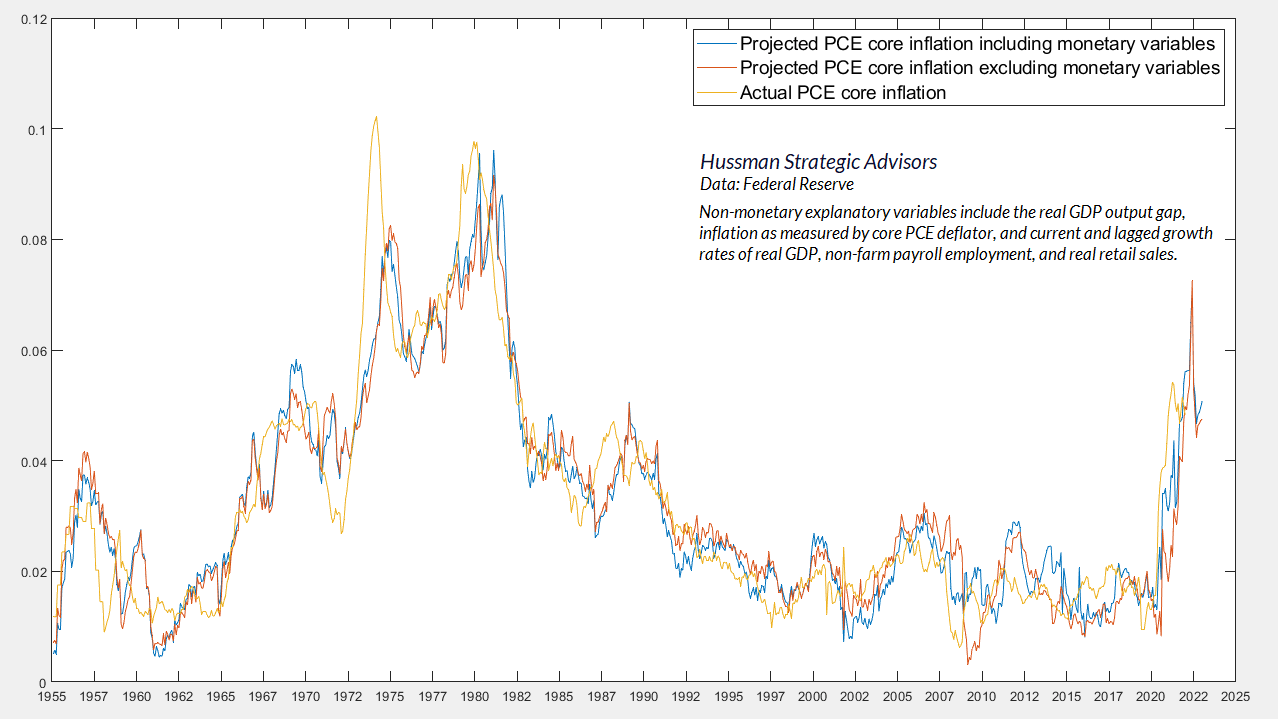
On the subject of interest rates and inflation, I’ll reiterate that the single best predictor of year-ahead inflation is current year-over-year inflation, and the second-best predictor is last year’s inflation rate. I know you don’t believe that, so I encourage you to prove that to yourself in long-term historical data. While Fed policy, ISM readings, leading indicators, recessions, unemployment, GDP growth, credit spreads, shipping costs, wage inflation, productivity growth, and countless other measures do affect inflation, in some cases meaningfully, they come in second to prevailing inflation, unless they are extreme – for example, a banking crisis. Otherwise, the tools of monetary policy are quite blunt, and the relationships between Fed policy variables and inflation, or unemployment and inflation, are nowhere near what the public, Wall Street analysts, journalists, and even central bankers seem to believe.
The main way Fed tightening affects inflation in the short-run is through interest-sensitive economic activity like housing, as well as a tendency to accelerating the consequences of reckless speculative behavior encouraged by the Fed (as we saw during the global financial crisis). If you want to blame the Fed for anything, don’t blame it for normalizing interest rates. Blame it for the decade of deranged zero-interest rate policy that produced a yield-seeking bubble in the first place. The other important impact of Fed credibility is to increase public confidence that government liabilities (both bonds and money) will hold their value, and that the Fed will not behave as an arm of government finance. Remember – fiscal policy determines the quantity of government liabilities the public must hold. Monetary policy determines whether the liabilities are held by the public as interest-bearing bonds or as base money. For a discussion of what the Fed is doing today, explicitly paying interest to banks on the reserves it has created, and incurring hundreds of billions in unlegislated spending to do it, see Diary of a deranged ‘ample reserves regime’ in Now Comes the Hard Part.
The chart below underscores that inflation estimates are not particularly sensitive to whether monetary policy variables (interest rates, base money growth) are included or not. That doesn’t mean that monetary policy is useless. It just means that the impact of monetary policy is in the “systematic” component that responds to observable data like inflation, employment, and output. Unsystematic or “discretionary” policy has very little effect. The main thing that unsystematic policy affects is yield-seeking speculation, and that’s the consequence of Fed recklessness that I expect will end in tears.
All of that said, I do expect inflation will gradually ease over the coming year, but it’s not at all clear it will do so in a nice linear way, nor that we’ll get close to a 2% endpoint. Taken at face value, the projections that we get from both vector autoregressions and informal “kitchen sink” models generally imply a final spike in year-over-year inflation somewhere between February and April of 2023. I wouldn’t place too much weight on something so specific, but I do suspect that core inflation may be closer to the 4% area than the 2% area a year from now. That could still give the Fed enough cover to reduce interest rates later in the year from the peak of about 5-5.25% that it currently expects to reach. But remember that the worst market losses tend to follow, not precede, the initial Fed pivot, because pivots typically occur at the point where “something just broke.”
Meanwhile, it will help to learn the right lesson from my admitted error in the face of zero-interest rate policy. In prior cycles across history, there were certain well-defined “limits” to speculation, which warned of impending risk even before market internals deteriorated explicitly. Amid the “fear of missing out” and “there is no alternative” mindset encouraged by a decade of zero interest rate policy, responding to those limits became detrimental, until internals deteriorated explicitly. We adapted to that reality years ago, prioritizing the condition of market internals, and restoring the strategic flexibility that we enjoyed across decades of complete market cycles prior to QE. The impact of these adaptations on our discipline is evident even amid the volatile advance in the S&P 500 since 2019.
After a decade of justifying speculation with phrases like “Don’t fight the Fed” and “Don’t fight the trend,” it’s striking how eager investors are to fight both here. As I’ve detailed before, the entire total of the S&P 500 historically, and even amid zero-interest rate policy, accrued in periods when market internals were favorable on our measures, even when valuations and overextended “limits” were extreme. If there’s one phrase that summarizes our own adaptations during this bubble, it’s “Don’t fight market internals.”
Put simply, the lesson to learn from this yield-seeking speculative bubble is not that valuations are irrelevant. Nor should investors “learn” that easy money always supports stocks. Indeed, the bulk of the 2000-2002 and 2007-2009 collapses featured unfavorable internals combined with aggressive Fed easing. The thing to learn is that both valuations and market internals matter profoundly, and that they are best used in combination.
The composition argument is a feel-fact
I’ve detailed the impact of interest rates, profit margins, taxes and other factors in previous comments – see for example, the section on price/earnings ratios in Are We There Yet? and the section titled “Valuations are testable” in Now Comes The Hard Part. The short answer to the assertion that “high valuations are justified by interest rates” is first, that the function of high valuations in that argument is to reduce future expected returns on stocks to levels that are commensurate with interest rates. There’s nothing wrong with saying “interest rates are zero, so the expected return on stocks should also be roughly zero” – as long as you’re actually willing to earn returns of roughly zero on stocks. Otherwise, the argument is a misinterpretation of how valuations and discounted cash flows work. Second, it’s worth considering that interest rates are no longer at zero.
Meanwhile, profit margins have been elevated in recent years because real unit labor costs were depressed for years coming out of the global financial crisis, and also because the deficits of government must, and did, emerge as surpluses for other sectors, boosting profits directly through PPP subsidies, and boosting them later as households have spent down their own surpluses. All of these factors are now in retreat.
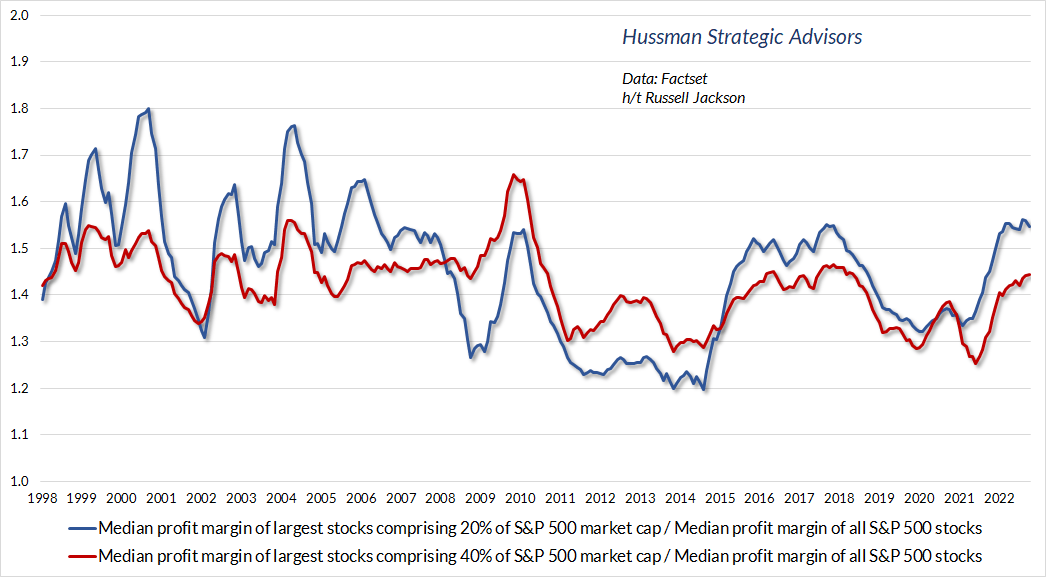
A related assertion is what I call the “composition argument” – the claim is that the profit margins of today’s large-cap stocks are so much higher than S&P 500 companies as a group, that they distort the analysis of aggregate profit margins and valuations, allowing the conclusion – always reached during speculative bubbles – that “previous standards of value no longer apply.”
As the chart below demonstrates – thanks to our resident math guru Russell Jackson for compiling this data – the composition argument is a “feel fact.” To paraphrase a line from SNL, “It’s not technically a fact, it just feels true.” The reality is that the profit margins of the largest S&P 500 components are no higher than they have historically been, relative to the median S&P 500 component. Yes, the profit margins of the largest components tend to be about 1.4 to 1.6 times higher than the median index component, but that ratio has fluctuated sideways, not up, in recent decades.
So yes, elevated profit margins have contributed to this speculative bubble. But the composition argument does little to change the analysis. As I noted in February, “The record stock prices that investors observe here are the product of a) record valuation multiples that have been inflated by a decade of zero interest rate policy and resulting speculation by yield-starved investors, times; b) record earnings that embed distorted profit margins inflated by trillions of dollars of temporary deficit spending. Investors are paying top dollar for top dollar.”
They’ve ruled out tail risk
The latest Barron’s poll of Wall Street strategists, not one 2023 target implies a loss in the S&P 500 over the coming year. The average year-end-target for 2023 is over 4200, with both the median and average target implying a 2023 total return of over 10% for the index.
For our part, our most reliable valuation measures imply negative 10-12 year market returns, and a potential market loss on the order of -60% from current levels over the completion of the present market cycle. Despite those expectations, we can’t rule out periodic shifts toward speculative investor psychology, which we would infer from uniformly favorable market internals. Put simply, we don’t have a 2023 “forecast” or “year-end target” because that’s not how we think about investing. As always, our discipline is to respond to prevailing, measurable, observable market conditions – mainly valuations and market internals – and to shift our investment outlook as those conditions shift. No forecasts or scenarios are required. My personal opinion is that 2023 is more likely than not to be a terrible year for stocks, but if market internals improve, we’ll adhere to our discipline and flatten that outlook to neutral or constructive, at least while favorable internals persist.
That said, it’s notable that options traders have essentially ruled out “tail risk” – the risk of extreme market losses. No math is required for this discussion. All you need to know is that the prices of options say a great deal about the “shape” of the probability distribution that investors expect for future prices.
Here’s the fun part. The amount of “skew” priced into options turns out to be a contrary indicator. The more investors are concerned about extreme losses, the more constructive the market outlook. Conversely, the more investors tend to rule out extreme losses, the more concerned you should be about a trap door.
Investors have probably ruled out tail-risk to a greater extent than may be good for them.
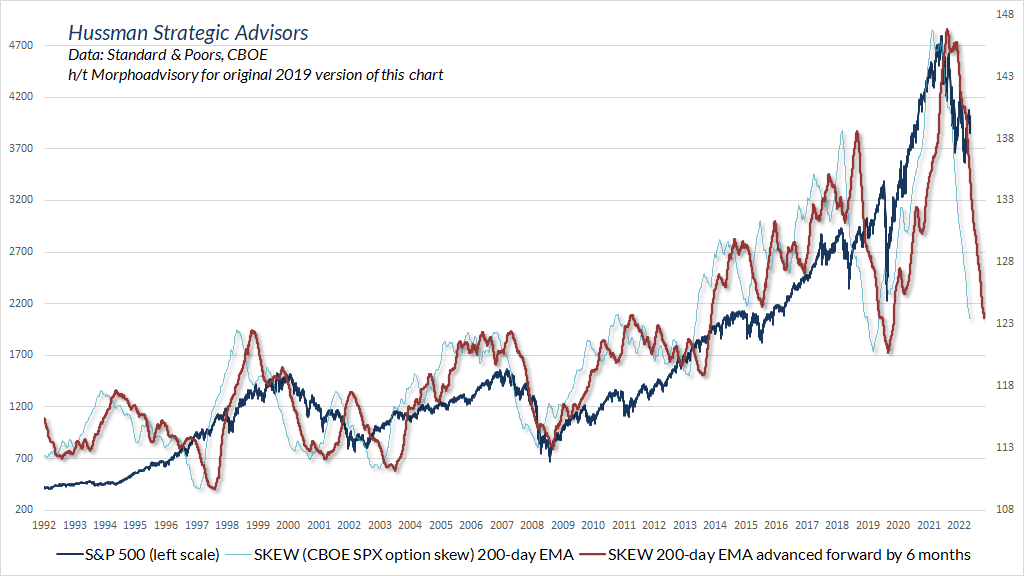
The chart below is a version of one that Morpho Advisory shared with me in 2019. My modest adaptation shows the 200-day average of the CBOE “SKEW” index (a complex calculation involving arbitrage pricing), advanced forward by 6 months, versus the S&P 500 Index. Needless to say, it’s a rather ugly chart. The persistently low level of SKEW essentially says that investors have ruled out tail-risk in the S&P 500.
Geek’s note – The “Black-Scholes” model of option prices assumes that the probability distribution of future (log) prices follows a normal, bell-shaped curve, nice and symmetric. In reality, investors typically price options to reflect a fatter “left tail” – meaning a slightly larger probability of a very large loss than a similarly large gain. Of course, the area under the curve still has to add up to 1.0, so area must be redistributed elsewhere while still adhering to certain arbitrage constraints, all of which results in option prices that seem “off” from the prices one would get from a fixed-volatility Black-Scholes model. As a result, when traders fit implied volatilities to options with various strike prices using Black-Scholes, they see a “smile” in the profile or “vol curve” (implied volatility by strike). That’s because the distribution assumed by Black Scholes doesn’t match the one in trader’s heads. The actual probability distribution would deliver a fixed standard deviation – every distribution has one – but nonzero higher moments. As for the CBOE measure of skew, rather than inferring skew from the third moment of a generalized implied distribution, the SKEW measure produced by the CBOE is calculated by calculating the implied payoff S of a skew portfolio comprised of a weighted strip of options, which is then scaled as SKEW = 100-10*S, so that more negative distributional skew results in a higher level of SKEW. Geek’s note over and out 🙂
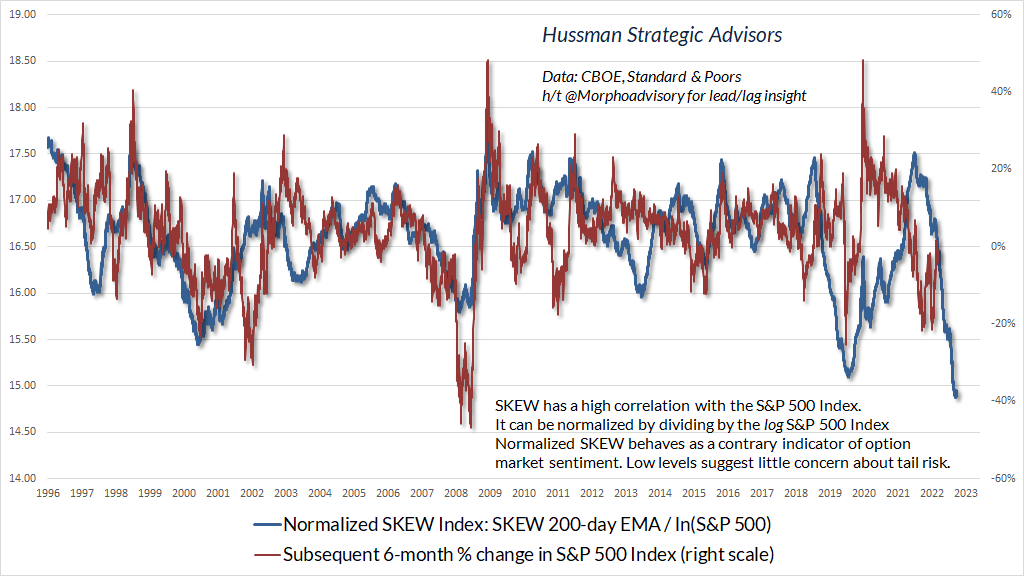
The SKEW index produced by the CBOE is partially correlated with the S&P 500 index itself. Though it’s not an exact solution, I find that the SKEW index can be approximately normalized by dividing by the log of the S&P 500 Index. The resulting measure, what I’ll call “normalized SKEW,” can be compared directly with the subsequent 6-month percentage change in the market.
Whether we examine the projections of Wall Street analysts, or the pricing behavior of options traders, investors seem to have ruled out tail-risk – the risk of extreme market losses. Both have historically behaved as contrary indicators. Interpreted as a sentiment indicator, normalized SKEW is actually better correlated with subsequent market returns than other popular sentiment indicators, including the Investors Intelligence and American Association of Individual Investors (AAII) surveys. The correlation isn’t tight enough to place confidence in the current implication – a striking loss in the S&P 500 over the coming 6 months – but it’s enough to suggest that investors have probably ruled out tail-risk to a greater extent than may be good for them.
Wishing you a merry, peaceful and bright holiday season – John.
|
The foregoing comments represent the general investment analysis and economic views of the Advisor, and are provided solely for the purpose of information, instruction and discourse. Prospectuses for the Hussman Strategic Growth Fund, the Hussman Strategic Total Return Fund, the Hussman Strategic International Fund, and the Hussman Strategic Allocation Fund, as well as Fund reports and other information, are available by clicking “The Funds” menu button from any page of this website. Estimates of prospective return and risk for equities, bonds, and other financial markets are forward-looking statements based the analysis and reasonable beliefs of Hussman Strategic Advisors. They are not a guarantee of future performance, and are not indicative of the prospective returns of any of the Hussman Funds. Actual returns may differ substantially from the estimates provided. Estimates of prospective long-term returns for the S&P 500 reflect our standard valuation methodology, focusing on the relationship between current market prices and earnings, dividends and other fundamentals, adjusted for variability over the economic cycle. Further details relating to MarketCap/GVA (the ratio of nonfinancial market capitalization to gross-value added, including estimated foreign revenues) and our Margin-Adjusted P/E (MAPE) can be found in the Market Comment Archive under the Knowledge Center tab of this website. MarketCap/GVA: Hussman 05/18/15. MAPE: Hussman 05/05/14, Hussman 09/04/17. Performance data quoted represents past performance. Past performance does not guarantee future results. Investment return and principal value of an investment will fluctuate so that an investor’s shares, when redeemed, may be worth more or less than their original cost. Current performance may be lower or higher than performance data quoted. More current performance data through the most recent month-end are available at the Fund’s website www.hussmanfunds.com or by calling 1-800-487-7626. Investors should consider the investment objectives, risks, and charges and expenses of the Funds carefully before investing. For this and other information, please obtain a Prospectus and read it carefully. The Hussman Funds have the ability to vary their exposure to market fluctuations depending on overall market conditions, and they may not track movements in the overall stock and bond markets, particularly over the short-term. While the intent of this strategy is long-term capital appreciation, total return, and protection of capital, the investment return and principal value of each Fund may fluctuate or deviate from overall market returns to a greater degree than other funds that do not employ these strategies. For example, if a Fund has taken a defensive posture and the market advances, the return to investors will be lower than if the portfolio had not been defensive. Alternatively, if a Fund has taken an aggressive posture, a market decline will magnify the Fund’s investment losses. The Distributor of the Hussman Funds is Ultimus Fund Distributors, LLC., 225 Pictoria Drive, Suite 450, Cincinnati, OH, 45246. The Hussman Strategic Growth Fund has the ability to hedge market risk by selling short major market indices in an amount up to, but not exceeding, the value of its stock holdings. However, the Fund may experience a loss even when the entire value of its stock portfolio is hedged if the returns of the stocks held by the Fund do not exceed the returns of the securities and financial instruments used to hedge, or if the exercise prices of the Fund’s call and put options differ, so that the combined loss on these options during a market advance exceeds the gain on the underlying index. The Fund also has the ability to leverage the amount of stock it controls to as much as 1 1/2 times the value of net assets, by investing a limited percentage of assets in call options. The Hussman Strategic Allocation Fund invests primarily in common stocks, bonds, and cash equivalents (such as U.S. Treasury bills and shares of money market mutual funds, aligning its allocations to these asset classes based on prevailing valuations and estimated expected returns in these markets. The investment strategy adds emphasis on risk-management to adjust the Fund’s exposure in market conditions that suggest risk-aversion or speculation among market participants. The Fund may use options and futures on stock indices and Treasury bonds to adjust its relative investment exposures to the stock and bond markets, or to reduce the exposure of the Fund’s portfolio to the impact of general market fluctuations when market conditions are unfavorable in the view of the investment adviser. The Hussman Strategic Total Return Fund has the ability to hedge the interest rate risk of its portfolio in an amount up to, but not exceeding, the value of its fixed income holdings. The Fund also has the ability to increase the interest rate exposure of its portfolio through limited purchases of Treasury zero-coupon securities and STRIPS. The Fund may also invest up to 30% of assets in alternatives to the U.S. fixed income market, including foreign government bonds, utility stocks, convertible bonds, real-estate investment trusts, and precious metals shares. The Hussman Strategic International Fund invests primarily in equities of companies that derive a majority of their revenues or profits from, or have a majority of their assets in, a country or country other than the U.S., as well as shares of exchange traded funds (“ETFs”) and similar investment vehicles that invest primarily in the equity securities of such companies. The Fund has the ability to hedge market risk by selling short major market indices using swaps, index options and index futures in an amount up to, but not exceeding, the value of its stock holdings. These may include foreign stock indices, and indices of U.S. stocks such as the Standard and Poor’s 500 Index. Foreign markets can be more volatile than U.S. markets, and may involve additional risks. The Prospectus of each Fund contains further information on investment objectives, strategies, risks and expenses. Please read the Prospectus carefully before investing. The Market Climate is not a formula but a method of analysis. The term “Market Climate” and the graphics used to represent it are service marks of Hussman Strategic Advisors (formerly known as Hussman Econometrics Advisors). The Fund Manager has sole discretion in the measurement and interpretation of market conditions. Information relating to the investment strategy of each Fund is described in its Prospectus and Statement of Additional Information. A schedule of investment positions for each Fund is presented in the annual and semi-annual reports. Except for articles specifically citing investment positions held by the Funds, general market commentary does not necessarily reflect the investment position of the Funds. |
Editor’s Note: The summary bullets for this article were chosen by Seeking Alpha editors.
Be the first to comment