

Nikada/iStock Unreleased via Getty Images
In my last article covering Apple (NASDAQ:AAPL), I stated that: “The other less probable close would be to fall from its current price range and look to form the wave two as it stands” Then chairman Powell spoke.
If you read the last Apple article, it covered Apple’s meteoric rise off the apparent low and it wasn’t a case of if, it was a case of when Apple would find a rejection paving the way for a bullish third wave. You can find the link to the previous article here.
Aside from the fact that we won’t see a wave one outside the previous high, there is plenty of good news, as we are only a matter of days away from Apple’s (Far out) event revealing the iPhone 14 with expected different variations along with new Apple Watches and AirPods. A potential bullish wave one two may also have formed and it was at the time of writing of the last Apple article, we didn’t know when or at what price point that would be.
Below we can see the monthly Apple chart before the Jackson hole conference minutes were released. So strong was the surge off the bottom at $129 that there was reasonable portability that Apple could have broken above the previous high of $182 before even forming a bullish wave one.
Apple monthly to August 2022 (C Trader )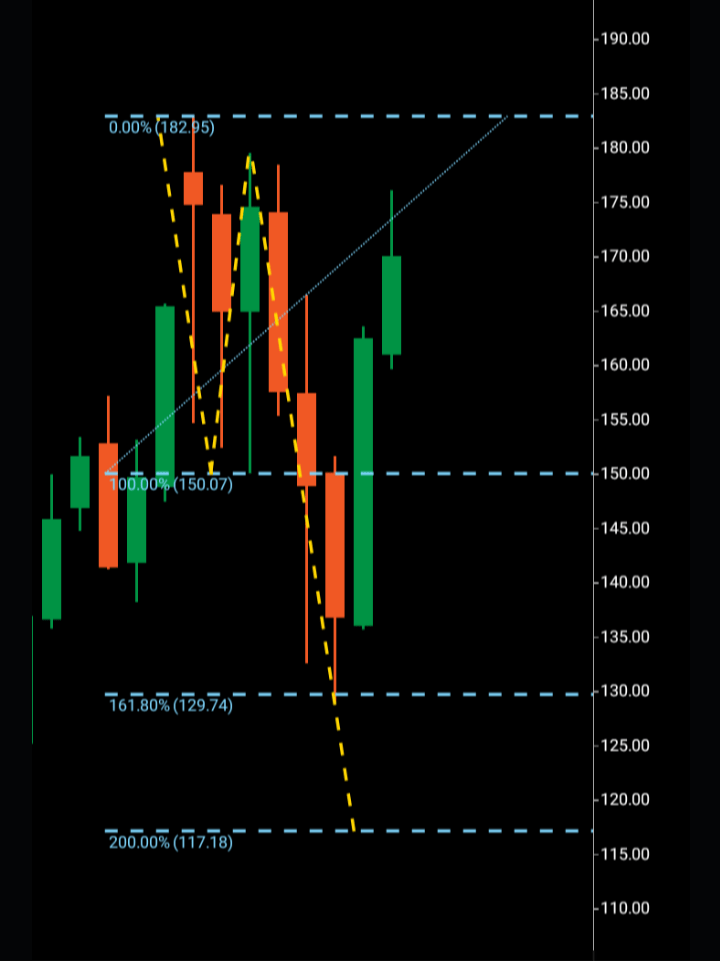
However, as it transpired, this did not happen and it was the latter alternative set out for August’s monthly candle which is the way it was to finish, in a bearish rejection form.
Now we can move to the current monthly chart below as is and look to identify the potential wave one and wave two in more detail and examine where the wave three might go, should it break out.
Apple monthly (C Trader )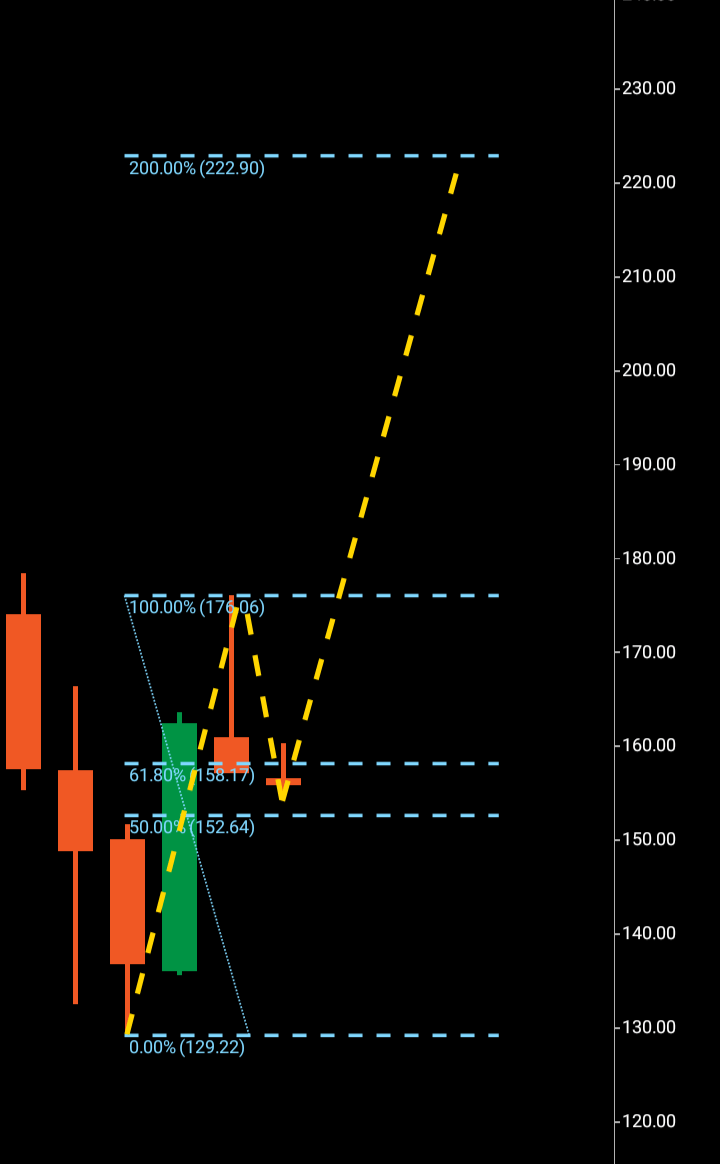
Apple appears to have bottomed, (something we will not know until the third wave breaks out) but in the meantime let’s look at the signals it is printing to give us cause to technically believe that.
A bounce off the $129 area eventually came to a halt at $176, with clear rejection from that area, since then, at the low $150 region, this equity has found upward traction from just below the Fibonacci 61% retrace.
A clear potential wave pattern has emerged with a wave one $129-$176 and wave two $176-152. The bottom of the bearish rejection candle is showing no wick at its close and if the wave two low of $152 is the low, there is a lack of a large bottom wick also. However, the end of month was also end of week so it could be that investors left any bullish orders until the new month open and this is the explanation for no bottom wick on August’s candle. A few days away from the new product launch, technically there is enough of a wick formed which represents enough orders on this month’s candle to see this equity higher.
Apple hasn’t made a bullish three wave pattern since October 2021, below we can see that the previous wave pattern was formed with the break out above $157 eventually topping out above the Fibonacci 161 at the $180 region. On occasions, third waves will top out at Fibonacci 161’s but overall, the probability lies that a third wave will hit its numerical replication of wave one at the Fibonacci 200% level.
Apple monthly previous three wave pattern (C Trader )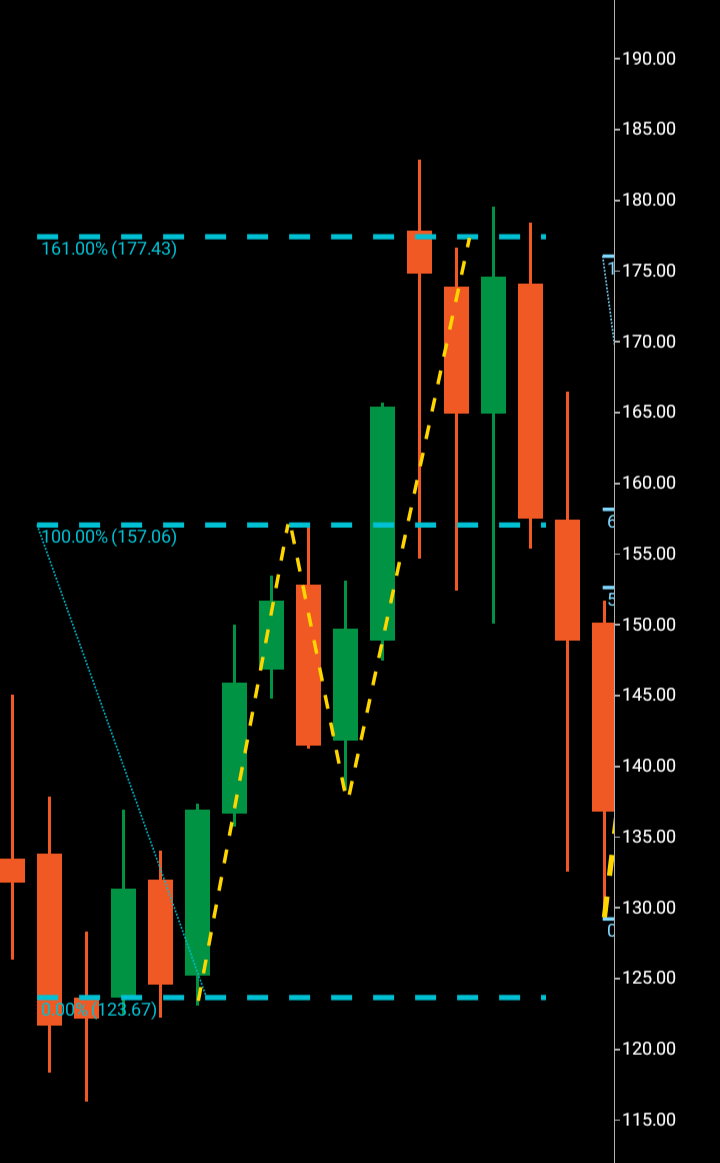
Apple monthly previous bullish pattern alongside current potential bullish pattern. (C Trader )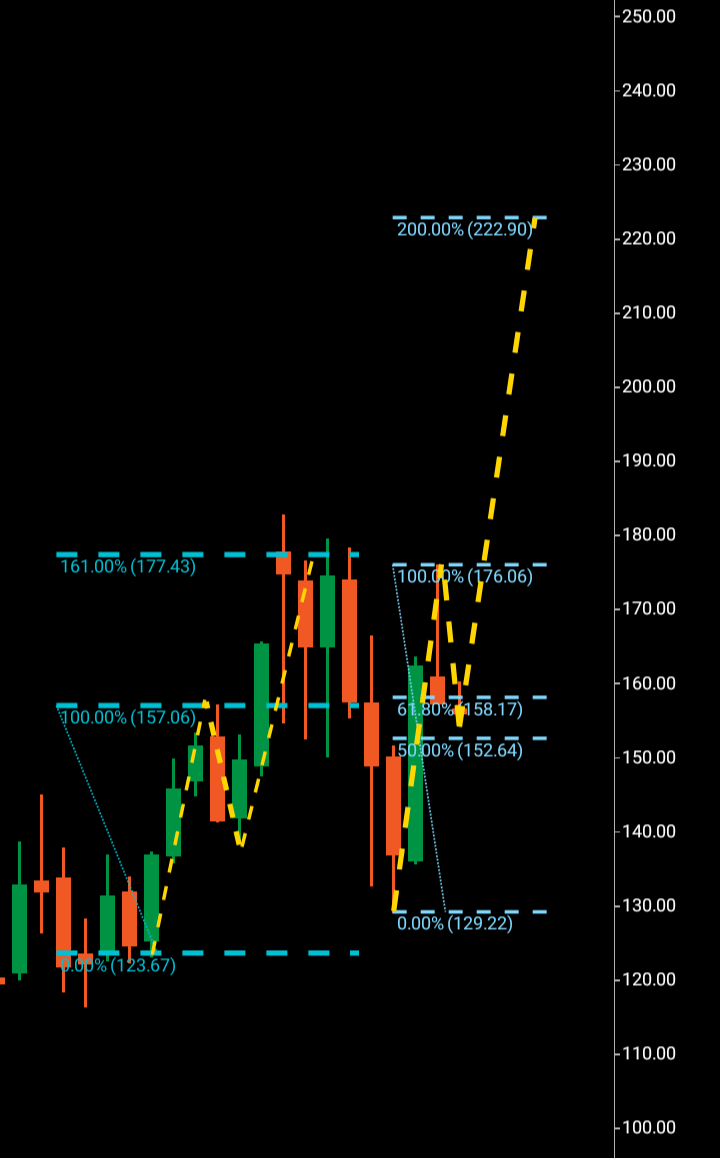
To finalize, if Apple can break and hold above $176 from its current price level that would technically trigger a third wave to $222 in the immediate term. Alternatively, the wave two buying may not be done so it could be that Apple chooses to retrace further into the potential wave one but must stay above the $129 price area. A move below that will render this potential three wave pattern a fail. A move above $176 directly and Apple could arrive at $222 within 60 to 90 days.
About the Three Wave Theory
The three wave theory was designed to be able to identify exact probable price action of a financial instrument. A financial market cannot navigate its way significantly higher or lower without making waves. Waves are essentially a mismatch between buyers and sellers and print a picture of a probable direction and target for a financial instrument. When waves one and two have been formed, it is the point of higher high/lower low that gives the technical indication of the future direction. A wave one will continue from a low to a high point before it finds significant enough rejection to then form the wave two. When a third wave breaks into a higher high/lower low the only probable numerical target bearing available on a financial chart is the equivalent of the wave one low to high point. It is highly probable that the wave three will look to numerically replicate wave one before it makes its future directional decision. It may continue past its third wave target but it is only the wave one evidence that a price was able to continue before rejection that is available to look to as a probable target for a third wave.
Be the first to comment