

naphtalina/iStock via Getty Images
The purpose of this article is to examine the USA sectoral flows for July 2022 and assess the likely impact on markets as we advance into August. This is pertinent, as a change in the fiscal flow rate has an approximately one-month lagged impact on asset markets and is a useful investment forecasting tool. Other macro-fiscal flows can point to events many months ahead.
The table below shows the sectoral balances for the USA and is produced from the national accounts.
US Treasury and Author calculations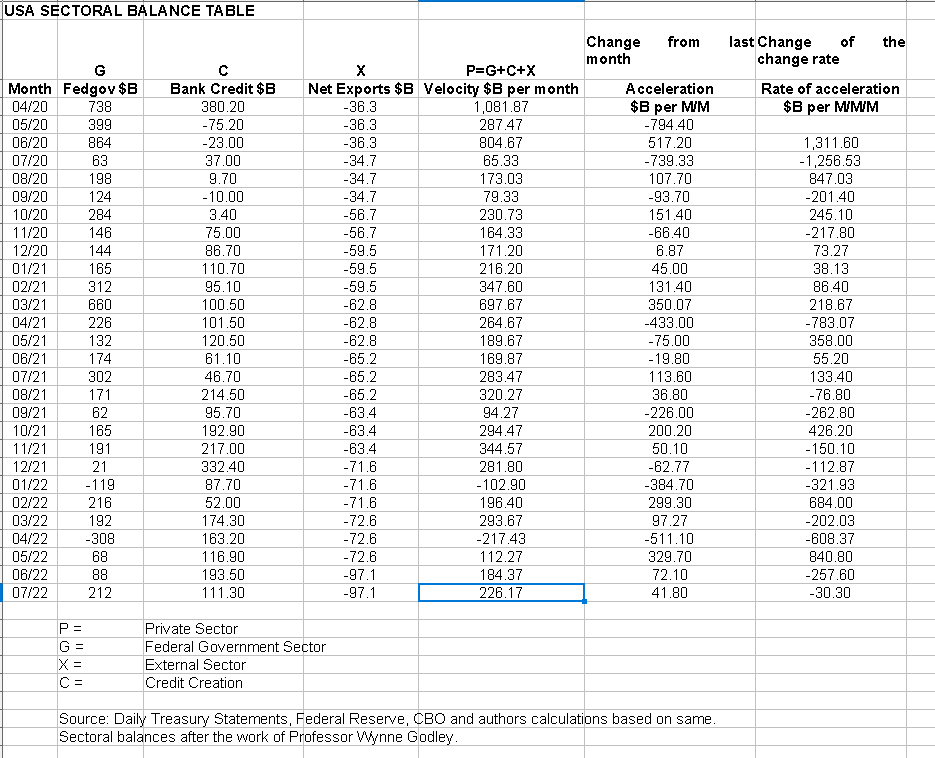
The table format has been enlarged this month to include the terms of money velocity as to how fast the new money is entering the monetary system and also the rate at which it is entering. This is interesting because it shows that while we now have three consecutive months of nominal gains, that even appear to be larger each time [which is really good], the rate of increase is decelerating and that is not such a positive trend. The new flow and acceleration rates were the product of collaboration with Mr. Nick Gomez from the Away from the Herd SA market service. It helps to have a math genius on your team.
From the sectoral balances table above, we see that for July 2022, we have a positive nominal flow of $226+B into the private sector and a positive change rate month over month but that the rate is falling. For markets, the change rate tends to be more important than the headline number, and in this case, both are positive and this is supportive for asset markets.
The chart below shows the five-year average of the seasonal stock market patterns for the SPX (SPX), NDX (NDX), Dow (DIA), Russell 2000 (RTY), and Biotech (IBB) market indexes. The black oval shows roughly where we are [trading day 160 at the time of writing and the end of the green line on the chart below]. Markets have been moving up since June now and match the private sector surplus that has been pouring in for the last three months.
Robert P Balan
The $226+ billion is made up of a $212+ billion injection of funds from the federal government, plus a strong $111+ billion of credit creation from commercial banks and less the -$97+ billion that flowed out of the private domestic sector and into foreign bank accounts at the Fed in return for imported goods and services.
The following chart emerges when one graphs the change rate of the information in the USA sectoral balances table above and adjusts for impact time lags.
Robert P Balan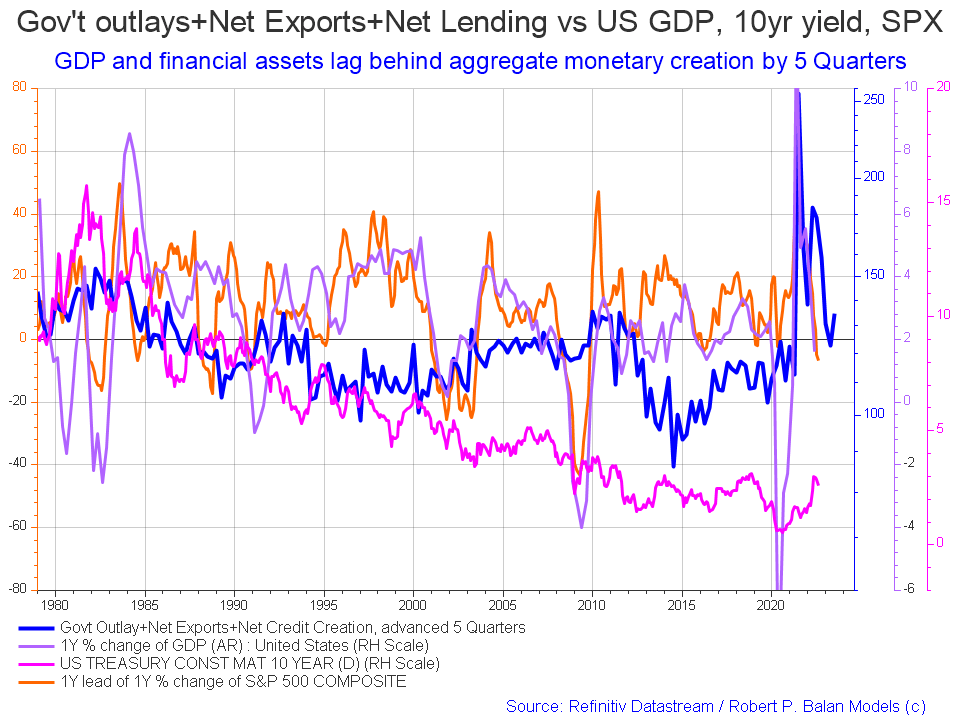
Compared to last month, one sees that the all-important blue fiscal flow line has flipped up at last and points to a recovery of the dip that is going to occur in the summer of next year and also has a positive influence on the present and near future.
The chart of indices, just above the last chart, shows that the SPX and markets generally have been trending upwards since the start of the last three months of consecutive private domestic sector surpluses. August should see another such surplus, and then September 15th sees a major federal tax event that will reverse fortunes and perhaps provide a buy-the-dip opportunity in what is now a rising market.
The table below shows that the overall federal expenditures were 15% less than last month. The private domestic surplus shown in the first table was only achieved because Federal deposits by way of taxes and charges, etc., were less overall.
US Treasury and Author calculations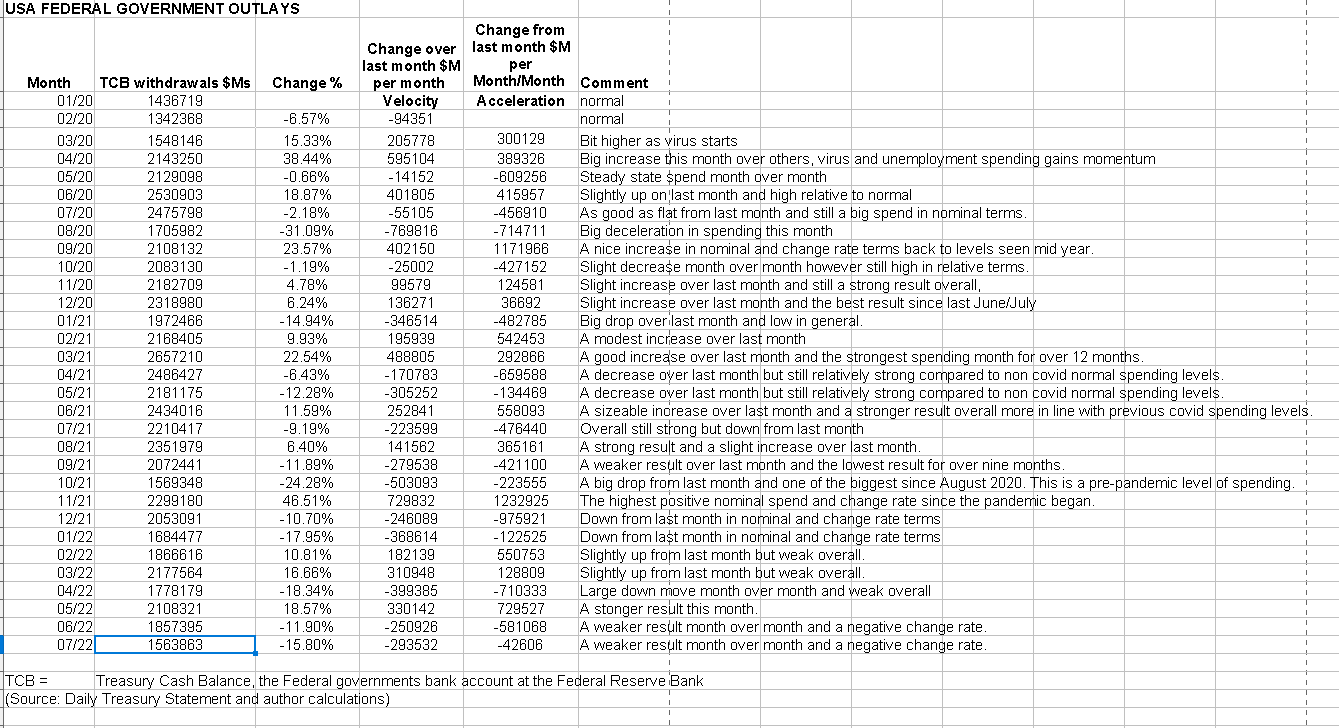
The above chart has been enlarged to show the change over last month and the related change of same. It, too, reveals a consistent deceleration in outlays the same as the trend in the first table and not a good trend overall.
The chart below shows graphically the relationship between the federal government (currency creator) and the private sector (currency user) and is from ANG Traders of the Away from the Herd SA Marketplace service. The bottom panel highlights in red and green the financial relationship between the currency creator and currency users.
The 20-day average net transfer is +$8.78B/day. Solid market support continues. (chart below).
(Source: Mr. Nick Gomez, ANG Traders, Away from the Herd SA Market Service).
ANG Traders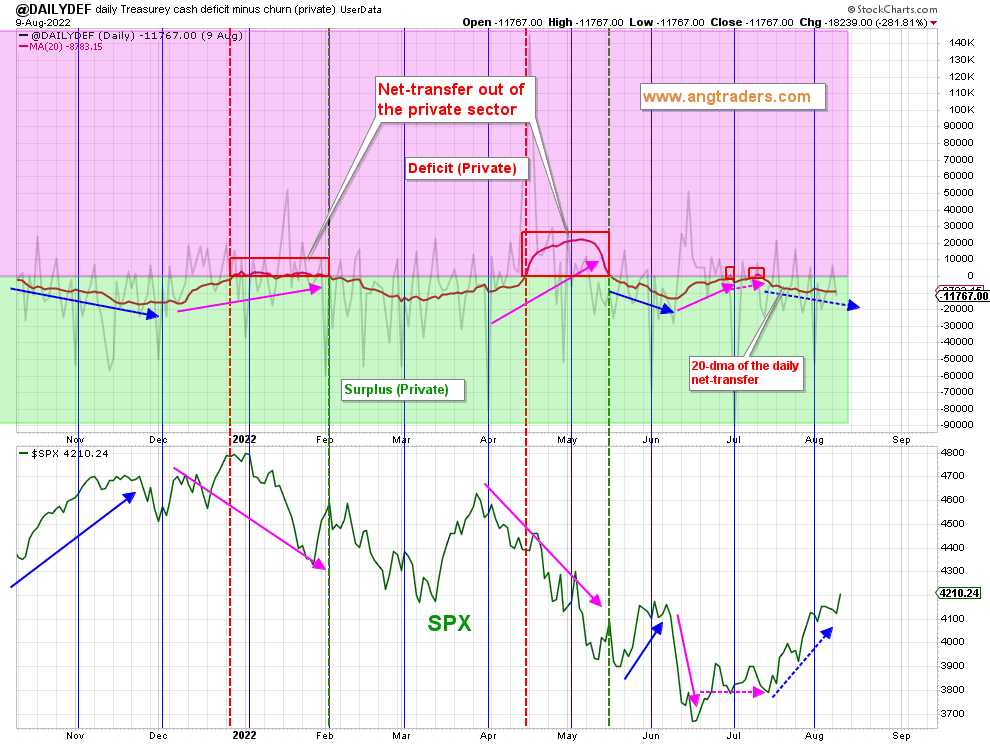
The positive takeaway here is that the overall trend is back down into a private sector surplus that supports markets overall and lifts financial balances in the private sector. One can see on the bottom panel how the SPX rises almost on cue with the private sector surplus and vice versa.
ANG Traders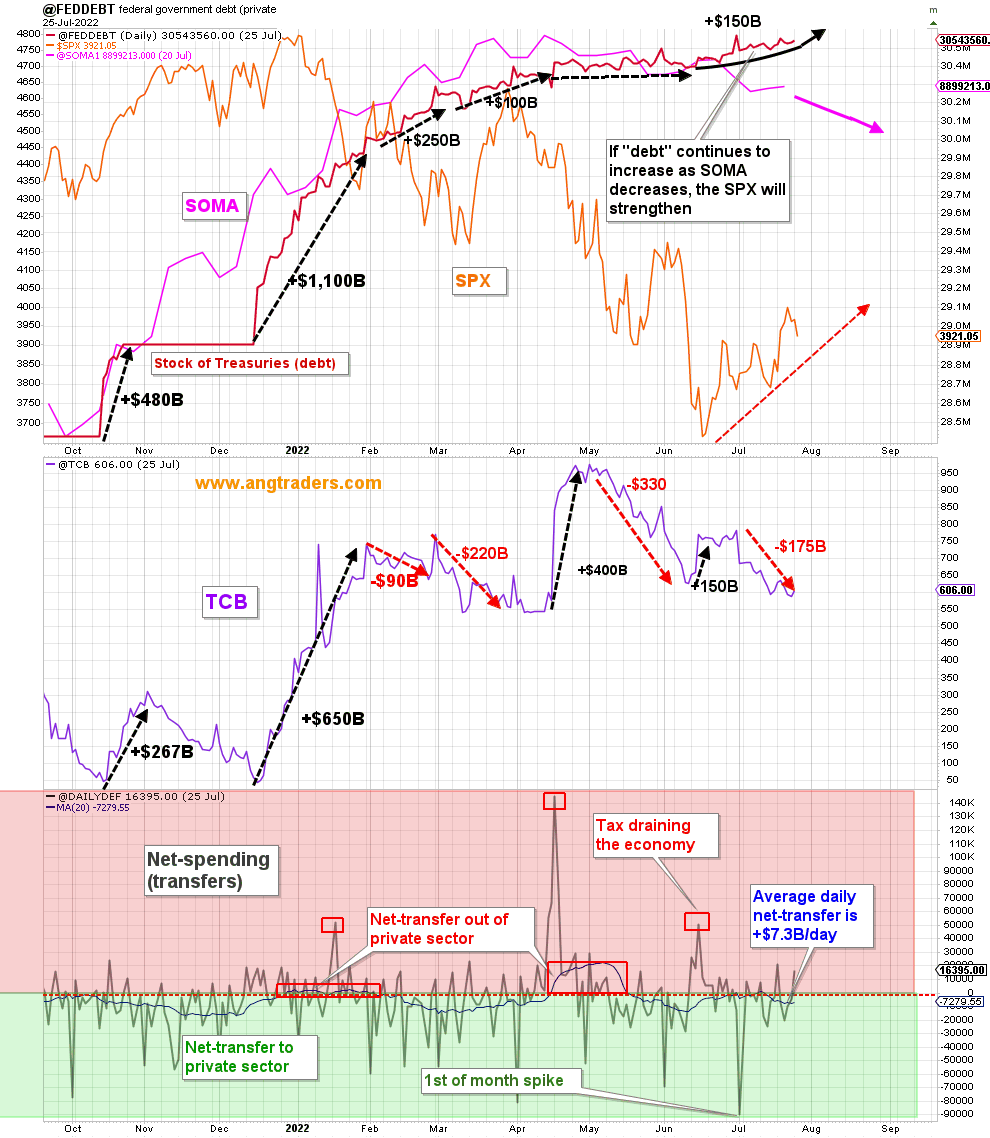
The chart above shows that while the Fed’s balance sheet increased a little bit this last month which was also supportive of markets but with QT now policy the overall trajectory is downwards. The stock of treasuries [national debt] is increasing and this provides fiscal space for rising financial balances in the private sector given that the federal deficit is the private domestic sector surplus and the stock of treasuries is for all practical purposes the best measure of the money supply and it is growing.
At the White House, a surprise event has been the tabling and amazing in-party agreement on the so-called “Inflation Reduction Act of 2022.” Talk about less-than-subtle market spin for naming legislation to make it fit the Zeitgeist and be popular.
The Congressional Budget Office did a review of the budget impact on the new legislation [if passed] and this is shown in the table below.
Congressional Budget Office
Despite all the fanfare, the actual fiscal impact is quite small, and in the time between 2022 and 2026 amounts to an overall deficit spending increase of some $55B. By way of comparison, a typical quarterly treasury interest payment is about that much, and there are four of those each year. The post-2026 figure is not much different. The whole thing needed to be several orders of magnitude larger to have any real effect.
The bill can be termed as inflation reduction inasmuch as it lays down productive infrastructure that increases productive capacity, thus allowing more goods and services to be produced and lowers the cost of living and doing business. It is a move in the right direction, but way too small.
On the subject of inflation, this week, we were treated to an all too rare public article on the subject by Mr. Robert P Balan, and you can read the full article here.
In a nutshell:
It doesn’t matter that the Fed Fund Rate [FFR]is rising. The FFR is a severely lagged variable — Fed severely behind the curve. It only affects market sentiment.
The delayed effect of inflation shows up in current PE multiples, which tend to fall when CPI rises beyond 4.00 pct. But it may be that low P/E currently might just be indicating that the current SPX valuation is low relative to earnings.
So, simply put, the issue is not falling GDP growth – the equity and bond markets have already discounted that months ago. The real concern is inflation, as it does impact the SPX structurally. But market-derived data have now shifted the focus to the potential for disinflation in coming months.
(Source: Mr. Robert P Balan article on Seeking Alpha)
All that Robert writes is backed up with substantive information and charts that leave no room for thought experiments and mainstream dogma. If he says it is going to happen, then it is. How refreshing is that?
On the world stage, the chart below shows the expected likely path of asset markets based on the flow of funds at the macro world level.
The chart below comes from Mr. Robert P. Balan of Predictive Analytic Models and is part of his SA Marketplace service information for subscribers. The chart shows the level of money creation by the top five world central banks in a change rate format, along with a host of other indexes.
Robert P Balan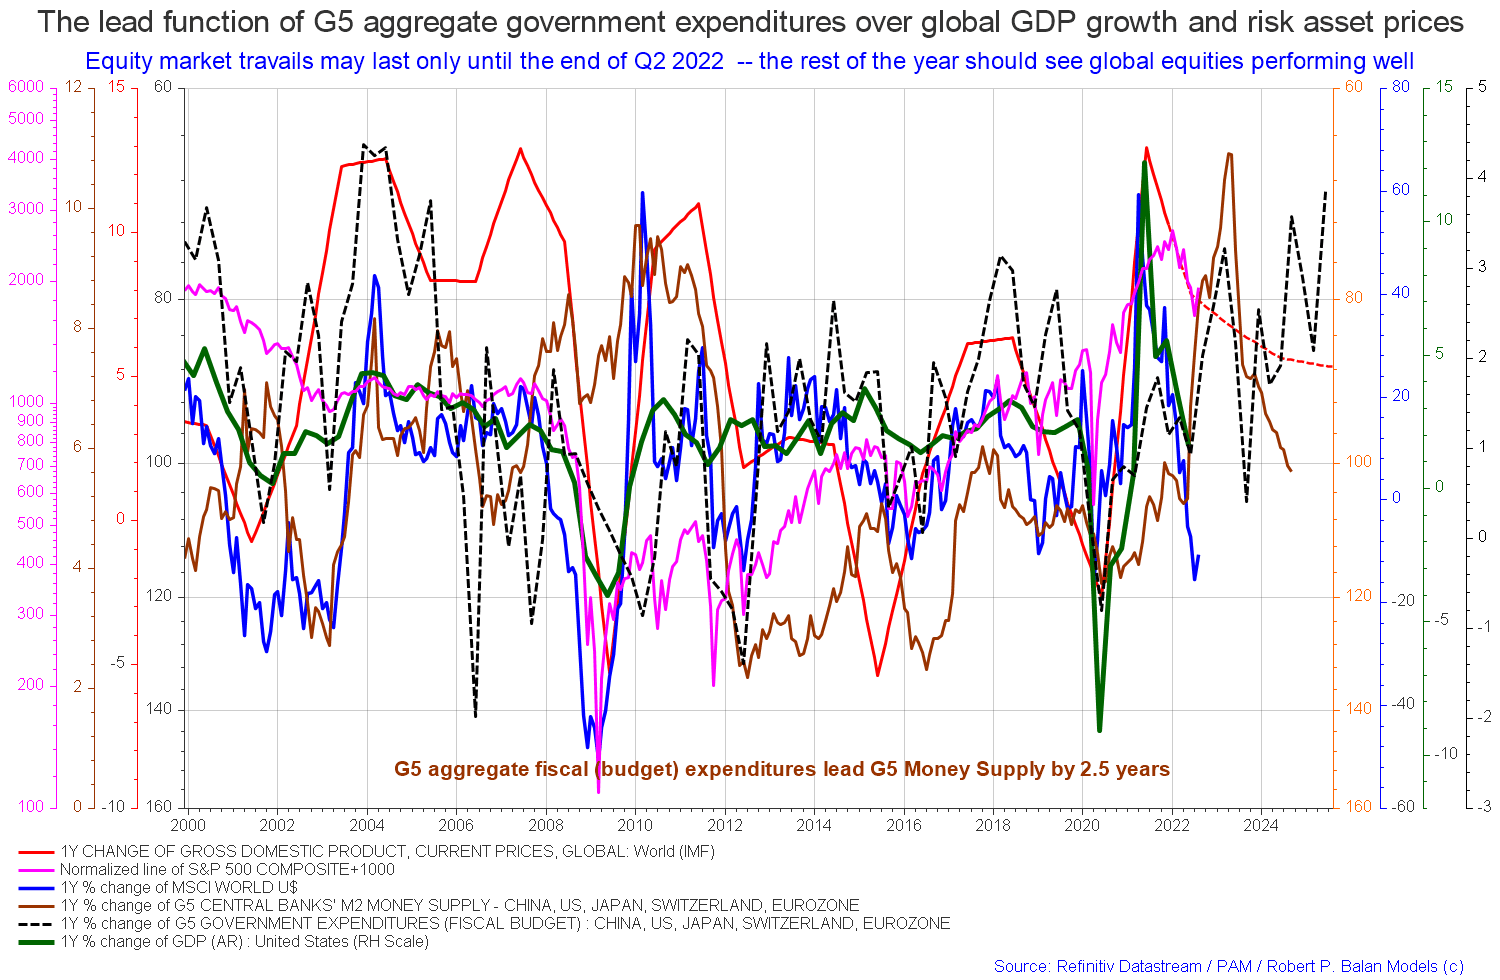
A more zoomed version of the data similar to the chart above shows a near-term uptick in market fortunes led by the lagged impact of the growth in monetary base. [black dotted line]. It is hard to ignore the precipitous fall that occurs in monetary base after that point, and one can clearly see that the SPX follows that line quite faithfully.
Robert P Balan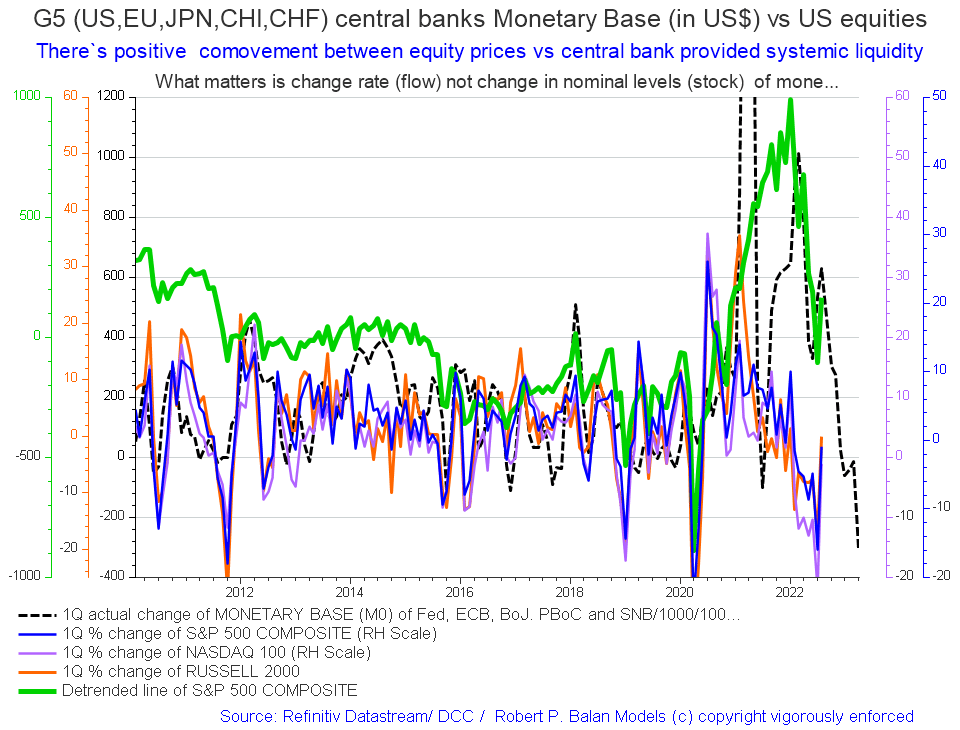
Be the first to comment