

laflor
“Having a little inflation is like being a little pregnant.” – Leon Henderson
The Macro View
Last week’s update was a comprehensive review of the PROS and CONS regarding the investment scene. There hasn’t been much of a change in a difficult backdrop that continues to be challenging. To put this summer in perspective, everyone seems to know the nominal economy is going to slow, likely materially at some point, but it hasn’t happened yet as consumer spending, the jobs market, and corporate earnings remain far more resilient than investor sentiment, but this likely just forces the Fed’s hand on bringing Fed funds rates higher in the near term, increasing the chances for a sharp slowing at some point.
This week’s update will be a more streamlined assessment of the “issues” because we are likely to see plenty of ‘change as the scene unfolds.
Headwinds remain
These are areas of the economy that have slowed over recent quarters.
- Housing – With mortgage rates rising to their highest level since 2008 and home prices appreciating 20% over the last year, housing affordability has plummeted. This along with other factors has ground the housing market to a halt.
- Goods Spending – Inventories are one of the most volatile components of GDP and therefore can produce big swings in the quarterly stats. While inventory restocking was a huge tailwind for growth in 2021, it has been a big drag in the last two quarters. Consumers are still spending, but as we highlighted earlier in the year they have shifted their spending away from goods toward more service-oriented sectors, such as travel and entertainment. The issue is just how long are consumers going to keep up “the summer of revenge travel” mode they are in today?
Attention Warranted
These areas are still expanding, but caution is warranted.
- Tech Spending – When looking at tech investment in aggregate, it’s clear that it remains healthy as a fixed investment in tech-related products rose at an annualized rate of 9.2% in 2Q, outpacing the broader fixed investment decline of 0.1%. This marks 16 out of the last 18 quarters that tech investment outperformed.
However, not all companies are faring as well. Some one-time pandemic beneficiaries (i.e., streaming, at-home services, etc.) have struggled to maintain visibility in their sales after bringing forward much of their sales. As a result, these companies along with mains stream tech giants have had to announce layoffs recently.
- Manufacturing – The shift from goods to services, weakness in the global economy, and strength in the dollar (which makes our exports less attractive to overseas buyers) have all been significant headwinds for the manufacturing sector. This has led ISM Manufacturing to decline from 63.7 in March 2021 (the highest level since 1983) to just 52.8 recently. While the composite index remains in expansionary territory (a level above 50), further declines in the new orders and production sub-indices have us raising a yellow caution sign about the current state of domestic manufacturing demand.
- JOBS – With 2 job openings for every unemployed worker there is plenty of opportunities to keep people employed. However, we do see some weakness creeping in with unemployment claims ramping up. Companies are also starting to announce hiring moratoriums and layoffs.
More calls are popping up for a run to new highs, as well as forecasts for new BEAR market lows. All of that adds to the complex situation investors face today. Although the current market rally off the bottom is impressive, my analysis remains the same. Inflation remains elevated and will not allow the Fed to come to the rescue as it did in late 2018 and 2020, which influenced a V-bottom in stocks for both periods. Additionally, the lag effect of the current Fed tightening will weigh on the economy and earnings growth in the months ahead- as market concerns shift from inflation toward economic and fundamental weakness. The latest tax and spend green energy bill that was just passed does not contain a scintilla of “growth”, indicating the path to any rebound is going to be rocky.
Therefore, a period of back-and-forth trading activity is the likely path in the near term. While recent price action suggests the S&P 500 is attempting to transition to more of a sideways trend, the predominant trend remains downward for now. While there is likely more time or weakness to go in this bear market, investors should keep the MACRO view as the core of their strategy.
That simply means don’t lose sight of the bull market opportunity on the other side of the current weak trend. When that arrives is open to debate.
YOUR situation should dictate YOUR strategy.
The Week On Wall Street
It wasn’t a huge surprise that profit-taking was in order when the market opened for trading this week. After all, it’s been 4 straight weeks of gains for the S&P which has brought the index 16% off the lows. The NASDAQ and the Small caps are up ~20% in the same time frame. Similar to every other intraday pullback during this rally early selling gave way and buyers took over.
The S&P posted modest gains on Monday and Tuesday, while the DJIA extended its winning streak to 5 straight days entering Wednesday. The trading action turned into a give-and-take scene as the indices wrestled with overhead resistance. Th BEARS won this round of the tug of war. All of the indices suffered losses on Friday that resulted in the 4-week winning streaks of the S&P, NASDAQ, and Russell 2000 all being broken.
The Economy
Economic data continues to come in weak and isn’t aligned with the “no recession” view.
GDP forecasts; Deja Vu all over again?
Atlanta Fed’s GDPNow index was nudged down to a 1.8% growth rate for Q3 versus the prior 2.45% estimate from August 10.
The Leading economic index fell 0.4% to 116.6 in July after dropping 0.7% to 117.1 in June. The 119.4 from February was the all-time peak for this index going back to 1959. This is a fifth straight monthly decline and the sixth out of the last seven months. Though 6 out of the 10 components that make up the index contributed positively, the 0.37% cratering in the consumer expectations component weighed heavily. Also making negative contributions were new orders (-0.17%), jobless claims (-0.09%), and building permits (-0.04%). On the positive side were the rate spread (0.15%) and the workweek (0.06%), with more minor contributions from the rest.
U.S. LEI (www.conference-board.org/topics/us-leading-indicators)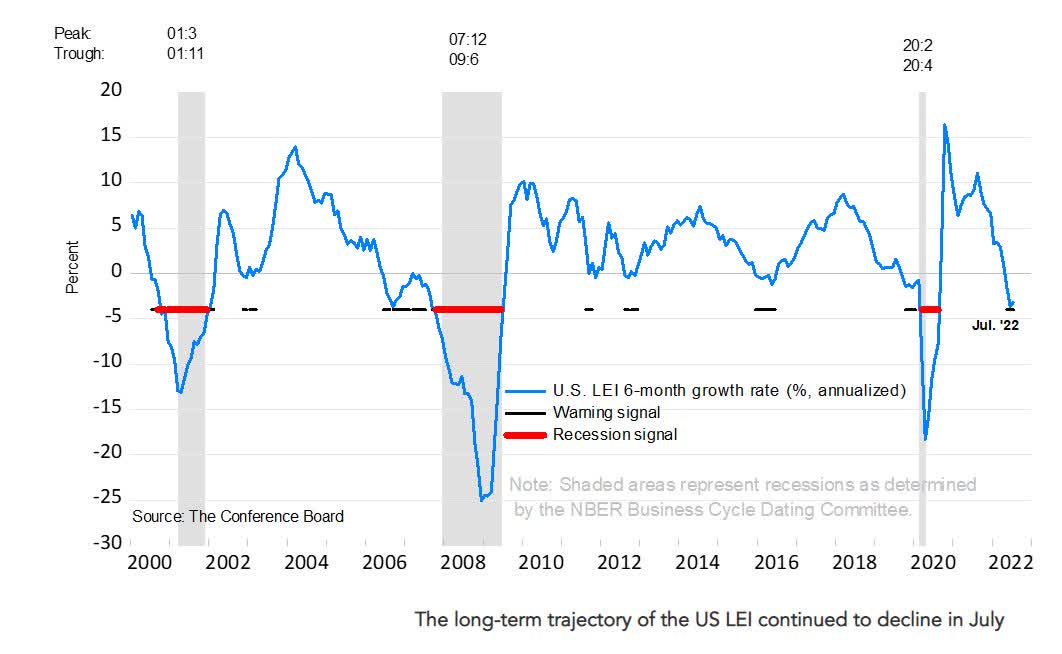
Retail sales were unchanged in July and rose 0.4% excluding autos, with the latter a little stronger than expected. These follow June gains of 0.8% overall and 0.9%. The components were mixed with lots of revisions. Vehicle sales surprised and declined by 1.6% after rising 0.5% in June.
Manufacturing
The Empire State index plunged to a remarkably deep 2-year low of 31.3 in August from 11.1 leaving the weakest reading since two massive-negative figures at the start of the pandemic of 78.2 in April and 48.5 in May of 2020.
NY Fed Manufacturing (www.newyorkfed.org/survey/empire/empiresurvey_overview)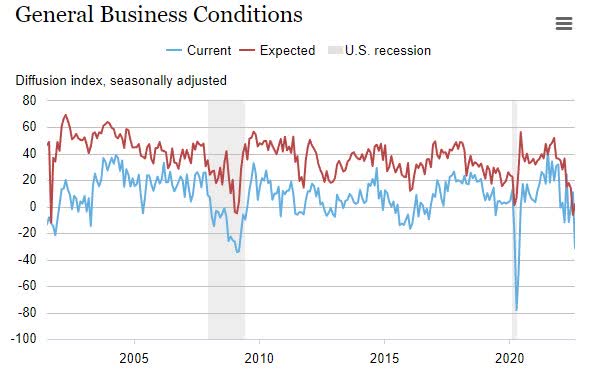
The series dates back to July of 2001, and the only other two weaker readings were in the 2009 recession.
Analysts saw a similar plunge for the ISM-adjusted Empire State, to a 2-year low of 44.9 from 56.6. This report extends the 9-month producer sentiment pull-back from robust peaks in November of 2021 and suggests downside risk for upcoming sentiment reports despite the lift analysts might see from improved financial conditions.
The Philly Fed rebounded to 6.2 from a 26-month low of -12.3. Analysts also saw an ISM-adjusted Philly Fed pop to 54.0 from 48.3 in July and 52.6 in June which also reversed the two lowest readings since May of 2020, and the only reading below the 50-mark.
Housing
The NAHB housing market index dropped another 6 points to 49 in August, another weaker-than-expected print. It follows the 12-point plunge to 55 in July, which was the largest point tumble since the 42 drop in April 2020. This is an eighth straight monthly decline and the lowest since May 2020. The index was at 75 a year ago. The report noted builder confidence continues to get hit by the FOMC”s rate hikes and persistently higher building costs.
Building Permits and Housing Starts were released for July. Building Permits came in modestly better than expected (1.67 million versus 1.64 million expected), while Housing Starts missed by nearly 100K (1.44 million versus 1.53 million expected).
Existing home sales look poised for a 36% contraction rate in Q3 after a 38.1% rate drop in Q2, due to remarkably limited supply and surging mortgage rates. Analysts expect a 5.27 million existing home sales total for 2022, after-sales of 6.12 million in 2021, 5.64 M in 2020, and 5.34 M in the pre-pandemic year of 2019. This translates to a -14.0% drop in 2022, after increases of 8.5% in 2021 and 5.6% in 2020.
The Global Scene
Germany’s ZEW survey for August came in bleak at 47.6 for the current situation and 55.3 for expectations. These stats are in line with recent German data as the nation lags behind the EU on the growth outlook.
China deemed it necessary to cut interest rates as both retail sales and industrial production missed estimates badly. China’s PBoC cut its medium-term lending facility rate from 2.85% to 2.75%. Retail sales grew by 2.7% in July from a year ago, and that was well below the 5% growth forecast by a Reuters poll, and down from growth of 3.1% in June. Industrial production rose by 3.8%, also missing expectations for 4.6% growth and a drop from the prior month’s 3.9% increase.
Japan’s economy surprised analysts. While Japanese GDP missed estimates for Q2, upward revisions to Q1 data pushed real output into growth territory (+0.1%)for that quarter. Q2 GDP rose 0.5% which translates into an annualized rate of 2.2%.
However, services sector data from Japan shows how COVID’s impact on that part of the economy is still being felt with activity well short of pre-COVID levels.
The Fed
Many analysts and investors are still entertaining a FED PIVOT being in the cards in the near term. That won’t happen unless this time is different or inflation rolls off a cliff by year-end.
History shows the FED has NEVER ended a rate hiking cycle with the FED’S funds rate lower than CPI. If we assume a Fed Funds rate around 3% or so at the end of this year and inflation dropping back to 5% (a pretty aggressive move lower) the FED will remain in the rate hiking cycle.
The ONLY other alternative is for the FED to back off their 2% Inflation target and raises that to 3%-3.5% to align with the targeted Fed Funds rate. Right now that is sheer speculation, but I wouldn’t rule that out. I also wouldn’t be shocked to see a Fed Funds rate at 4+% with inflation at that level as well.
FOMC minutes didn’t provide any real new information nor did they lean particularly hawkish or dovish. And they did not provide real clues to the September decision, be it a 50 basis point or 75 bp move. Remember there are several more key data reports ahead. What is clear is; policy is data-dependent, and nothing has changed in that regard.
Earnings
Walmart’s (WMT) earnings report this week marked what we generally consider to be the unofficial end of earnings season. The BULLS are sad to see this one come to an end. Through Tuesday’s close, the S&P 500 was up over 10% since earnings season began July 8th, and that represents the best earnings season performance for the index since the Q2 reporting period in 2009.
Q2 earnings have beaten estimates by 3.3%, but forward estimates are being revised sharply lower. Q3 earnings estimates have been revised about 5% lower since 6/30, and Q4 estimates by 3.6%. I believe we could see the negative revision trend continue, as the economy weakens. High inflation is weighing on purchasing power, the inverted yield curve is resulting in tighter credit conditions, and economic demand surveys are softening.
Therefore, earnings estimates could still be too high. That said, I do not expect earnings to fall off a cliff or a total economic collapse. Banks are very well-capitalized, balance sheets are not overextended (supply has been hard-pressed to meet demand this cycle), and inflation is showing signs of potential moderation ahead. It is also important to remember that the market will bottom before the economy and earnings, and we may have already seen that.
Food For Thought
The global transition to “green” is a toll road that leads to China
The U.S. solar industry is facing disruptions as U.S. officials crack down on human rights abuses in China’s Xinjiang region, the same region that produces almost half of the world’s crucial components for solar panels. Several Chinese solar-panel suppliers have had shipments detained in the U.S. or sent back as customs agents enforce a new law.
No one will argue the restrictive policy due to apparent human rights issues. However, there remains the ongoing issue that the US (and others) are solely dependent on China for its solar components. China accounts for 97% share of silicon wafers production, 79% share of PV cells, and 67% share of polysilicon.
However, that is only one aspect of how China will dominate the transition. The push to green will also keep the US a slave to China and other entities when it comes to the materials necessary to make the transition to green viable. Every day that the US goes deeper into the EV transition, the deeper the hole we will find ourselves in regarding dependence on China.
The US and other countries are ill-equipped to complete this transition alone. China processes 80% of the world’s cobalt, controlling 70 percent of the mining industry in the Democratic Republic of the Congo, home to almost all of the world’s cobalt, a critical component of lithium-ion batteries.
Then there is electrolytic Manganese metal, which China happens to control 95% of the world’s production. When it comes to Lithium, all roads lead to China. They have become the 3rd largest lithium producer in the world, outproducing the U.S. in 2020 by more than a factor of 15. While the US does have lithium it currently produces just 2% of the global supply. China itself could not have written a better script to ensure its dominance in the future.
From an investment standpoint Global Miners I am familiar with ALB, LAC, LTHM, and SQM are all in BULLISH trends, and worthy of investment. I own select names in this group.
The warning siren was sounded back in 2019, and those warnings were roundly criticized. When the pandemic rolled around and the U.S dependence on China was magnified, another round of action was proposed to alleviate the ongoing problem. We’ve now seen how that criticism was unfounded and foolhardy.
Perhaps companies are finally seeing the handwriting on the wall and are taking action themselves. The corporate world always leads the way, while present policy digs a deep hole that will be difficult to get out of. Apple (AAPL) has announced it will begin to shift production of watches and mac books to Vietnam from China.
TAX and SPEND is another boondoggle
Last week I spoke about the proposed Tax and Spend legislation that is now law. Scott Grannis wrote an excellent summary citing the same issues regarding Government Tax revenues. In addition, he explains why the recently passed legislation is BAD for the economy.
This legislation is yet another speedbump in the potential road to recovery.
Sentiment
Bullish sentiment continued its recent run of increases according to the weekly AAII individual investor sentiment survey. Hitting 33.3% this week, bulls are at the highest level since the last week of 2021. However, these readings are nowhere near what would be considered exuberance levels in the 50–55% range. The fact that 2022 is nearly 2/3 complete and we still haven’t seen a bullish reading over 33.3% tells you how negative investors have been this year
The Daily chart of the S&P 500 (SPY)
After the ~18% rally off the June lows, the S&P has stalled, and it’s no coincidence where the pause has occurred. Resistance has proven to be formidable in the 4300-4350 range.
S&P 500 Aug 19 (www.FreeStockCharts.com)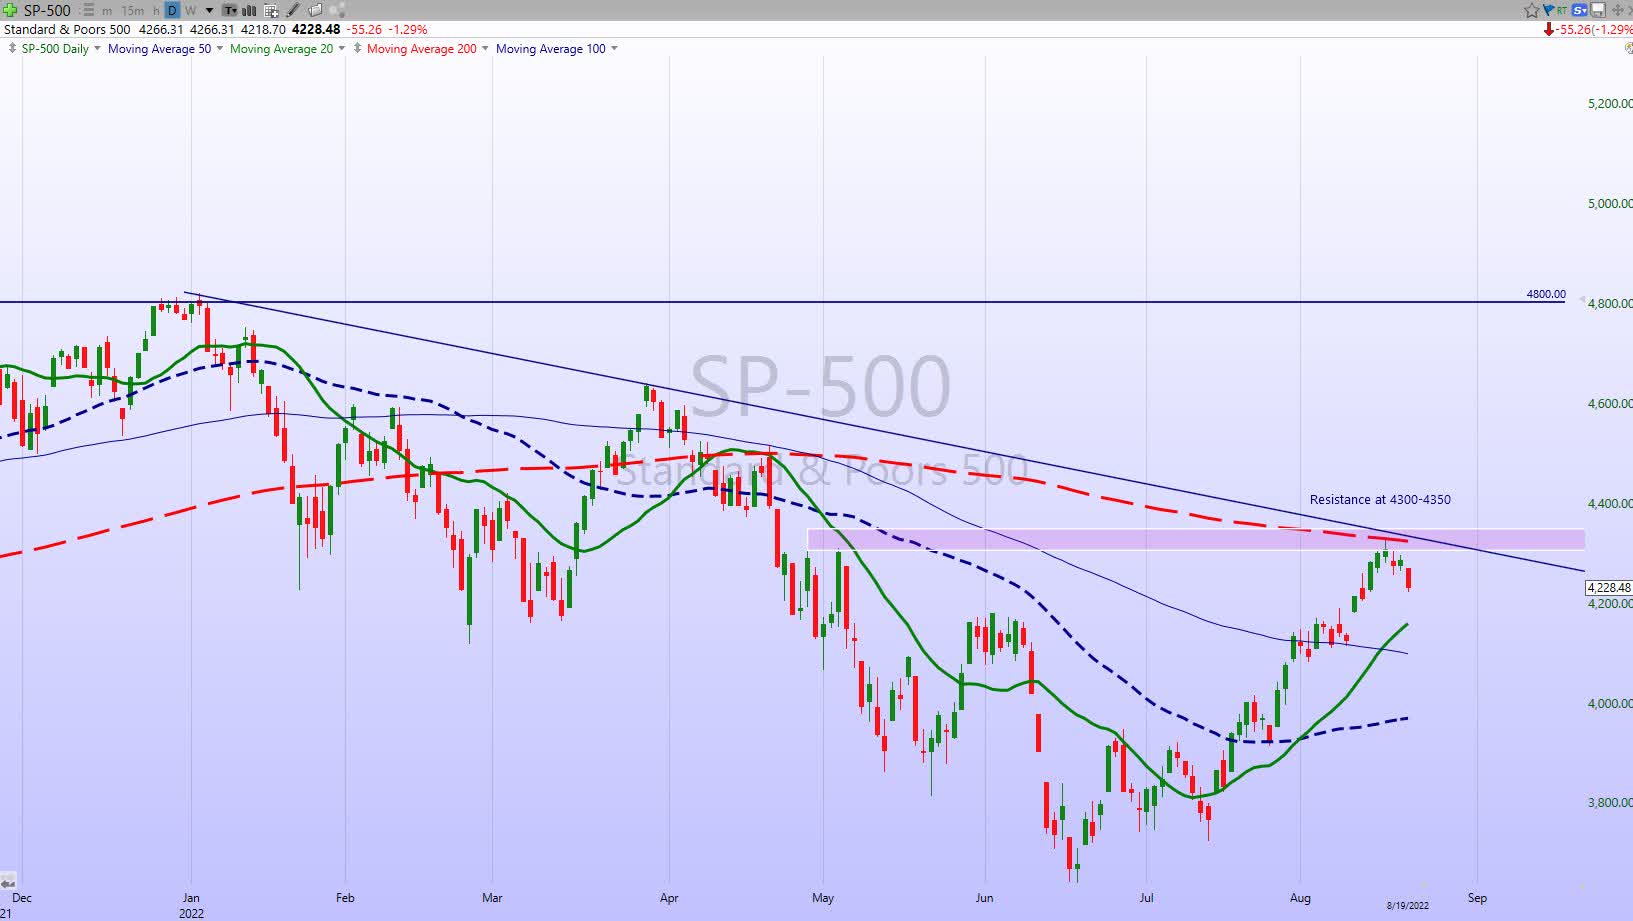
There is plenty of support for the BULLS to rely on and the picture presented appears to also include a potential trading range being established. Investors will soon find out if this mini-uptrend was just another in a series of BEAR market rallies that have eventually led to more lows. The 2022 downtrend has not been broken.
Investment Backdrop
The notion of a Fed Pivot is fantasy. The talk that the Fed is sending mixed messages is pure nonsense. It appears market participants are hearing what THEY want to hear and dismissing all else. The Fed is going to be raising rates until the Fed funds rate is above inflation. As mentioned earlier the only “change” I can see in policy going forward is a consideration that the 2% inflation target has to be raised.
Today’s investment scene is very complex. Most of the market signals have been inconclusive. A weakening economy and stubbornly high energy costs that will fuel inflation add more concerns. Adding taxes and additional spending during this backdrop exacerbates the situation making the Fed’s job even more difficult. Consumer confidence is at historic lows and NFIB Small Business Optimism won’t rebound quickly as uncertainty over more taxes and IRS scrutiny add uncertainty. The anti-business backdrop is as strong as ever with the FED in tightening mode.
Conversely, earnings are resilient, and the recent price action is positive, but stocks are overbought in the short term. That is why investors keep asking the same question; How much of these factors have been priced into the averages? With all of the indices at a critical technical juncture, we will start to get answers soon. What happens after the near-term overbought condition is resolved may answer some of the questions investors are concerned with.
Until there is more clarity, staying with a mindset that this is a “Market of Stocks” will enhance results.
Thank you for reading this analysis. If you enjoyed this article so far, this next section provides a quick taste of what members of my marketplace service receive in DAILY updates. If you find these weekly articles useful, you may want to join a community of SAVVY Investors that have discovered “how the market works”.
The 2022 Playbook is now “Lean and Mean”
Opportunities are condensed in Energy, Commodities, and Healthcare. Along with that I’ve defined Bearish to Bullish reversals in three other areas of the market that have led to massive gains (30+%) in the last 6 weeks. The message to clients and members of my service has been the same. Stay with what is working.
Each week I revisit the “canary message” which served as a warning for the economy. The focus was on the Financials, Transports, Semiconductors, and Small Caps. I used them as a “tell” for what direction the economy was headed to help forge a near-term strategy. With the major indices showing some signs of stabilization, it might be a signal that is now lining up with the “consensus” view of a “mild recession”.
I’m not there yet but if the price action tells me that, I will gladly reconsider my forecast.
Small Caps vs. Large Caps
Two weeks ago I mentioned that long-term oriented investors should take a look at the valuation levels on the Russell 2000.
From the fundamental viewpoint, longer-term investors might be witnessing an opportunity for outperformance on the other side of this bear market. The group trades at just a 13x P/E (vs 18.2x average), which is the lowest valuation of the past 20 years other than the Covid shutdown and credit crisis lows. On a relative basis, the small caps trade at a 32% discount to the large caps (vs 6% premium on average), which is the lowest relative multiple outsides of the Covid shutdown low.
Since then small caps as measured by the IWM is up about 7%. Investors have witnessed a nice rally and that begs the question where does that leave valuation levels? Every Index has had PE increase ~1-2X this quarter, but the big picture is still showing large caps as expensive, while small and mid-cap indices are historically inexpensive. Large cap indices will likely stay expensive until we see some resolution to some of the issues that have plagued the equity markets.
Like other indices, the IWM is struggling at resistance but looks like a BUY on a pullback to support.
Sectors
Consumer Discretionary
One negative divergence in the rally has been the inability of the equal-weight Consumer Discretionary sector to show relative strength. High inflation has significantly weighed on the sector this year. Several key retail companies reported recently and for the most part, the reports were positive and well received. Perhaps earnings can now act as a catalyst to improve this key area.
Energy
Energy stocks as measured by the XLE rebounded nicely in the last two weeks posting about an 8% gain. The group will follow the underlying price of crude, and I can envision both moving into a trading range at or near these levels. Some of the highest dividend payouts are in this sector and I see no reason to abandon those positions.
Natural Gas
Another “energy” story that we are following is Nat GAS (UNG). Despite its ups and down in the short term UNG has a strong Long Term BULL trend. I’ve owned UNG for a while and the last batch that was bought on July 8th is up 61%. Just one of the “trends” spotted this year that has Savvy Investors smiling.
Green Energy
Electric vehicle companies aren’t profitable and most are trading on Hopes and Dreams. Let’s face it these are auto manufacturers, nothing more nothing less. Yet, they are trading like high-tech growth companies on steroids. I decided there was a different way of playing the EV revolution and subscribers of my service were alerted to an investment opportunity presented on July 2nd.
I’m not interested in how the EV manufacturers fare. It won’t matter who wins and who loses in EV sales, as there is one segment of the industry that fuels the transition. Charging infrastructure both here and in the EU will be a top priority and the money these fanatics will spend on this is going to be extraordinary. Here is a way to take advantage of the hell-bent obsession to have everyone driving EVs by next Sunday. Two of my top plays in the US have soared 50% and 33% respectively since I wrote that report. There are many opportunities, it just takes a comprehensive strategy to uncover them.
Healthcare
The Healthcare ETF (XLV) hasn’t been glamourous this year but it’s been a steady performer in a BEAR market backdrop. That makes the group a winner. While the sector has gone sideways, there have been select opportunities presented that have reaped nice rewards. Savvy holding, LNTH is one such stock that recently made a new high. Now a stock like ABBV has come down in price and remains in an LT BULL configuration. It pays a 3.8% dividend and is a solid addition to any portfolio.
Biotech
This BEAR to BULL reversal for the XBI is in pause mode after full bloom. This “pause” is expected and considered normal a 40% rally after Savvy Investors purchased the ETF in mid-June. I’ve recently posted an update on what the situation looks like today and I invite everyone to join my marketplace service and take a look.
Technology Sub-Sector – Semiconductors
The semis (SOXX) is another sector that is aligned with the general market. Resistance is just overhead, but before the ETF can take a shot at that it will first have to clear the June highs. Another chart that leaves investors with some uncertainty when dealing with the near term.
ARK Innovation ETF (ARKK)
The rounding bottom pattern representing the Bear to Bull reversal continues, but weakness has set in. Here is another mid-June purchase that has appreciated by 38%. Similar to the other emerging BULLISH patterns, as long as the series of higher LOWS continues, the ETF can move higher.
Cryptocurrency
Cryptos and crypto stocks have flown higher alongside other risk assets this week. While cryptos are overbought, that is not to say these assets are overheating. Historically, when Bitcoin and Ethereum have been in the upper deciles of overbought levels, they have experienced stronger performance. Ethereum has massively outperformed Bitcoin with roughly 3 times as large of a gain over the past week.
Bitcoin (www.bespokepremium.com)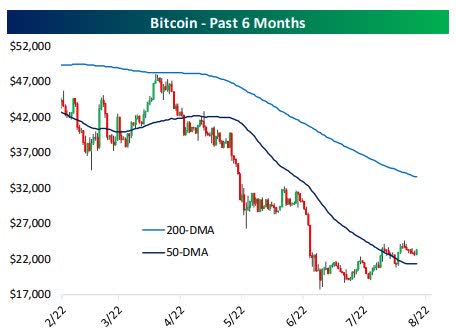
Bitcoin has carved out a narrow trading range just above the 50-day Moving Average. There was another test of that support level on Friday, as long as the series of higher lows continue the stabilizing trend can continue.
Final Thought
One thing investors always have to keep in mind is how emotion controls the market in the short term. Markets can and will overshoot to the downside as well as overshoot to the upside. It is all about momentum and investor sentiment at the time these moves are taking place.
This year we experienced a long period where it felt like the stock market would never go up. Lately, the price action feels like this market just doesn’t want to go down. Seasoned investors realize that none of these feelings last forever, but recognizing these subtle messages helps us better navigate the scene during these short-term swings.
If an investor has followed the messages of the equity market, there is little doubt they have made money during this rebound rally. it serves as another example that leaving out the technical picture handicaps the best investor. After all, if you strictly followed the fundamentals, and stayed entrenched in that mindset you find yourself wondering what went wrong.
Investors MUST come to realize that the stock market has a mind of its own and that “mind” produces emotional swings that at times make no sense to the average investor. We are in one of those periods today. After this rally off the lows, the market is sending mixed signals leaving market participants with a very complex market backdrop.
I never fight the tape and don’t recommend anyone else do so, but in this case, I’m in “pause” mode awaiting the next message.
Postscript
Please allow me to take a moment and remind all of the readers of an important issue. I provide investment advice to clients and members of my marketplace service. Each week I strive to provide an investment backdrop that helps investors make their own decisions. In these types of forums, readers bring a host of situations and variables to the table when visiting these articles. Therefore it is impossible to pinpoint what may be right for each situation.
In different circumstances, I can determine each client’s situation/requirements and discuss issues with them when needed. That is impossible with readers of these articles. Therefore I will attempt to help form an opinion without crossing the line into specific advice. Please keep that in mind when forming your investment strategy.
Thanks to all of the readers that contribute to this forum to make these articles a better experience for everyone.
Best of Luck to Everyone!
Be the first to comment