

wakila
Consumers continue to travel and spend on vacations before summer comes to an end, and the BULLS cite that as their reason to say the US is not in a recession. But while that is occurring the Fed, CEOs, and financial market pundits have been concentrating on the present business climate. The Fed has been navigating challenging inflationary waters, company leaders have been addressing turbulence in earnings and forward guidance, and of course—many economists and investors were talking about the recession train. Investors have reached a point where this backdrop can be viewed as a glass half full or a glass half empty, and if that is truly the case, they both can be correct.
The last statement is still subject to debate but as I’ve declared before I’m not interested in an Official declaration to confirm what we already know. The first half of the year sported negative growth and that drove the equity market into a bear trend. So far, the consumer, who accounts for ~70% of GDP, had not run out of steam. Inflationary pressures have led consumers to spend down the excess savings that were built up by unprecedented levels of fiscal stimulus. While some have utilized healthy levels of financing to complete purchases, consistent job gains and wage growth helped the consumer in the aggregate. In addition to savings, consumers have also tapped some of their credit reserves to keep the spending ship afloat. While it is not an issue at the moment it is something to keep a watchful eye on.
There were casualties as the Fed embarked on its rate hiking cycle, and the first victim was the Housing market. Higher interest rates and economic concerns led to buyers having second thoughts, as nearly 60,000 home sales were canceled in June. This equated to ~15% of transactions—the largest share of cancellations since April 2020. We will see some back-and-forth action in mortgage rates, but investors need to acknowledge that tighter Fed policy has a lagging effect. When we add more rate hikes this will continue to be a drag. So unless we begin to see consumers “adjust” their mindset to higher rates, it’s doubtful any improvement is around the corner. The best way to describe the housing market today – A “cyclical” BEAR market within a Secular BULL trend.
These days consumer sentiment and the price of gasoline are negatively correlated. Gas prices go up and sentiment falls. For the first time in a while, sentiment bounced slightly as average gasoline prices retreated. The primary issue controlling inflation is energy costs. Inflation has “paused” for the first time since early ’21, and while we are seeing a pause in gasoline costs, consumers are going to now witness rising utility bills. We will need to see more “cooling off” for consumer sentiment to improve to acceptable levels. Moderating inflation might be here, but lowering inflation to a reasonable and manageable level is quite another issue.
By its price action, the stock market rallied as it saw some of these “green shoots” that can potentially signal a subtle change. During the earlier part of the year amidst negative Q1 GDP, the equity market saw the glass half empty, forecast the poor Q2 GDP results, and sent stocks into a BEAR market. Given the “green shoots” outlook, the rally off the June lows suggests investors were viewing the glass as half full. Now we may have seen the glass half empty mindset take over once again. The FED delivered a message that has been discussed here since late last year. Policy errors led to inflation and the FED is in a box, and the policy errors continue to offset any action the FED has already taken.
As noted last week, the investment scene is quite complex. I suspect investors are going to vacillate between the glass half full, half empty view for a while. However, my view hasn’t changed. The stock market is going to tell us if those green shoots will take root now, OR if there is more cultivation needed before they become viable.
The Week On Wall Street
The BEARS took immediate control to start the new week. The S&P made it two days in a row with losses that quickly totaled 3+%. The BEAR mindset didn’t discriminate, as every index and sector posted losses on Monday. Tuesday and Wednesday brought indecision as the Jackson Hole meeting continued to dominate the headlines.
When Thursday rolled around bad earnings reports were tossed aside and it was clear investors decided that perhaps the news out of the FED wasn’t going to be so surprising. Every index and sector rallied and the “buying” picked up into the close. It all turned out to be a false setup for a launch to higher prices that eventually failed.
The Fed delivered a dose of reality and the indices sold off in unison. The thoughts of a weekly gain were dashed as the S&P fell ~4%. All of the other major indices lost ground as well. Except for the Russell 2000, all of the other indices have given up their entire August gains.
The Fed
Most of the commentary this week was about what Chair Powell was going to say at the Jackson Hole meeting. From my perspective, there were no new revelations in Powell’s speech. He told it as we know it. The only people that were “surprised” were the folks that have NOT been paying attention. From the market reaction, it appears many have been listening to the “good economy” rhetoric and have proceeded with rose-colored glasses that the White House has given (among other things) out for free. It turns out “free” always comes with a price that is eventually collected.
The FED will remain data-dependent. Inflation is here and the FED isn’t going to slow down in this cycle until inflation is under control. I’ve mentioned many times over — this talk of a pause or pivot is fantasy.
He also told investors what has been said here since late last year. Inflation affects everyone and is more of a burden on the lower to middle-class population. As Mr. Powell noted; there will be more pain for households and businesses to endure during the process of taming inflation.
This rate hiking cycle will continue for at least another 100 – 150 basis points. Unless we see a dramatic drop in inflation (LOW probability) I suspect they will have to go much further in 2023.
Debating whether we will see a 50 or 75-basis point hike is a waste of time. Forecasting when the rate increase will slow to 25 basis points or when they will stop, is a fool’s errand now. Believing that rates will then quickly reverse once they are normalized is a fantasy.
This is a HIGHER for LONGER backdrop until further notice, and for those that have been paying attention, this is something that has been KNOWN for a while.
The Economy
Q2 GDP was bumped up to a -0.6% growth rate versus -0.9% in the Advance report. Nothing has changed. We still have back-to-back quarters of negative growth.
Consumer
Personal income increased 0.2% in July and consumption was up 0.1%. In June, income rose 0.7% and spending climbed 1.0%. The July income and spending increases are the smallest of the year. Wages and salaries also rose 0.8% from the prior 0.6%. Disposable income was up 0.2% from 0.7%. The savings rate was unchanged at 5.0%.
The PCE chain price index fell by 0.1% following June’s 1.0% surge. It is the first decline since April 2020. The core PCE measure edged up 0.1% from 0.6%.
The final Michigan sentiment report revealed an upwardly-revised increase in August to 58.2 (was 55.1) from 51.5 in July and an all-time low of 50.0 in June. The pandemic low was 71.8 and this report is 13 points below that. Sentiment remains well below the early pandemic bottom of 71.8 in April of 2020, as well as the 88.3 cycle-high in April of 2021.
It continues to be difficult for those that are trying to put lipstick on these data reports. They are what they are and they are all pointing to very subdued growth and or a long period of contraction.
Manufacturing
The Chicago Fed National Activity Index for July came in better than expected at +0.27 versus expectations for a reading of -0.25. That was the extent of “good” news on the economy for the week.
The Richmond Fed manufacturing index dropped to -8 in August, below forecasts, after bouncing 9 points to unchanged in July. This is the third negative print in four months.
U.S. PMI data is now at levels last seen during the pandemic
Composite Output Index at 45.0 (July: 47.7). 27-month low.
Services Business Activity Index at 44.1 (July: 47.3). 27-month low.
Manufacturing Output Index at 49.3 (July: 49.5). 26-month low.
Manufacturing PMI at 51.3 (July: 52.2). 25-month low.
US PMI (www.pmi.spglobal.com/Public/Home/)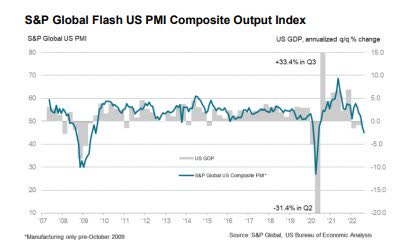
Housing
New home sales dove 12.6% to 511k in July, much weaker than expected as rising mortgage rates and declining affordability continue to take their toll. Sales dropped 7.1% to 585k in June. There were 464k homes for sale, up from 450k previously. The month’s supply of homes soared to 10.9 from 9.2 and is the highest since March 2009. It is not far from the all-time peak of 12.2 hits in January 2009.
Pending home sales fell 1.0% in July to 89.8 after dropping 8.9% to 90.7 in June. The index has dropped in eight of the last nine months and is at the lowest level since the all-time nadir of 71.6 in April 2020. The 12-month pace slid to a 22.5% y/y contraction rate and has been in negative territory since December, with the rate of contraction accelerating.
In the latest sign of falling home prices working their way into changed economic behavior, Blackstone (BX) announced that its subsidiary landlord Home Partners of America (acquired for $6bn in 2021) would stop single-family home purchases across 38 metro areas or roughly half of its national footprint. BX’s subsidiary sees the risk of national home price downside outweighing the reward of extremely strong rent growth, and that’s likely to weigh further on housing transaction volume and pricing power going forward.
For those that continue to follow their BIAS and argue that the economy is strong, the data doesn’t lie. ALL of this data is “recessionary” in nature. PMI data is at pandemic lows, and leading economic indicators have rolled over. In addition, we have never seen housing numbers retreat like this without being in a recession. The economic data is aligned with a ‘mild’ recession which can be argued the stock market has already priced in. The data is at pandemic levels while the economy isn’t locked down nor are we in a pandemic. That speaks volumes about the economic destruction that has taken place in the last 18 months.
When one of the biggest players in the market decides to leave the game it has yet another ominous signal for housing.
Whether we are at a bottom and how long this data remains at these levels will determine the path of stocks in the next few months. The consensus view of a “mild” recession is starting to get some “pushback”.
The Global Scene
Global PMI data comes in lower across the board
U.K. PMI
PMI Composite Output Index 50.9 (Jul: 52.1). 18-month low.
Services PMI Business Activity Index 52.5 (Jul: 52.6). 18-month low.
Manufacturing Output Index 42.4 (Jul: 48.9). 27-month low.
Manufacturing PMI(4) at 46.0 (Jul: 52.1). 27-month low
Eurozone PMI
Composite Output Index at 49.2 (Jul: 49.9). 18-month low.
Services PMI Activity Index at 50.2 (Jul: 51.2). 17-month low.
Manufacturing Output Index 46.5 (Jul: 46.3). 2-month high.
Manufacturing PMI 49.7 (Jul: 49.8). 26-month low.
Japan PMI
Composite Output Index, August: 48.9 (July Final: 50.2)
Services Business Activity Index, August: 49.2 (July Final: 50.3)
Manufacturing Output Index, August: 48.3 (July Final: 49.7)
Food For Thought
Let me be PERFECTLY clear I am not against the transition to green energy. I am against the way the “global powers” have decided to go about this business of this energy transition. That argument isn’t opinion. There are enough facts and unfortunately negative consequences to warrant skepticism. This situation MUST be a part of the investment discussion today because it has far-reaching effects on economies and eventually markets across the globe. Dismissing this topic from an economic standpoint is dismissing reality.
There is little need to rehash all of the events leading up to today, they are all well documented. The facts reveal a harsh reality. Rest assured the Eurozone is about to enter into a recession based on a failed energy policy that centered around their obsession with “green”. That is just the beginning of this story.
Here in the U.S. the tax and spend Green Energy bill was passed last week and that highlighted the pros and cons of the bill regarding inflation and increased taxes. In this report, I’m focused on the “green” component of the bill, as I have often wondered why there are never any forecasts and estimates on what the actual impact on the climate will amount to. There are never any quantifiable statistics rolled out to justify expenditures that total hundreds of billions and eventually trillions.
My guess is no one knows how much climate impact there will be from any of these initiatives. Telling everyone that the situation will be so dire “in the future” is simply fear-based conjecture. If the situation is so dire why is it we never hear the green agenda crowd talk about embracing the cleanest form of energy? Nuclear. It’s rarely a part of the conversation. The EU was actually in the process of retiring nuclear plants! We are to believe that in this “emergency” we should be eliminating a clean source of energy?
There are never any fact-based statistics to prove this case for spending, Instead, it’s all emotional rhetoric. It seems the only folks offering any real data are those that suggest the effort and money that we will toss at this issue today will be utterly meaningless 10, 25, and 50 years down the road. The Rhodium Group estimate for CO2 emissions reductions from the recently passed legislation was plugged into the United Nations climate model to measure the impact on global temperature by 2100. The bill will reduce the estimated global temperature rise at the end of this century by all of 0.028 degrees Fahrenheit in the optimistic case. In the pessimistic case, the temperature difference will be 0.0009 degrees Fahrenheit. In other words, the climate provisions in this legislation will have NO notable impact on the climate.
In the meantime, global economies are going to suffer under the weight of this transition that is suddenly deemed absolutely necessary and has to be completed today. Economies cannot continue to subsidize a “green industry” that will not produce a meaningful return on investment. These alternatives cannot compete and do NOT work without subsidies.
Along with this troubling information, there is another issue that no one wants to discuss. Perhaps because it doesn’t fit the “Green Agenda” narrative. If the Amazon rainforest were a country, it would be the seventh largest in the world by area. The Amazon is also one of our most important defenses against climate change.
“By deforesting the Amazon, we are accelerating climate change because we are sending more carbon dioxide into the atmosphere, reducing precipitation and increasing temperatures.”
Deforestation is occurring at an alarming rate. It’s now occurring at the fastest pace in the last 14 years. Correct me if I am wrong, but I haven’t heard anyone bring up this important issue when trying to convince me we have a dire situation at hand because of how we are living life in the world today. Amazingly it is NOT included in the ballyhooed United Nations Climate initiative. During the last global climate symposium, no one stood up and uttered a word about this problem. Instead, the ‘leadership” has come up with a solution that is producing more devastating effects on economies around the world today. It is, however, notable that the $410 billion 2007 Climate Change Act relied in part on a study that curbing deforestation is a highly cost-effective way to reduce emissions. it is also notable how that boondoggle had no positive effect on the climate.
Ironically what is cited by the greenies as their trigger points in their case is caused by the deforestation of the Amazon. Severe temperature swings, wildfires, flood events, etc. EVERY last bit of it can be traced back to the “‘change” taking place in the Amazon rainforest.
The Investment Angle amidst Climate Alarmism
So what does this all have to do with investing? Plenty. We have seen the initial effects of a rush to eliminate fossil fuels and they are ALL negative. No one can make a case that the Eurozone is better off today than they were before it embarked on its failed green agenda. That isn’t an opinion, the facts back up this commentary. Continuing down this path and spending trillions on this endeavor will have lasting effects on economies and perhaps set in motion the factors that keep economies in paralysis for years to come.
There is a lot of opinion and emotion in the green argument. Ten years ago we were all told that climate change would cause irreparable damage to the Great Barrier Reef. Fast forward to today, and the SAME warnings are being sounded, yet the Reef has more coral cover than ever.
Great Barrier Reef (www.thecourier.com.au/story/7069344/see-it-before-its-gone-a-fact-check-on-the-decline-of-our-biggest-coral-reef/)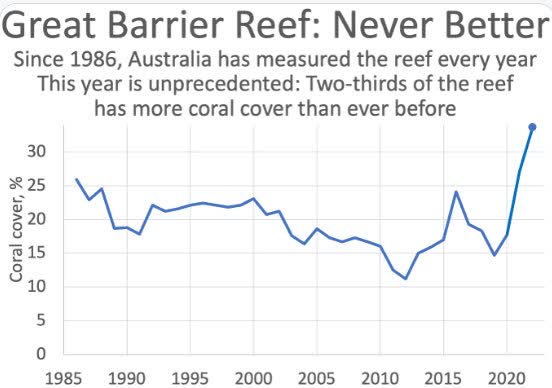
Climate alarmism leads to bad policies that cost trillions that do not offer the help that is being touted. That spending which is subsidizing an industry that has little to no quantifiable return on investment will weigh heavily on global economies. More importantly, the “agenda” is ignoring other factors like the Amazon rainforest issue along with what is occurring in the rest of the world.
China recently announced plans for a 50% in increase in new coal plants to meet energy demand, and they plan double down on coal with their Zhundong deposit that can support China’s energy demands for more than a century. While that is going on, other developed nations including the US have declared war on fossil fuels. That mindset has caused real quantifiable damage to society, and that alone confirms the negatives outweigh the benefits of this “war” by a wide margin.
Since we are speaking in the context of “investing”, there are opportunities to take advantage of the mania that has gripped the scene. There will be decent equity rallies in anything associated with “green”. However be advised that for the most part, the “green” sectors are trading at bubble-like valuations. There will be profitable companies that emerge but there will also be many failed endeavors as well. I favor the Lithium miners for a longer-term holding since they will be turning real profits. If common sense arrives on the scene Uranium and the benefits of clean nuclear energy will have to be part of the conversation, and that will open the door to longer-term opportunities. The other segments of the transition will go through periods of HIGH volatility and can be used as trading vehicles.
Sentiment
AAII sentiment survey showed bullish sentiment dropped from 33.3% last week down to 27.7%. That was the largest single-week decline since an eleven percentage point drop the week of June 9th. Bullish levels remain well below normal levels.
Sentiment remains in favor of bears for the 21st week in a row.
The Daily chart of the S&P 500 (SPY)
Last week I noted that;
Resistance has proven formidable in the 4300-4350 range. Investors will soon find out if this mini-uptrend was just another in a series of BEAR market rallies that have eventually led to more lows. The 2022 downtrend has not been broken. “
S&P Aug 26th (www.freestockcharts.com)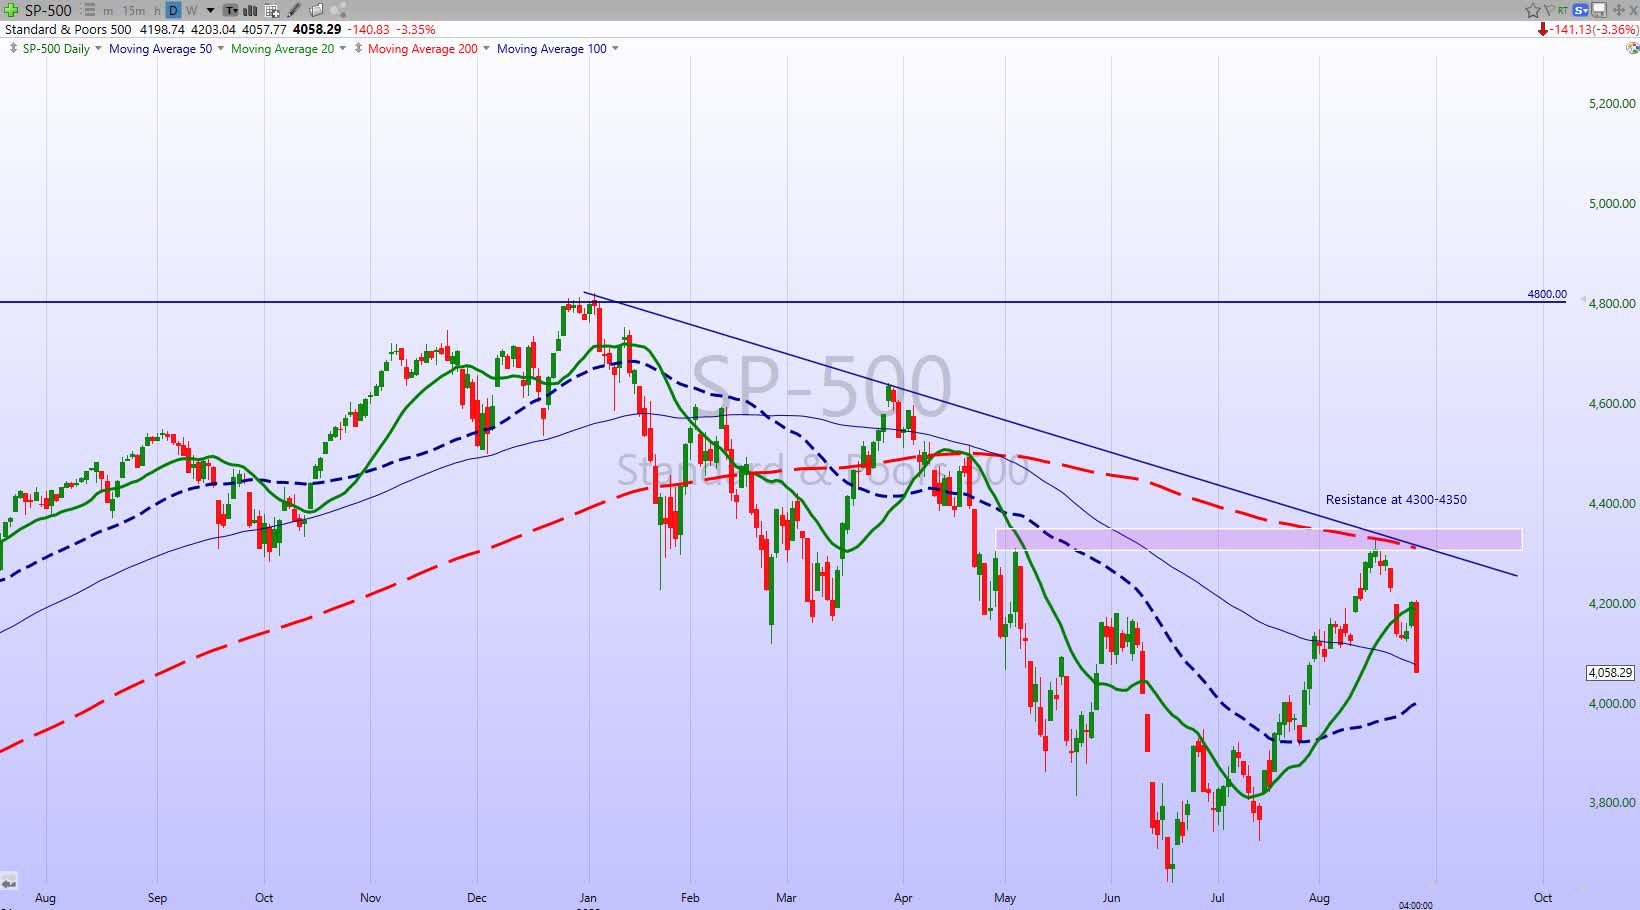
This week’s price action has played out in favor of the BEARS and for now, we can say the recent rally was not the start of a reversal in the primary trend.
Investment Backdrop
It’s ALL about the “technical” set up in the major indices. For those that continue to remind me that technical analysis is overrated, I wish them the best of luck. The recent price action looks like a textbook example of a bear market rally grinding to a halt right at resistance, the S&P 500’s attempt to take out its 200-day moving average proved extremely unsuccessful in its first and only attempt. The BULLS left town and appear to be on vacation heading into this week as the S&P 500 has bookended last weekend with declines of over 1% on each side. A selloff that intensified as the week came to a close.
Rallies can’t go on forever, so the pullback shouldn’t surprise anyone, but if the bulls don’t get back on the field soon, the S&P 500’s chart will only look increasingly worse.
Seasonality is not on the side of the BULLS
With September on the horizon, summer is, unfortunately, coming to an end quickly. From a seasonal perspective, September has historically been the weakest month of the year for the US stock market. Over the last 100, 50, and 20 years, the Dow has averaged declines in September; no other month has this kind of negative consistency.
Over the last 50 years, the Dow has averaged a decline of 0.92% in September with positive returns just 38% of the time. Every other month has seen positive returns more than 50% of the time.
Historical data has revealed that the recent 50% retracement off of the S&P lows suggests that the June low was the extent of this BEAR market decline. That commentary was making the rounds with the S&P at 4250. While we should always refer to past market activity to help navigate the situation today, I’m going to avoid getting too wrapped up or giddy over that fact. There is plenty of room for a market participant to get crushed before we get close to the lows around 3650. A drop to around 3900 (well off the lows) would represent a 7+% pullback. But as we have seen before the average stock can drop a lot more than the “averages”. The bottom line is that revelation is immaterial to the more active investor.
The volatility continues. On Wednesday only 18% of NYSE operating companies were above their 10-day moving averages just a few days after 90% were above them. Those types of rapid swings make this a VERY difficult market to navigate, never mind forecast. The extent of this and other drawdowns will give us another clue. In the meantime, many situations continue to “work” – STAY WITH THEM.
Thank you for reading this analysis. If you enjoyed this article so far, this next section provides a quick taste of what members of my marketplace service receive in DAILY updates. If you find these weekly articles useful, you may want to join a community of SAVVY Investors that have discovered “how the market works”.
The 2022 Playbook is now “Lean and Mean”
Opportunities are condensed in Energy, Commodities, and Healthcare. Along with what I’ve declared money-making Bearish to Bullish reversals. The message to clients and members of my service has not changed. Stay with what is working.
Each week I revisit the “canary message” which served as a warning for the economy. The focus was on the Financials, Transports, Semiconductors, and Small Caps. I used them as a “tell” for what direction the economy was headed to help forge a near-term strategy. With the major indices showing some signs of stabilization, it might be a signal that is now lining up with the “consensus” view of a “mild recession”.
I’m not aligned with that view, but if the price action tells me that, I will gladly reconsider my opinion.
Investment Sectors
Energy
The Global energy crisis brought about by a failed green energy policy and a corresponding war on “fossil fuels” continues. The implications on economies grow larger by the day. In the latest development, higher Nat gas prices in the EU have halted the production of fertilizers from one of the largest producers in the region. This is yet another example of the “cost” poor policy decisions will wreak on society.
The U.S has decided to give up its energy independence and despite the administration’s request for increased production from other sources, it is VERY apparent these sources aren’t aligned with US interests. Those that are in control hold all the cards and THEIR priorities will rule. Prince Abdulaziz bin Salman;
OPEC+ has the commitment, the flexibility, and the means to deal with challenges and provide guidance on the price of oil including cutting production at any time and in different forms
The Saudis and OPEC+ plus seem fixated on defending the price of oil in the mid $80s. Perhaps they see the need to take the price higher as well. The US has no energy policy other than “green” and the global energy policy is scrambling to fix the energy crisis it created. While these policies are an unfortunate circumstance that will continue to stifle economic growth, in the very near term it ironically has offered great opportunities for investors.
We saw the price of WTI pull back but this is still within the realm of a normal correction.
After going parabolic earlier this year into the beginning of the Russia/Ukraine war, WTI Oil prices have been volatilely bouncing around a wide range between ~$85-120. It’s been a frustrating time for some who are bullish on oil in the bigger picture, and the decline has led many to speculate that the upside move in oil is done and a major top has been made.
That may end up being true, but I still have some doubts. This pullback is still within the realm of normal after the kind of incredible rally that preceded it. The region around $85 has offered some support, so I am not ready to write off Oil and Energy completely. What’s more, I’d say Energy stocks have been very resilient lately considering the decline in oil prices. Part of that can be attributed to the income many of the “oil explorers” are sharing with investors.
Unlike other sectors and the indices, both the Energy ETF (XLE) And the Energy Exploration ETF (XOP) have cleared resistance and currently look to be in better shape than many other sectors now. Energy (+3.7%) led all sectors in what was a losing week for the equity markets.
Natural Gas
Here is a situation that was highlighted to members of my service in May and brought to the attention of readers in these weekly missives soon thereafter. Nat Gas (UNG) continues to look strong with another new high this week. I’ve bought every dip and my view remains the same on this energy play. The situation in the EU is going to get worse before it gets better, and that is a tailwind for Liquified Natural Gas. UNG was flat this week but has gained 16+% in the last three weeks.
My foray into the “liquified” area of the sector has also produced outsized results, as the proxies I’m using to take advantage of the LNG urge are all at new highs. Another area of the market that is outperforming everything else.
Uranium
An extremely volatile commodity position where I’ve experienced sharp rallies and also had to sit thru decent pullbacks. However, this is a longer-term play for me and at the moment the tailwinds are back. If the Green energy movement ever decides to get serious and step into the world of common sense, then Nuclear power generation will be THE solution.
Japan is revisiting its energy needs and Nuclear is now a serious consideration.
Commodities
The Bloomberg Commodity Index (BCI) has retraced ~50% from June’s bottom. In doing so it has recaptured two former resistance levels. Although government economic data, which is lagging, is now showing inflation coming down, commodities, which broadly bottomed in mid-June (along with the equity market), have recovered 12%+.
We may have passed “peak inflation”, but if commodities continue to rally, the pace of improvement on the inflation scene could be frustratingly slow. I suspect China’s actions on how to re-accelerate its economy will be the primary determinant of commodity prices over the next year, and like so many things in China and elsewhere, this is a big unknown right now. However, given this market backdrop, I’m not about to abandon a BULLISH trend
Agriculture
Another segment of the commodity trade has come back to life. Fertilizer companies are once again starting to shine. Despite their pullbacks from highs set in April, the Longer-term trend BULL trend remained in place, and this profitable trade is back in full force.
Financials
What appeared to be a promising attempt to get the Financial group (XLF) back into a positive trend has failed. I’ve avoided this group and others that are in BEAR trends for months. Only my CORE holdings remain in place.
Healthcare
Along with Energy, Healthcare (XLV) continues to hold its own as it remains in a positive BULLISH trend. This group is a great place to “hide out”, and select names are showing solid growth.
Biotech
One of my Bearish to Bullish reversal trends continues to produce profits. This position has produced a 39% return for Savvy investors and the “technical picture” looks positive despite Friday’s selloff. It is time to keep an eye on support levels if this market completely falls apart.
Technology
The Tech ETF (XLK) has followed the path of the major indices. It was turned back at an important resistance level and will have to find support soon to keep this slide in check.
Semiconductors Yet to Make Higher Highs
One thing to keep an eye on is that the Semiconductor Index (SOXX) has not been making higher recovery highs along with the major indices when they were in rally mode.
While the S&P 500 poked above its high from back in May, the SOXX hasn’t even bettered its high point from earlier this month on an absolute basis or relative to the S&P 500. That could be important because SOXX often leads the broad market. Friday it led the entire market down. Full disclosure; I am short the group via leveraged inverse ETFs, and that produced a nice gain on Friday.
ARK Innovation ETF (ARKK)
The ARK Innovation ETF has been tracing out a bear-to-bull reversal pattern that might be in jeopardy.
The ETF has broken and closed below all of the trend lines that offered resistance and the “supposed” support from these levels has not materialized. Only a quick reversal will negate what is a cautionary signal and Friday’s action didn’t help matters.
International Markets
The U.S. and China are near a deal that may prevent Chinese company delistings.
The U.S. and China are nearing an agreement that would allow American accounting regulators to travel to Hong Kong to inspect the audit records of Chinese companies listed in New York and regulators in Beijing are making arrangements for U.S.-listed Chinese companies and their accounting firms to transfer their audit working papers and other data from mainland China to Hong Kong, which could prevent many Chinese companies from being delisted from American stock exchanges.
Chinese company stocks that are traded in New York were all higher on the news. It appears the overhang of the “de-listing” is going to be removed, and if that comes to pass select Chinese stocks are going much higher. (BABA), (KWEB) and (JD) remain my favorites. The group has not outperformed lately but that may be about to change.
Japan
The world’s last hyper-dovish central bank is at the helm of Japan’s economy, which is struggling from high energy prices. Relief from commodities and a dovish central bank is a recipe for domestic risk assets, as is the very weak yen which is a major tailwind for export-oriented Japanese conglomerates. Japanese stocks (EWJ) are also very cheap versus expectations compared to history.
Vietnam
The country has seen a massive export surge in response to efforts at supply chain diversification over the past five years. Exports to the US have nearly tripled since 2016 and are up 40% annualized over the last two years. Relatively small changes in the enormous stock of demand being met by China can have big effects. Vietnamese stocks (VNM) are volatile and illiquid but have enormous potential as they did when doubling in 2017 and 2020/2021.
Patience will be required in these International plays as all remain in BEAR market trends.
Cryptocurrency
While the steep declines last week brought cryptos into the forefront of headlines, the space had been weak for some time now. There has not been much of a clear catalyst for the weakness which is not without precedence. Given no major catalyst could be pointed to for the drop, the key reason is likely technicals. The entirety of the crypto space has been coming back to Earth after trading at very elevated levels versus their 50-Day moving Bitcoin (BTC-USD) averages.
Bitcoin (www.bespokepremium.com)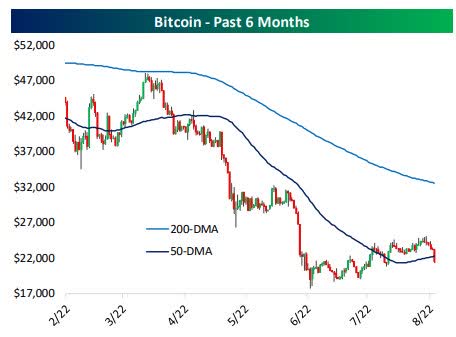
Bitcoin recently suffered a 5-day decline, and streaks of five or more consecutive days of declines have been relatively common in Bitcoin’s history. 2022 has already seen 7 separate streaks of Bitcoin falling for 5 days or more in a row. No other year has come close to seeing that many losing streaks.
Friday’s price action mirrored the equity market as it was a risk-off mindset. Similar to stocks the sector looks vulnerable to more downside.
Final Thought
The data shows the economy is slowing, and the economic destruction seen in the U.S. in the last 18 months speaks volumes. If you are in a camp that refuses to describe the economy as recessionary, so be it. This slowdown is the product of a failed policy agenda that set inflation in motion. To make matters worse the reckless inflationary policies continue, making the Fed’s job to tame inflation even more difficult. The spending mistakes have finally taken hold and the Fed’s actions will add more downward pressure to the scene as they eventually filter down thru the economy. In addition, the rebound in commodity prices especially in the energy sector might be an ominous sign that inflation isn’t about to roll over and die anytime soon.
Where the indices settle will depend on where buyers step in and that will be predicated on the economic data (poor at the moment) and inflation. In this market backdrop, I do not want to be labeled a BULL or a BEAR. With the primary downtrend in place, we have come to realize that being too BEARISH can keep an investor from picking up profits in a rally like we just saw. Being too BULLISH can close your mind to the primary trend in force.
Therefore, it’s about being selective. This is the time to be labeled “OPEN MINDED”. Staying with the situations that are working has been the advice since February. It has proven to be the best strategy for 2022. There is no reason to deviate, no reason to start guessing what comes next. Opportunities abound with select stocks and ETFs and this Savvy investor is thriving in the BEAR market scene.
Postscript
Please allow me to take a moment and remind all of the readers of an important issue. I provide investment advice to clients and members of my marketplace service. Each week I strive to provide an investment backdrop that helps investors make their own decisions. In these types of forums, readers bring a host of situations and variables to the table when visiting these articles. Therefore it is impossible to pinpoint what may be right for each situation.
In different circumstances, I can determine each client’s situation/requirements and discuss issues with them when needed. That is impossible with readers of these articles. Therefore I will attempt to help form an opinion without crossing the line into specific advice. Please keep that in mind when forming your investment strategy.
Thanks to all of the readers that contribute to this forum to make these articles a better experience for everyone.
Best of Luck to Everyone!
Be the first to comment